Method for measuring buprofen/famotidine compound preparation content
A compound preparation and a technology for the preparation are applied in the fields of determining the content of the ibuprofen/famotidine compound preparation by using high performance liquid chromatography, and measuring the content of the ibuprofen/famotidine compound preparation, achieving high precision and repeatability. The effect of good performance and accurate content determination results
- Summary
- Abstract
- Description
- Claims
- Application Information
AI Technical Summary
Problems solved by technology
Method used
Image
Examples
Embodiment 1
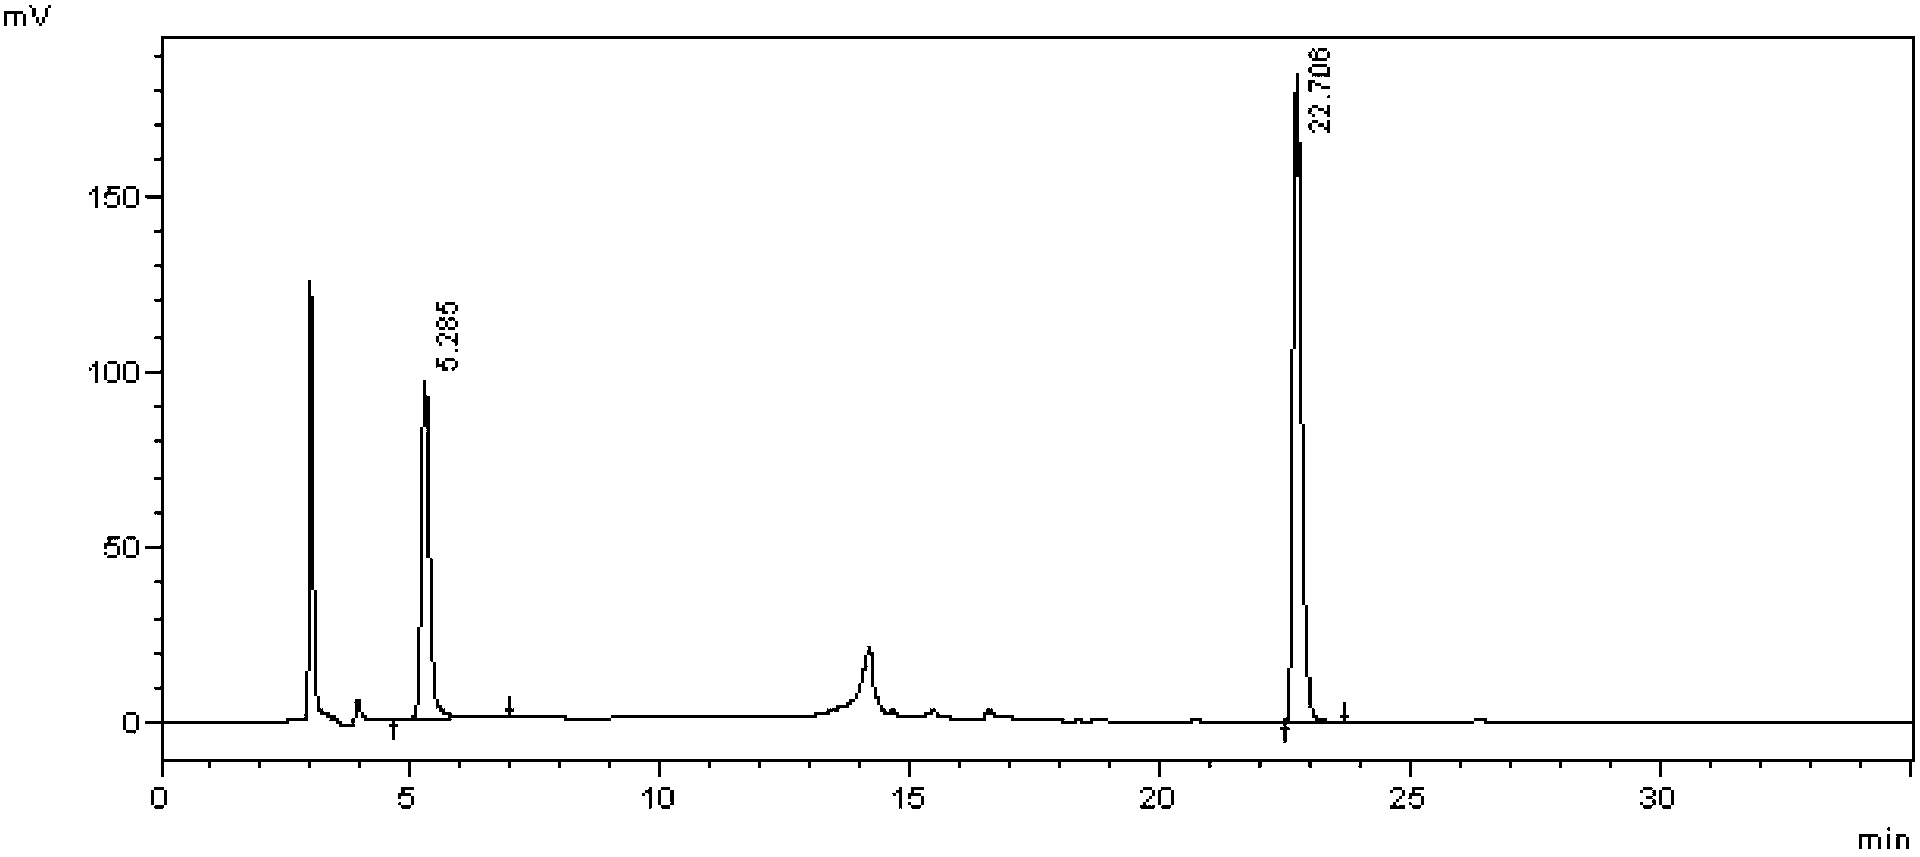
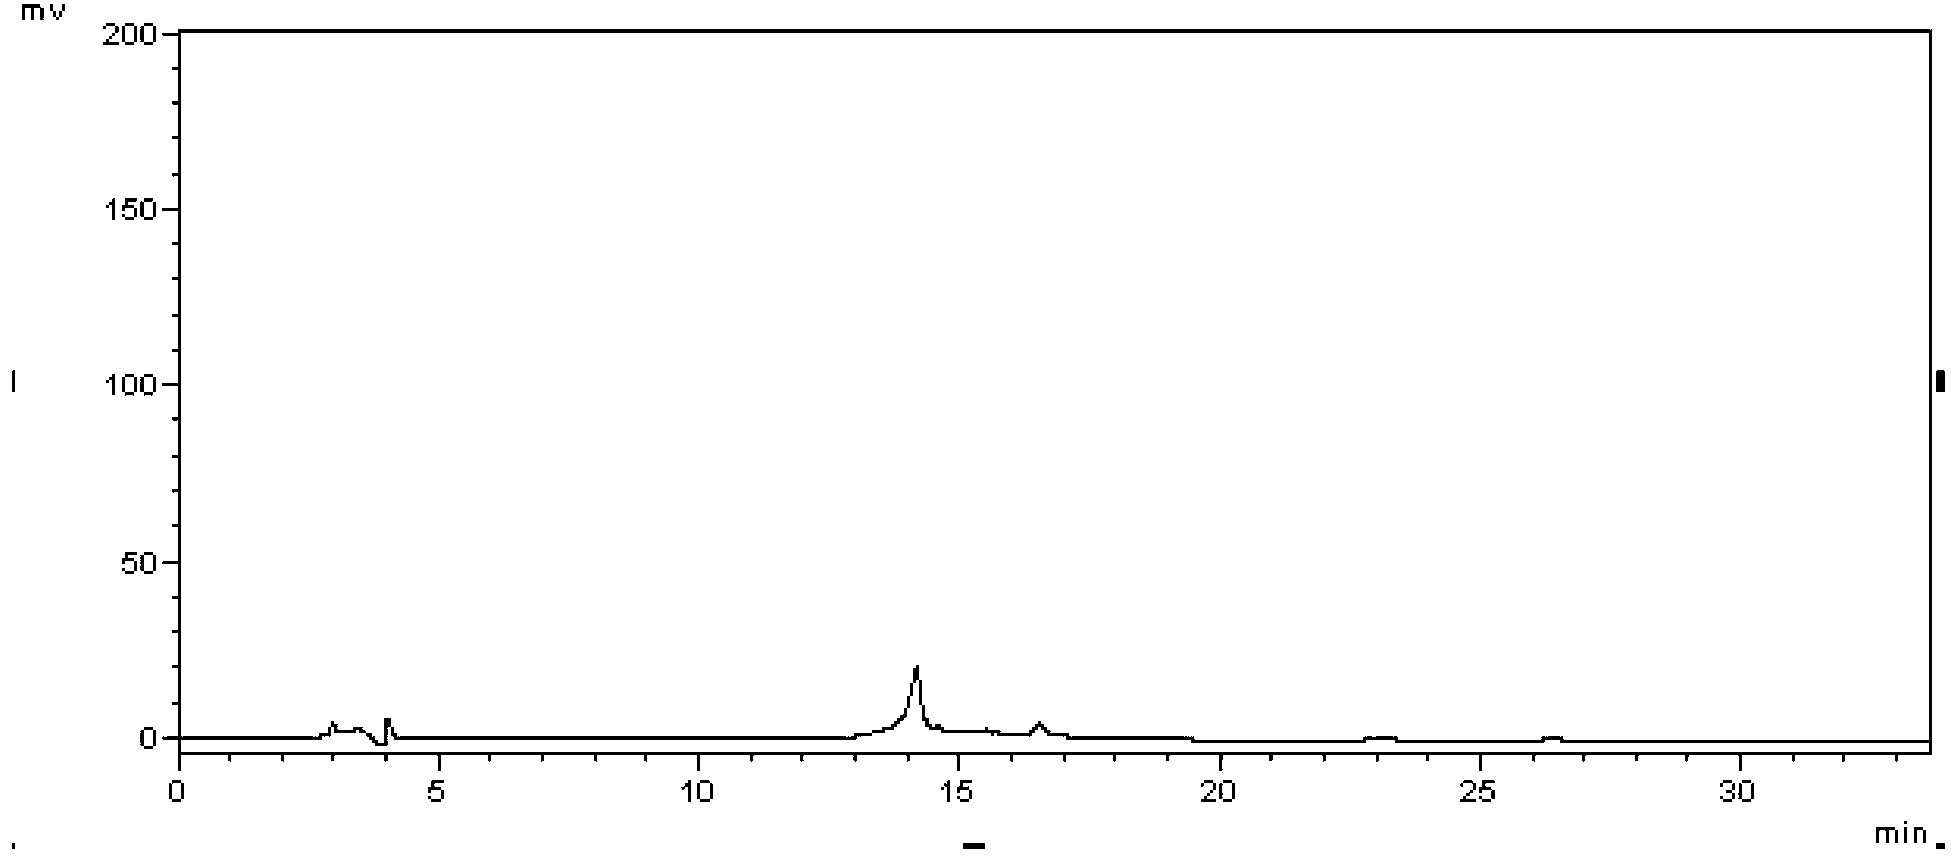
[0018] Embodiment 1 High performance liquid chromatography is measured ibuprofen / famotidine compound preparation content
[0019] Take an appropriate amount of ibuprofen / famotidine compound preparation sample, dissolve it with methanol as solvent, adopt high performance liquid chromatography, use octadecylsilane bonded silica gel filler as stationary phase, according to the following mobile phase conditions, use ultraviolet The detector detects, and calculates the content of ibuprofen and famotidine according to the external standard method.
[0020] Mobile phase A: Dissolve 3.28g of anhydrous sodium acetate solution in 1500mL of water, adjust the pH to 4.0 with phosphoric acid, and then dilute to 2000mL with water.
[0021] Mobile Phase B: Acetonitrile.
[0022] Total flow rate: 1.0mL / min
[0023] Wavelength: 265nm
[0024] Elution gradient
[0025] time (min)
mobile phase A
mobile phase B
0
90
10
7
90
10
10
40
...
Embodiment 2
[0040] The precision research test of embodiment 2 assay method of the present invention
[0041] (1) Linear
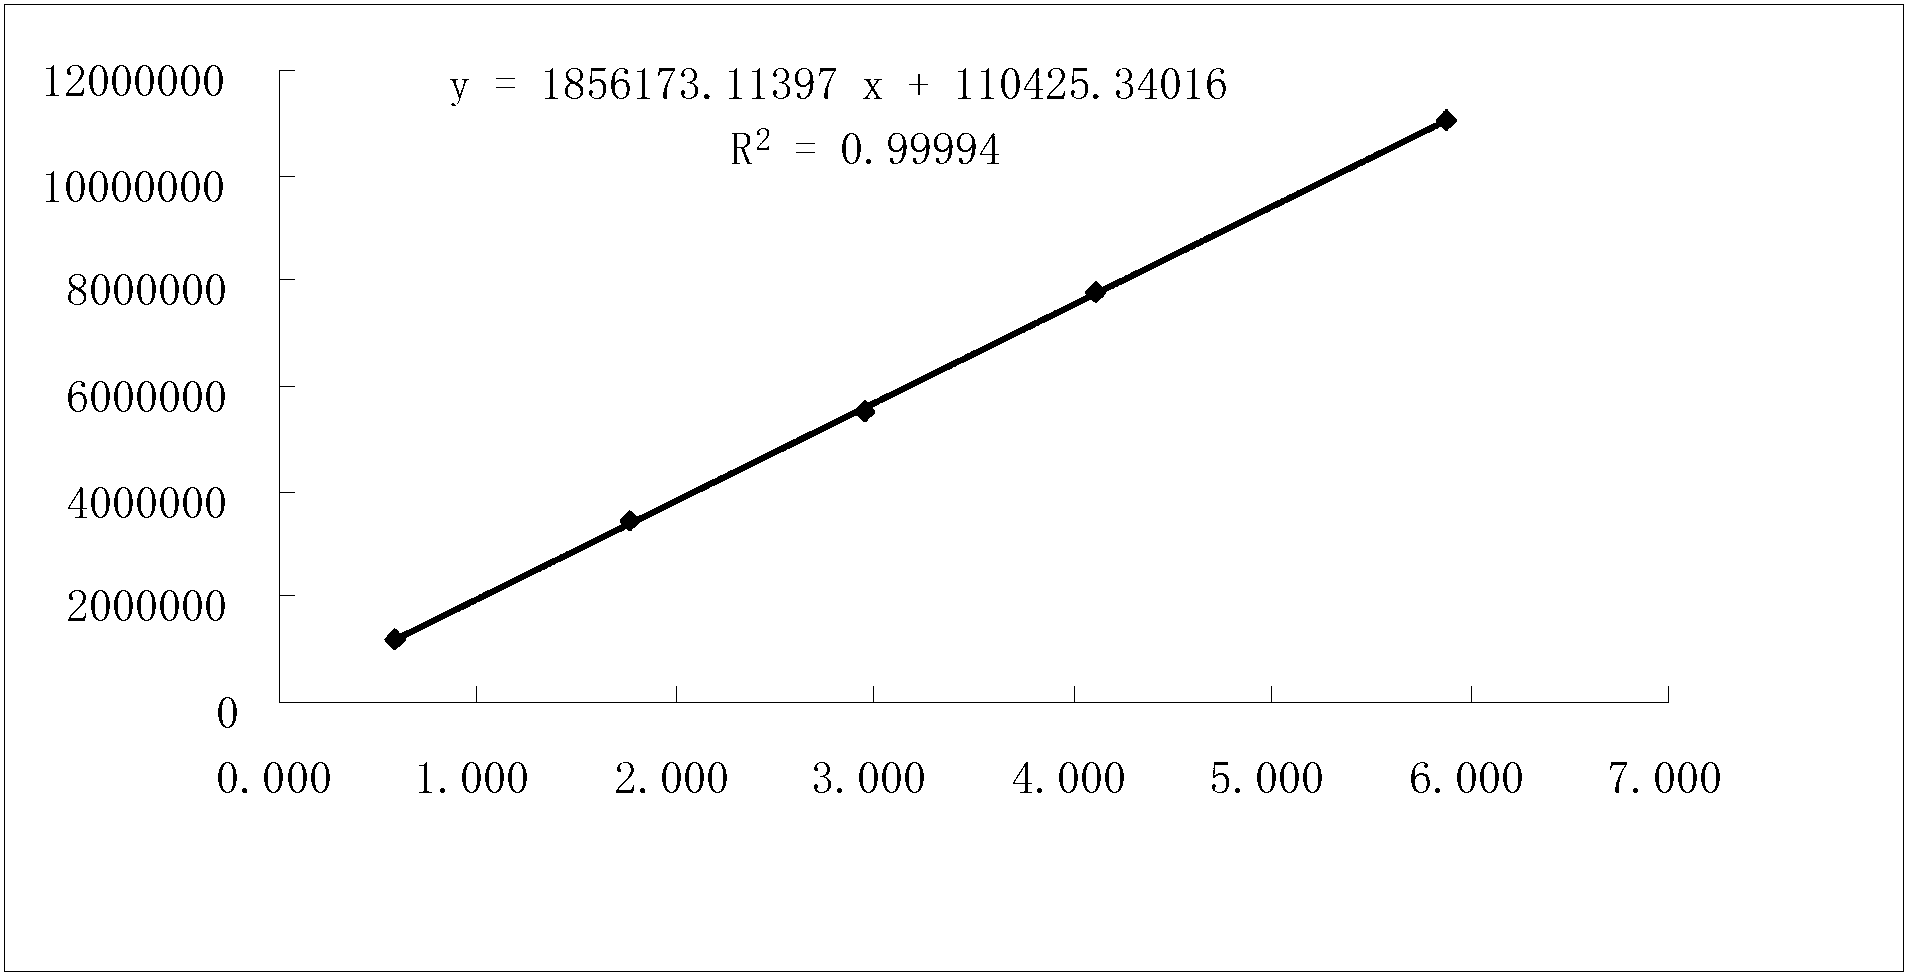
[0042] Take an appropriate amount of ibuprofen and famotidine reference substances, dissolve them in proportion with methanol as a solvent, and dilute according to the gradient concentration, adopt high performance liquid chromatography, use octadecylsilane bonded silica gel filler as the stationary phase, and press Samples were injected under the aforementioned mobile phase conditions, and detected at a wavelength of 265 nm by an ultraviolet detector. With the concentration (mg / mL) as the abscissa and the peak area as the ordinate, draw a regression curve and calculate the regression coefficient. The results are shown in Table 1, image 3 , Figure 4 .
[0043] Table 1 standard curve
[0044]
[0045] It can be seen from the results that ibuprofen showed good linearity in the concentration range of 0.589-5.888 mg; famotidine showed good linearity in the range...
PUM
| Property | Measurement | Unit |
|---|---|---|
| wavelength | aaaaa | aaaaa |
Abstract
Description
Claims
Application Information
 - R&D
- Intellectual Property
- Life Sciences
- Materials
- Tech Scout
- Unparalleled Data Quality
- Higher Quality Content
- 60% Fewer Hallucinations
Browse by: Latest US Patents, China's latest patents, Technical Efficacy Thesaurus, Application Domain, Technology Topic, Popular Technical Reports.
© 2025 PatSnap. All rights reserved.Legal|Privacy policy|Modern Slavery Act Transparency Statement|Sitemap|About US| Contact US: help@patsnap.com


