Spectral analysis method for replacing visible spectrophotometer

A spectrophotometer and spectral analysis technology, applied in the field of spectral analysis, can solve the problems of deviation of placement, transparency of the solution to be tested, high requirements for cleanliness, interference of test results, etc., and meet the requirements of reducing accuracy and technical level. Low, simple step effect

Active Publication Date: 2018-11-09
侯延辉
View PDF6 Cites 10 Cited by
  • Summary
  • Abstract
  • Description
  • Claims
  • Application Information

AI Technical Summary

Problems solved by technology

[0004] 1. It is easy to be interfered by the external light environment, the light sensor must be completely isolated from the external light source, and a proprietary light source must be used;
[0005] 2. There must be complex lenses or mirrors to form a comparison optical path to eliminate the interference of light intensity changes;
[0006] 3. The light transmission consistency and cleanliness of the colorimetric vessels such as contrasting cuvettes are high, and even the position deviation of the cuvettes will bring great interference to the test results;
[0007] 4. The transparency and cleanliness of the solution to be tested are high, and it is easily affected by the sediment particles of the sample to be tested;
[0008] 5. The analysis steps of experimental instruments are cumbersome and highly technical, requiring professional laboratory personnel to operate and maintain

Method used


Image

  • Spectral analysis method for replacing visible spectrophotometer
  • Spectral analysis method for replacing visible spectrophotometer
  • Spectral analysis method for replacing visible spectrophotometer

Examples


Embodiment 1

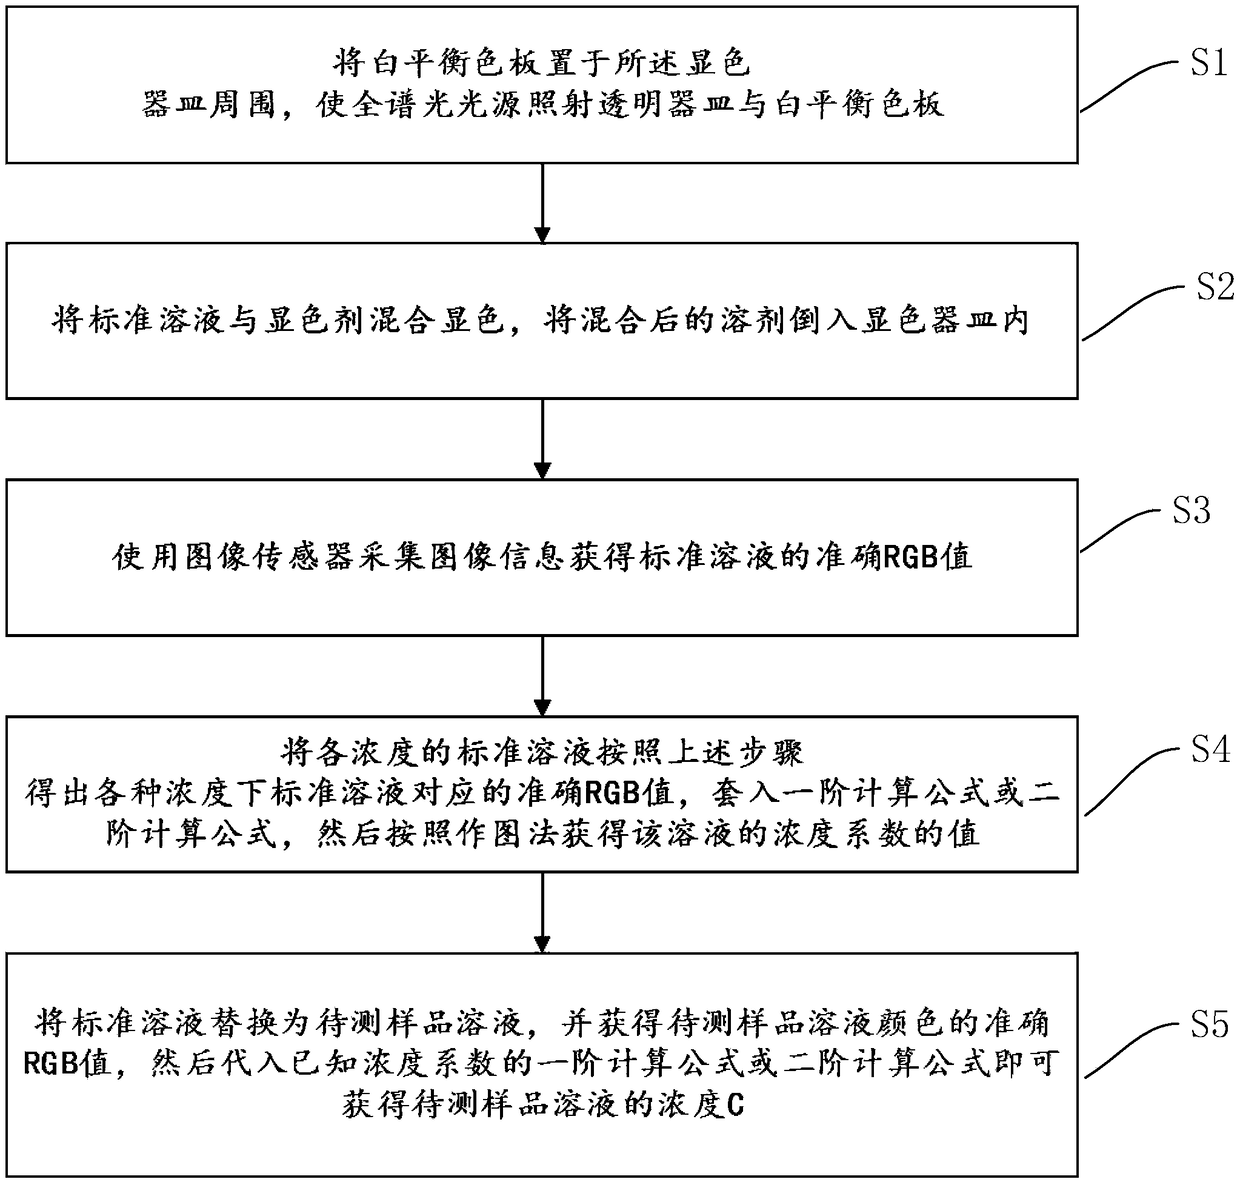
[0035] S1. Use natural light as the light source. The cuvette is a color development and reaction device. A small standard white balance color card is attached to the rear of the cuvette.

[0036] S2. Take the standard samples with ammonia nitrogen standard solution concentrations of 0mg / L, 2mg / L, 5mg / L, 7mg / L, and 10mg / L, and develop color with Nessler's reagent according to the national standard method.

[0037] S3. Place the CMOS sensor or CCD sensor in the direction of the contrast color dish and the white balance color card, and obtain the initial RGB value of the standard sample with a concentration of 0mg / L, 2mg / L, 5mg / L, 7mg / L, and 10mg / L , after white balance processing, the accurate RGB value after color development of each standard solution is obtained.

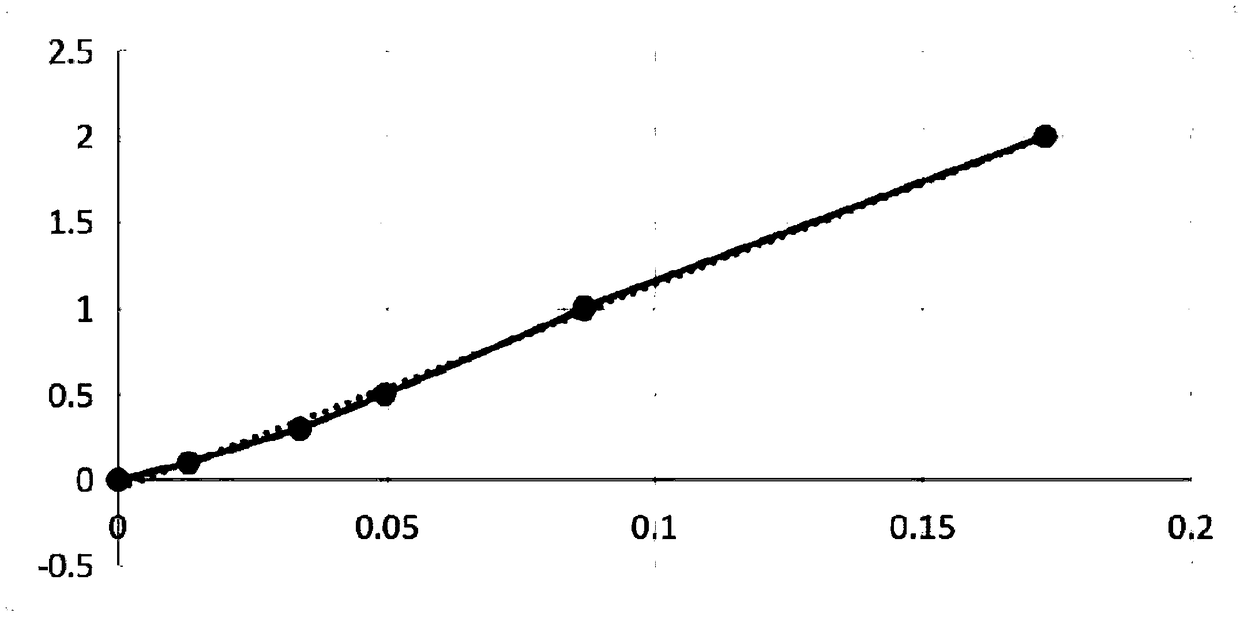
[0038] S4. Calculate R / G, R / B, or G / R, G / B or B / R, B / G from the above RGB values. Use this as the ordinate and the concentration as the abscissa to obtain the K1, K2, and M values ​​of the first-order calculation ...

Embodiment 2

[0051] S1. In this embodiment, natural light is used as the light source, the cuvette is a color developing vessel, and a small standard white balance color card is attached to the rear of the cuvette.

[0052] S2. Take standard samples with total phosphorus standard solution concentration of 0.0mg / L, 0.5mg / L, 1.0mg / L, 1.5mg / L, and 2.0mg / L, and develop color with ammonium molybdate according to the national standard method.

[0053] S3. Place the CMOS sensor or CCD sensor in the direction of the color comparison dish and the white balance color card, and obtain the standards with concentrations of 0.0mg / L, 0.5mg / L, 1.0mg / L, 1.5mg / L, and 2.0mg / L The initial RGB value of the sample, after white balance processing, obtains the accurate RGB value after color development of each standard solution.

[0054] S4. Calculate R / G, R / B, or G / R, G / B or B / R, B / G from the above RGB values. Use this as the ordinate and the concentration as the abscissa to obtain the K1, K2, and M values ​​of...

Embodiment 3

[0063] S1. In this embodiment, natural light is used as the light source, the cuvette is a color developing vessel, and a small standard white balance color card is attached to the rear of the cuvette.

[0064] S2, get copper standard solution concentration and be 0.0mg / L, 0.10mg / L, 0.3mg / L, 0.5mg / L, 1.0mg / L, the standard sample of 2.0mg / L, according to the method of national standard and dicyclohexanone grass Acyldihydrazone develops color.

[0065] S3. Place the CMOS sensor or CCD sensor in the direction of the color comparison dish and the white balance color card to obtain a concentration of 0.0mg / L, 0.10mg / L, 0.3mg / L, 0.5mg / L, 1.0mg / L, 2.0 The initial RGB value of the standard sample in mg / L, after white balance processing, obtains the accurate RGB value after the color development of each standard solution.

[0066]

[0067] S4. Calculate R / G, R / B, or G / R, G / B or B / R, B / G from the above RGB values, use this as the ordinate, and use the concentration as the abscissa t...


PUM


Abstract

The invention discloses a spectral analysis method for replacing a visible spectrophotometer. The method comprises the steps of: selecting a full spectrum light source, a color developing vessel, a white balance color plate, and placing the white balance color plate around the color developing vessel containing a color developing standard solution, using an image sensor to align the standard solution and the white balance color plate, and collecting image information to obtain an accurate RGB value of solution color of the standard solution; putting the accurate RGB value corresponding to thestandard solution into a first-order calculation formula or a second-order calculation formula, and then obtaining a value of a concentration coefficient of the solution according to a mapping method;then replacing the standard solution with a to-be-tested sample solution, obtaining an accurate RGB value of the color of the to-be-tested sample solution, and substituting into the first-order calculation formula or the second-order calculation formula known the concentration coefficient to obtain a concentration C of a to-be-tested sample. The method does not need to be isolated from an external light environment, the cleanliness requirements of the to-be-tested sample solution and a device are low, and experimental steps are simple, easy to operate, and high in accuracy.

Description

technical field [0001] The invention relates to the field of spectrum analysis, in particular to a spectrum analysis method for replacing a visible spectrophotometer. Background technique [0002] At present, most of the accurate means of water pollutant analysis are based on spectrophotometry or colorimetry in spectral analysis. Colorimetry also includes visual colorimetry or photoelectric colorimetry. The accuracy is not as high as that of spectrophotometry. Therefore, spectrophotometry using a spectrophotometer is the most widely used. Spectrophotometry uses a light source that can generate multiple wavelengths. Through a series of spectroscopic devices, a monochromatic light source with a specific wavelength is obtained. When the monochromatic light radiation passes through the measured substance solution, the amount absorbed by the substance is proportional to the concentration of the substance and the thickness of the liquid layer (optical path length). The selective ...

Claims


Application Information

Patent Timeline
Patent Type & Authority Applications(China)
IPC IPC(8): G01N21/25G01N21/78
CPCG01N21/25G01N21/78
Inventor 侯延辉刘茵
Owner 侯延辉
Why Eureka
Try Eureka