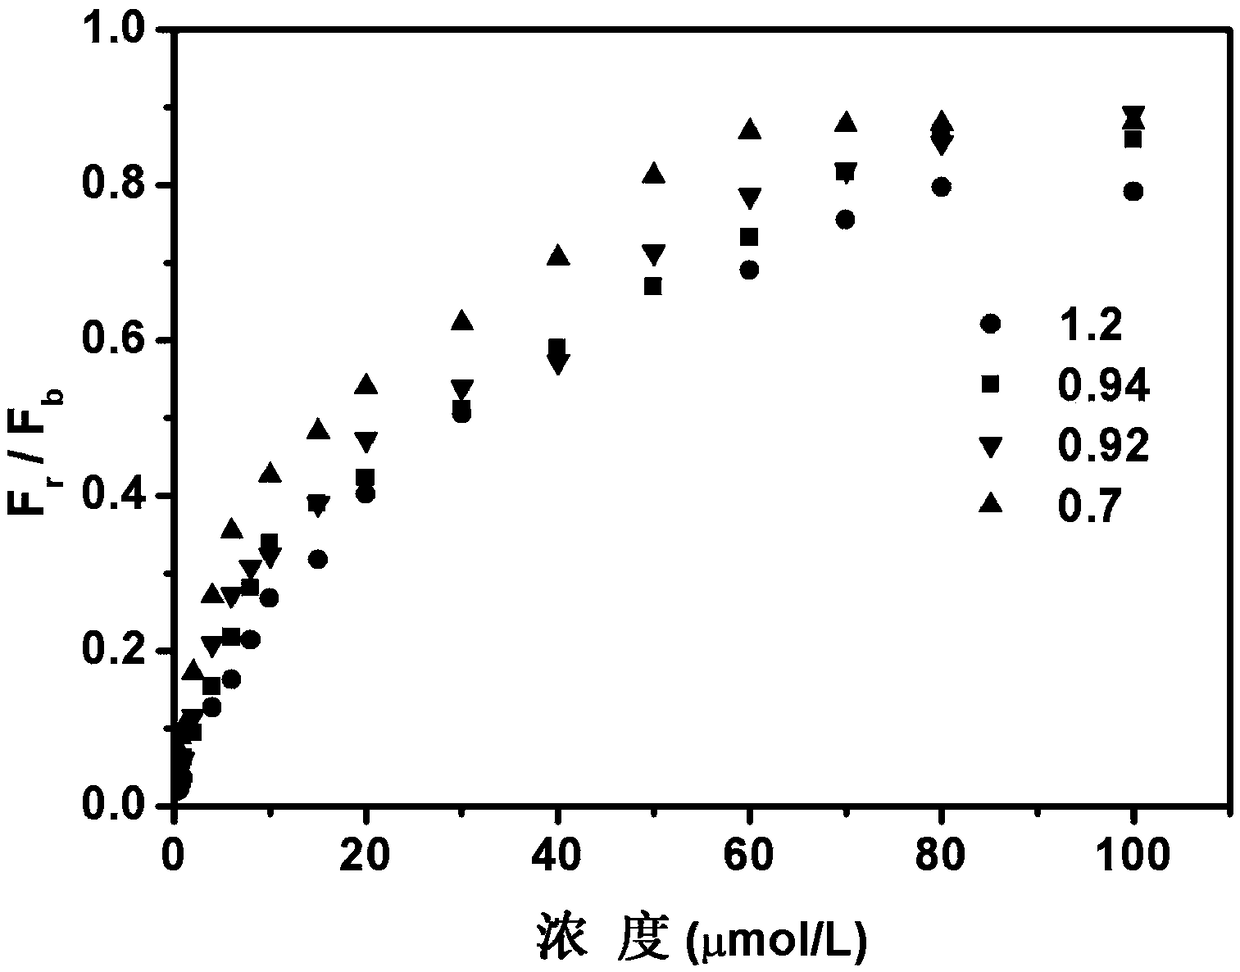
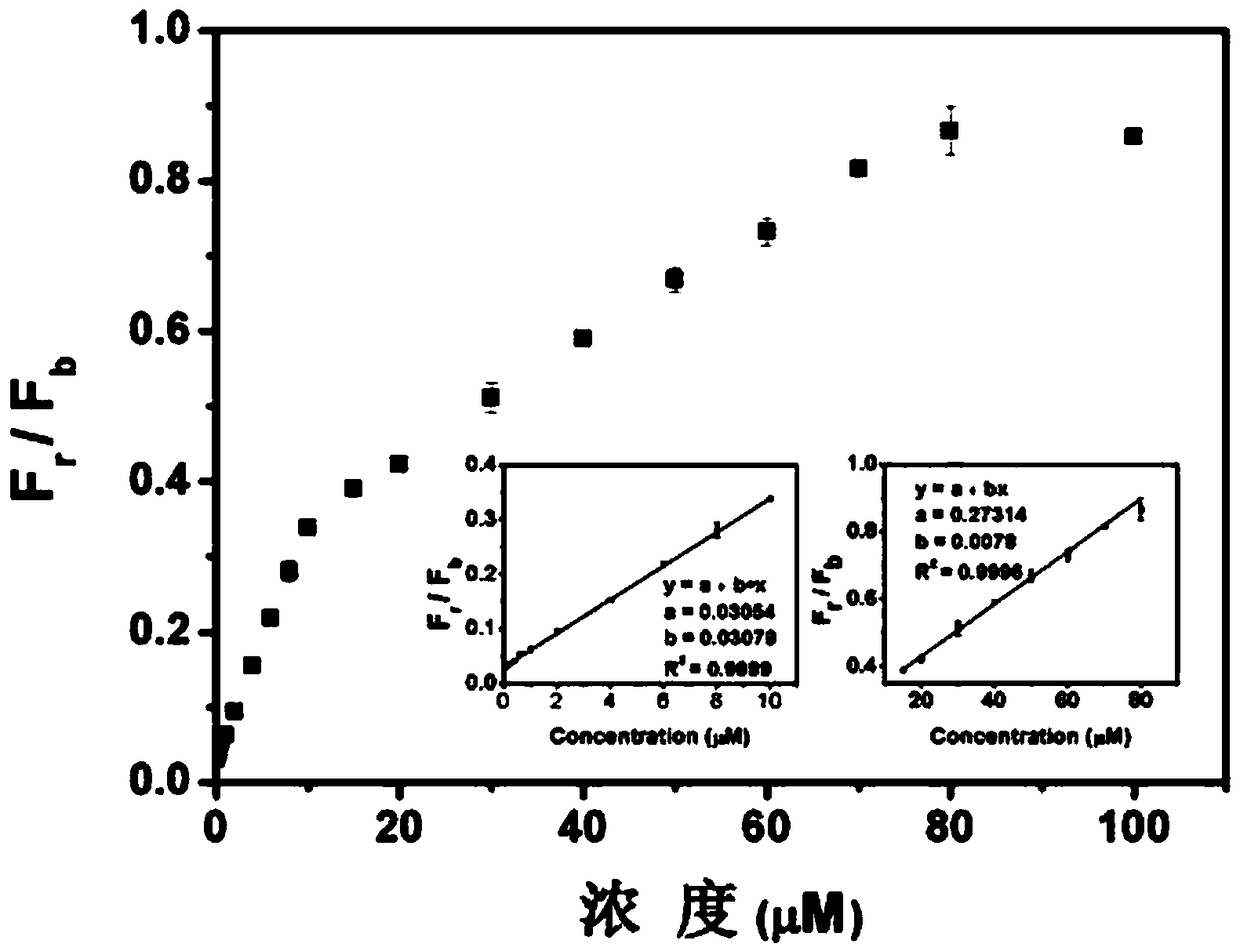
Visual ratio fluorescent system for detecting cyanide ion, and preparation method and application of system
A technology of ratio fluorescence and cyanide ion, which is applied in the field of fluorescence chemical detection, can solve the problem of low sensitivity and achieve the effect of simple and cheap preparation
- Summary
- Abstract
- Description
- Claims
- Application Information
AI Technical Summary
Problems solved by technology
Method used
Image
Examples
Embodiment 1
[0032] To prepare a visual ratiometric fluorescence system for detecting cyanide ions, the steps are as follows:
[0033] 1) Preparation of NAC-modified CdTe quantum dots
[0034] First, add 0.004 mol / L CdCl to 100mL 2 Nitrogen was passed through the aqueous solution for 10 minutes, then 0.1371g NAC (Chinese name: N-acetyl-L-cysteine) was added to it, the pH of the mixed solution was adjusted to 11.0 with 1 mol / L NaOH solution, and then 0.2152 g trisodium citrate dihydrate, 0.0177 g Na 2 TeO 3 , 0.08 g NaBH 4 . Reflux reaction at 100°C for 11 h to obtain a red fluorescent NAC-modified CdTe quantum dot solution. Take 1mL of the prepared NAC-modified CdTe quantum dot solution and mix it with 2mL of ethanol, centrifuge and precipitate, take out the precipitate and disperse it in 1mL phosphate buffer (pH value 8), make a CdTe quantum dot solution and put it in the refrigerator Store at 4°C until use.
[0035] 2) Preparation of blue fluorescent carbon dots
[0036]Add 25 mL...
Embodiment 2
[0043] Investigate the effect of the pH of the phosphate buffer solution:
[0044] Prepare the phosphate buffer solution with pH 6.0, 6.4, 6.8, 7.0, 7.4, 7.6, 8.0, 8.4 and 8.8 in advance;
[0045] Take 14.1 μL of the CdTe quantum dot solution prepared in step 1) of Example 1, put it into 2.926 mL of the phosphate buffer with different pHs prepared above and shake well, perform fluorescence emission spectrum detection, and test the CdTe quantum dot solution without adding cyanide ions Fluorescence intensity versus pH change curve; then add 30 μL of 1 mmol / L cyanide ion aqueous solution, shake well and wait for 15 minutes to perform fluorescence emission spectrum detection, test the fluorescence intensity versus pH change curve after adding 10 μmol / L cyanide ion to the CdTe quantum dot solution. Thus, the ratio of the fluorescence peak intensity after adding 10 μmol / L cyanide ions to the CdTe quantum dot solution and the fluorescence peak intensity when no cyanide ions are added...
Embodiment 3
[0049] Examine the effect of quenching time:
[0050] Take 14.1 μL of the CdTe quantum dot solution obtained in step 1) of Example 1 and put it into 2.926 mL of phosphate buffer (pH value is 8), perform fluorescence emission spectrum detection, and test the fluorescence of the CdTe quantum dot solution without adding copper ions Peak intensity; then add 28.2μL of 0.1mol / L copper ion aqueous solution and shake well, and wait for 2, 4, 6, 8, 10, 20, 40, 60 minutes to measure the fluorescence emission spectrum (waiting time after adding copper ions The time is the quenching time), and the curve of the fluorescence peak intensity after adding copper ions to the CdTe quantum dot solution with the quenching time was tested. Take the quenching time as the abscissa, and the ratio of the fluorescence peak intensity of the corresponding CdTe quantum dot solution after adding copper ions to the fluorescence peak intensity when no copper ions are added is plotted on the ordinate, and the ...
PUM
 Abstract
Description
Claims
Application Information
 - R&D
- Intellectual Property
- Life Sciences
- Materials
- Tech Scout
- Unparalleled Data Quality
- Higher Quality Content
- 60% Fewer Hallucinations
Browse by: Latest US Patents, China's latest patents, Technical Efficacy Thesaurus, Application Domain, Technology Topic, Popular Technical Reports.
© 2025 PatSnap. All rights reserved.Legal|Privacy policy|Modern Slavery Act Transparency Statement|Sitemap|About US| Contact US: help@patsnap.com


