Differential expression profiling analysis of cell culture phenotypes and uses thereof
- Summary
- Abstract
- Description
- Claims
- Application Information
AI Technical Summary
Benefits of technology
Problems solved by technology
Method used
Image

Examples
example 1
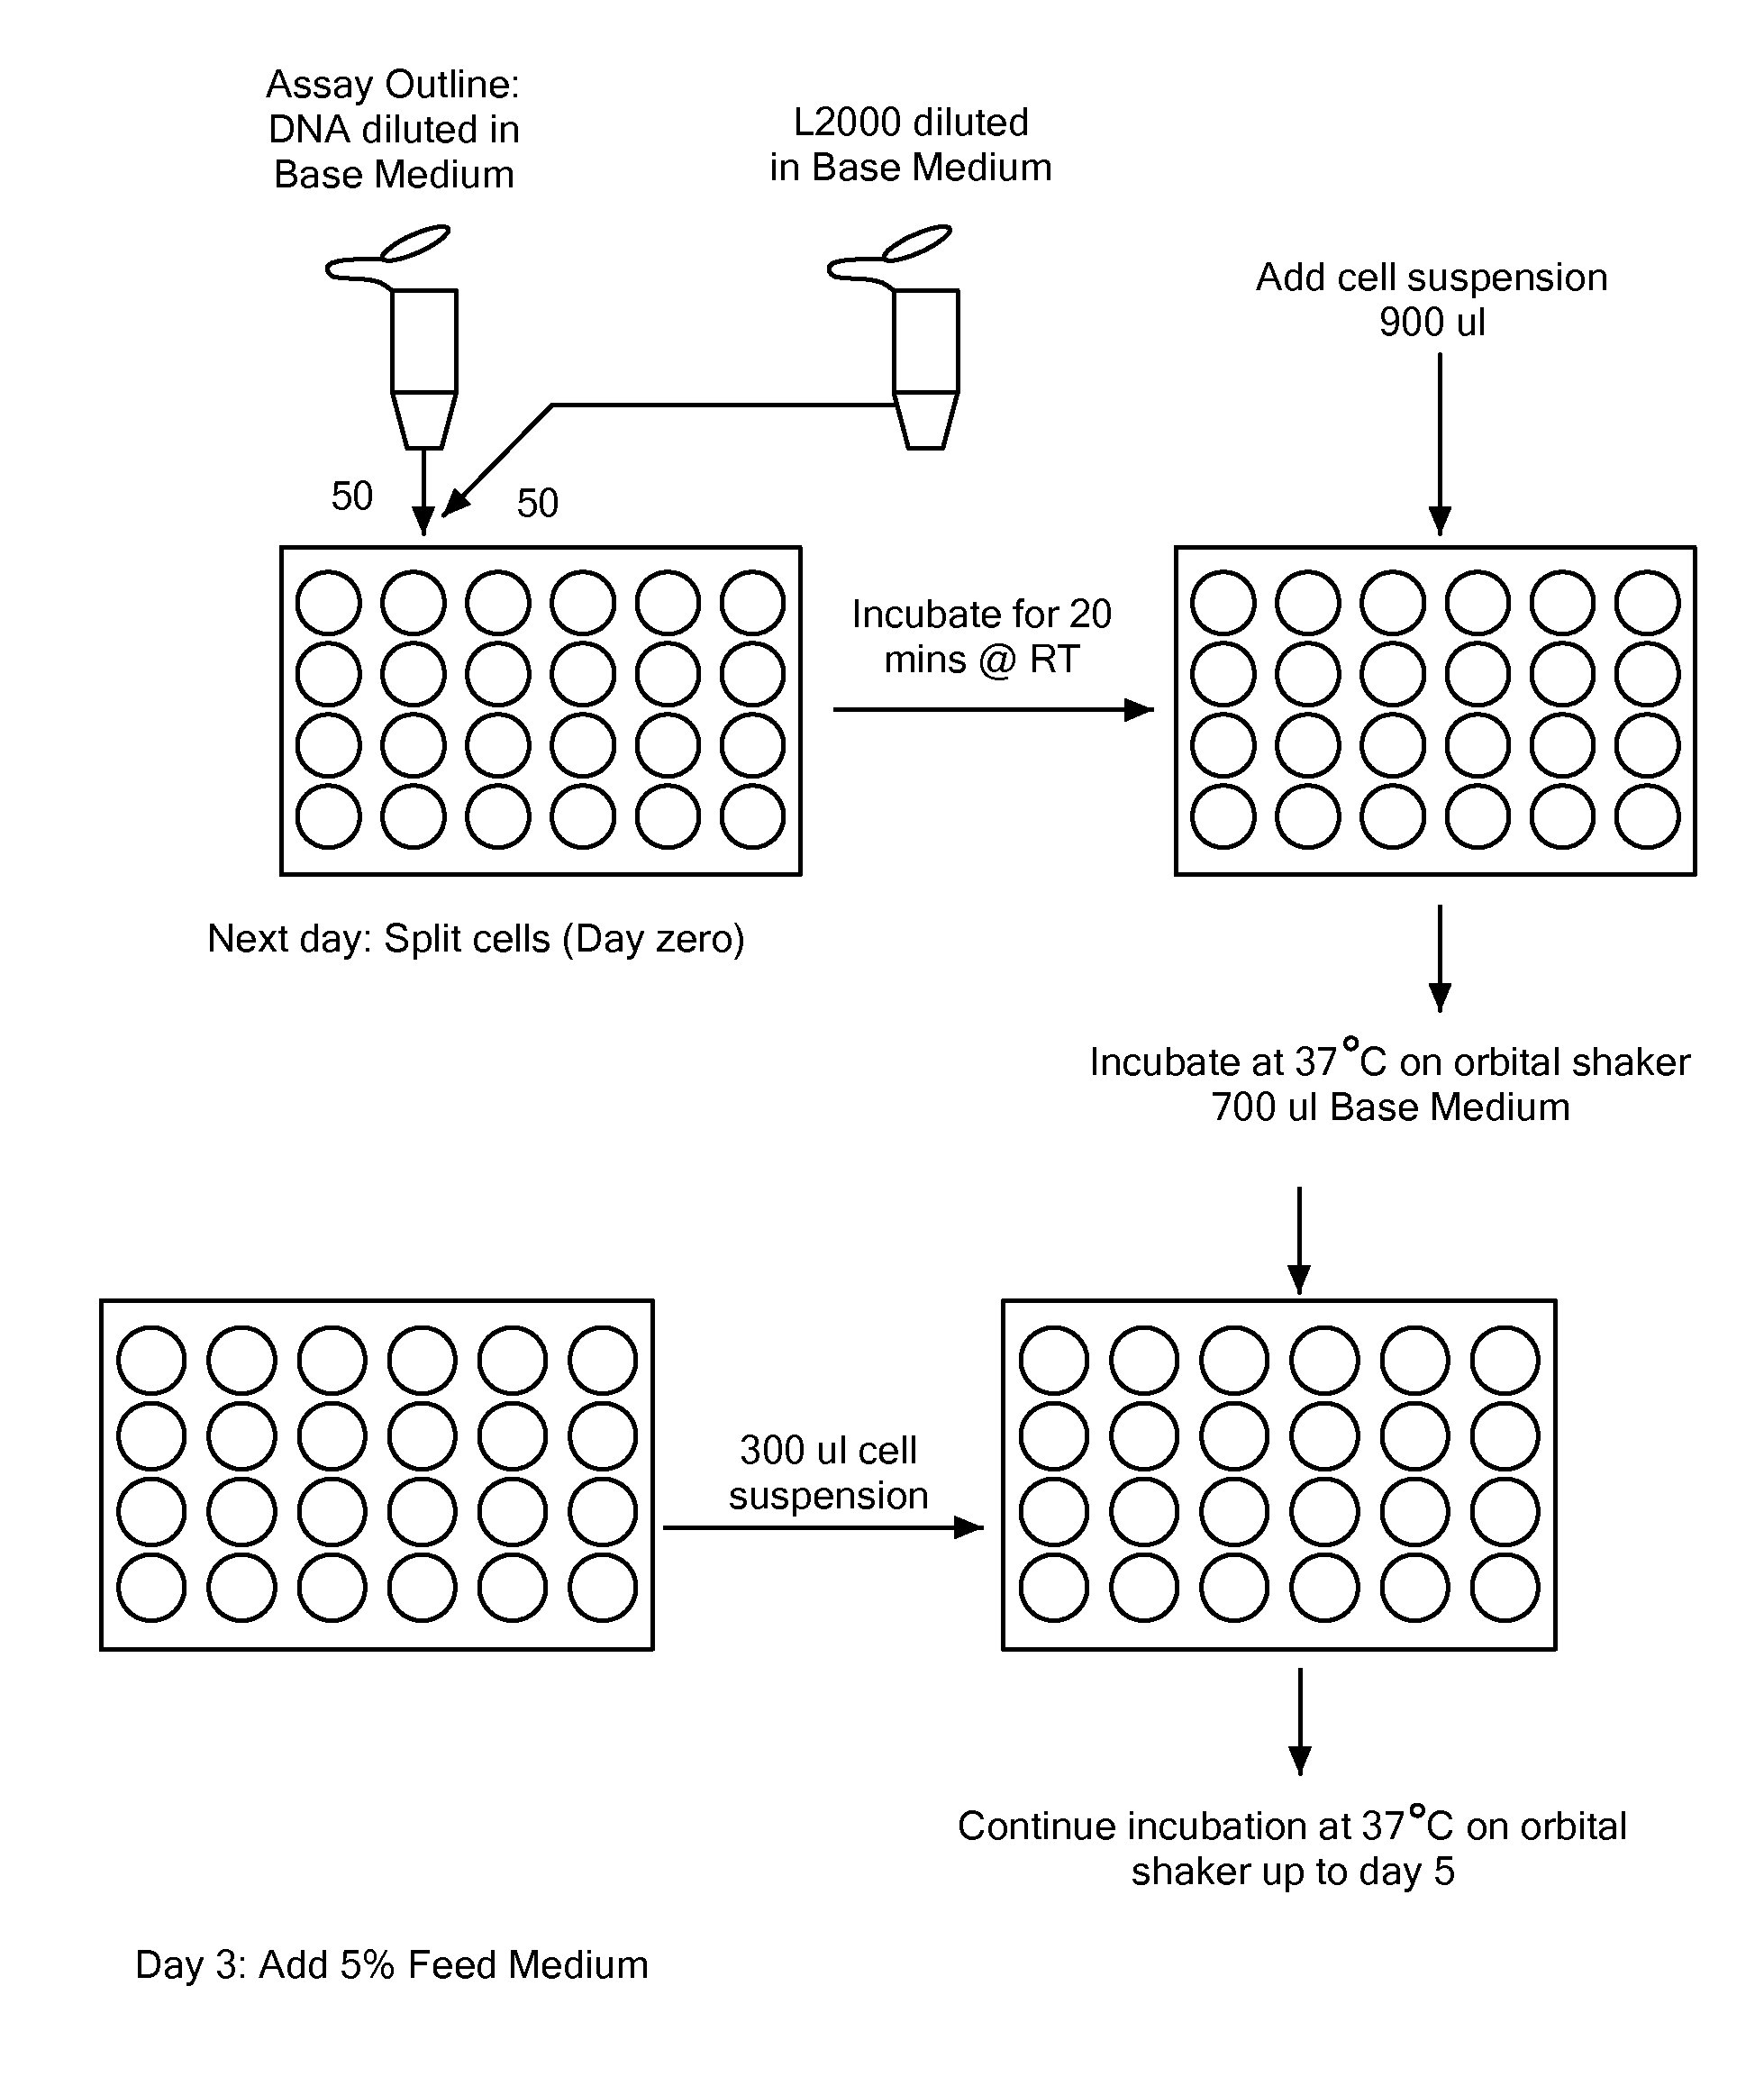
Cell Culture and Time Course Analysis
[0123]Cells were cultured in serum-free suspension culture in two basic formats, under two basic conditions. One format was small scale, shake flask culture in which cells were cultured in less than 100 ml in a vented tissue culture flask, rotated on an orbiting shaker in a CO2 incubator. The second format was in bench top bioreactors, 2 L or less working volume, controlled for pH, nutrients, dissolved oxygen, and temperature. The two basic culture conditions were ordinary passage conditions of 37° C., or fed batch culture conditions. In a basic fed batch culture, the cells are grown for a longer period of time, and shifted to a lower temperature in order to prolong cell viability and extend the productive phase of the culture. For example, in the fed batch culture, cells were grown through an initial phase of exponential growth. After several days, the culture temperature was lowered, nutrient feeds were added to supplement growth, and the cells...
example 2
Detection of Differentially Expressed Proteins
[0125]Cells from each sample were harvested and subjected to standard lysis in 7 M urea, 2 M thiourea, 4% CHAPS, 30 mM Tris, 5 mM magnesium acetate at pH 8.5. 150 μg aliquots of the lysates were analyzed by two-dimensional gel electrophoresis to confirm sample quality using 18 cm immobilized pH gradient isoelectric focusing gradient strips, pH 4-7. The strips were rehydrated overnight with 340 μl of buffer per strip. Samples were loaded at the cathodic end of the strip and subjected to 500 V for 1 hour, 1000 V for 1 hour, and 8000 V for 4 hours and stored at −80° C. until the second dimension on 12.5% acrylamide gels. Electrophoresis in the second dimension was performed at 1.5 W per gel for 30 minutes and then a total of 100 W for 5 hours for a Dalt 6 run of 6 large format gels. Proteins were visualized by silver staining to confirm the quality of the proteins in the lysate.
[0126]Aliquots of the original lysates were then labeled with f...
example 3
Identification of Differentially Expressed Proteins
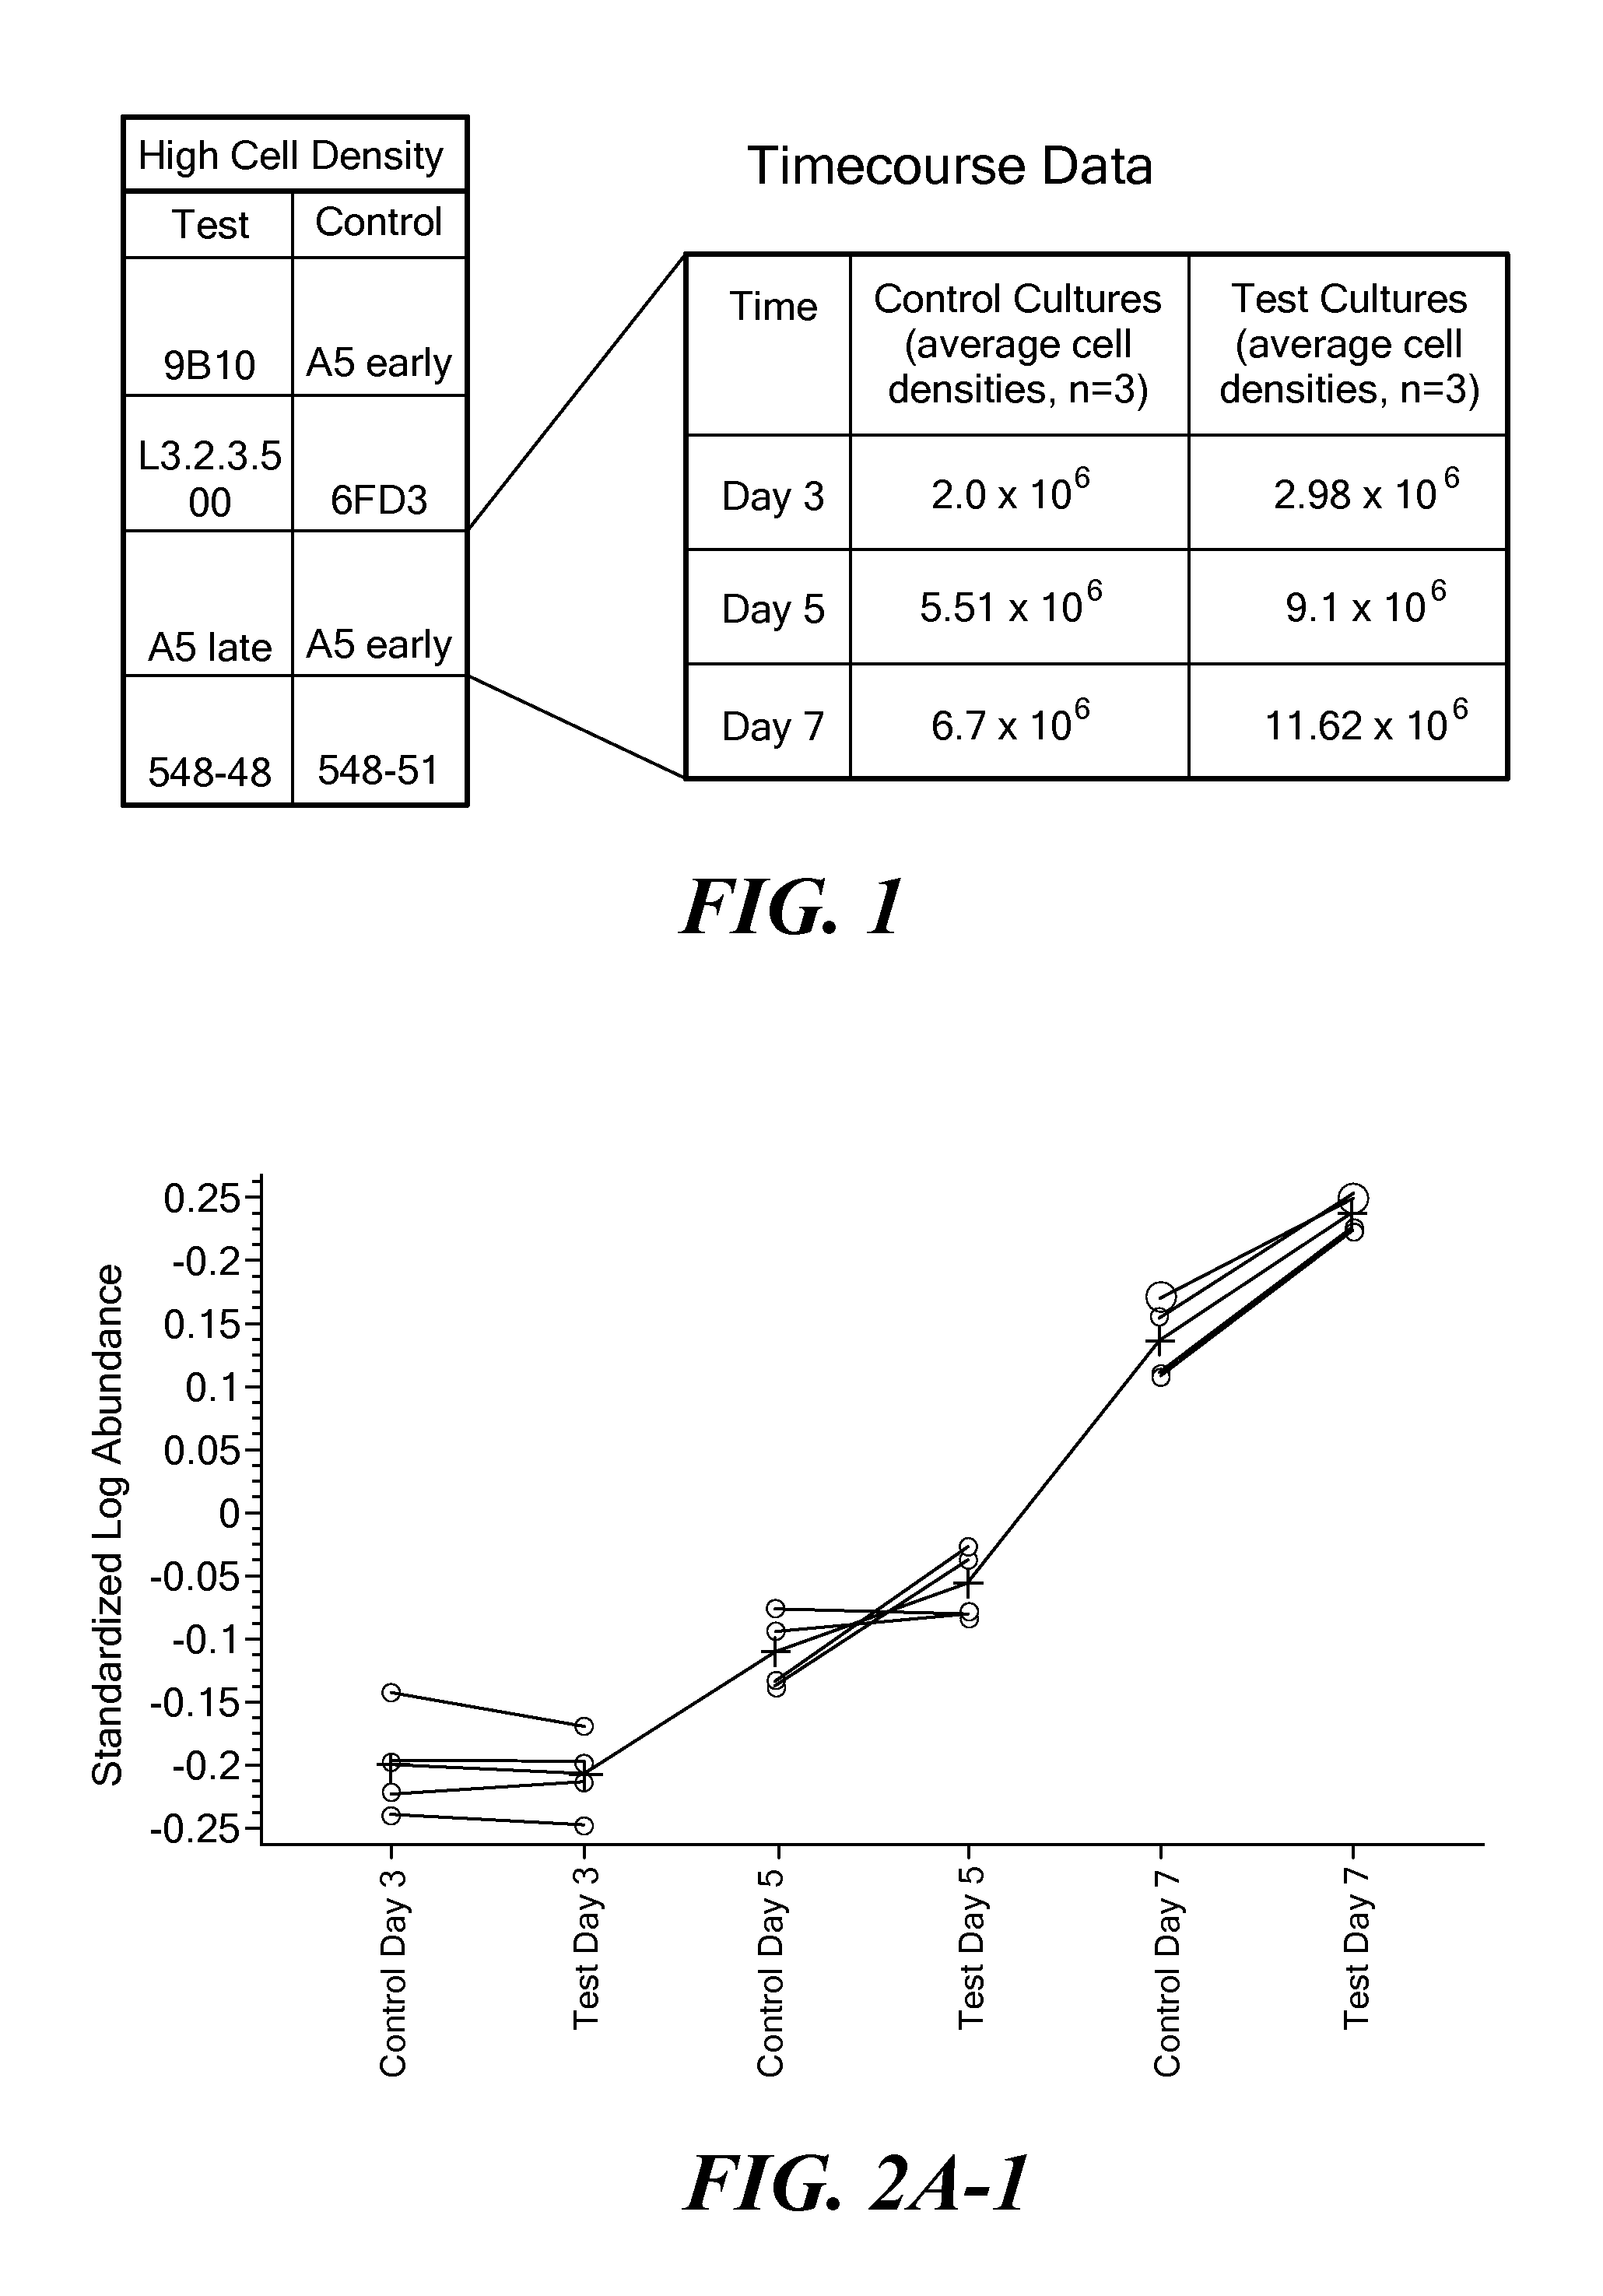
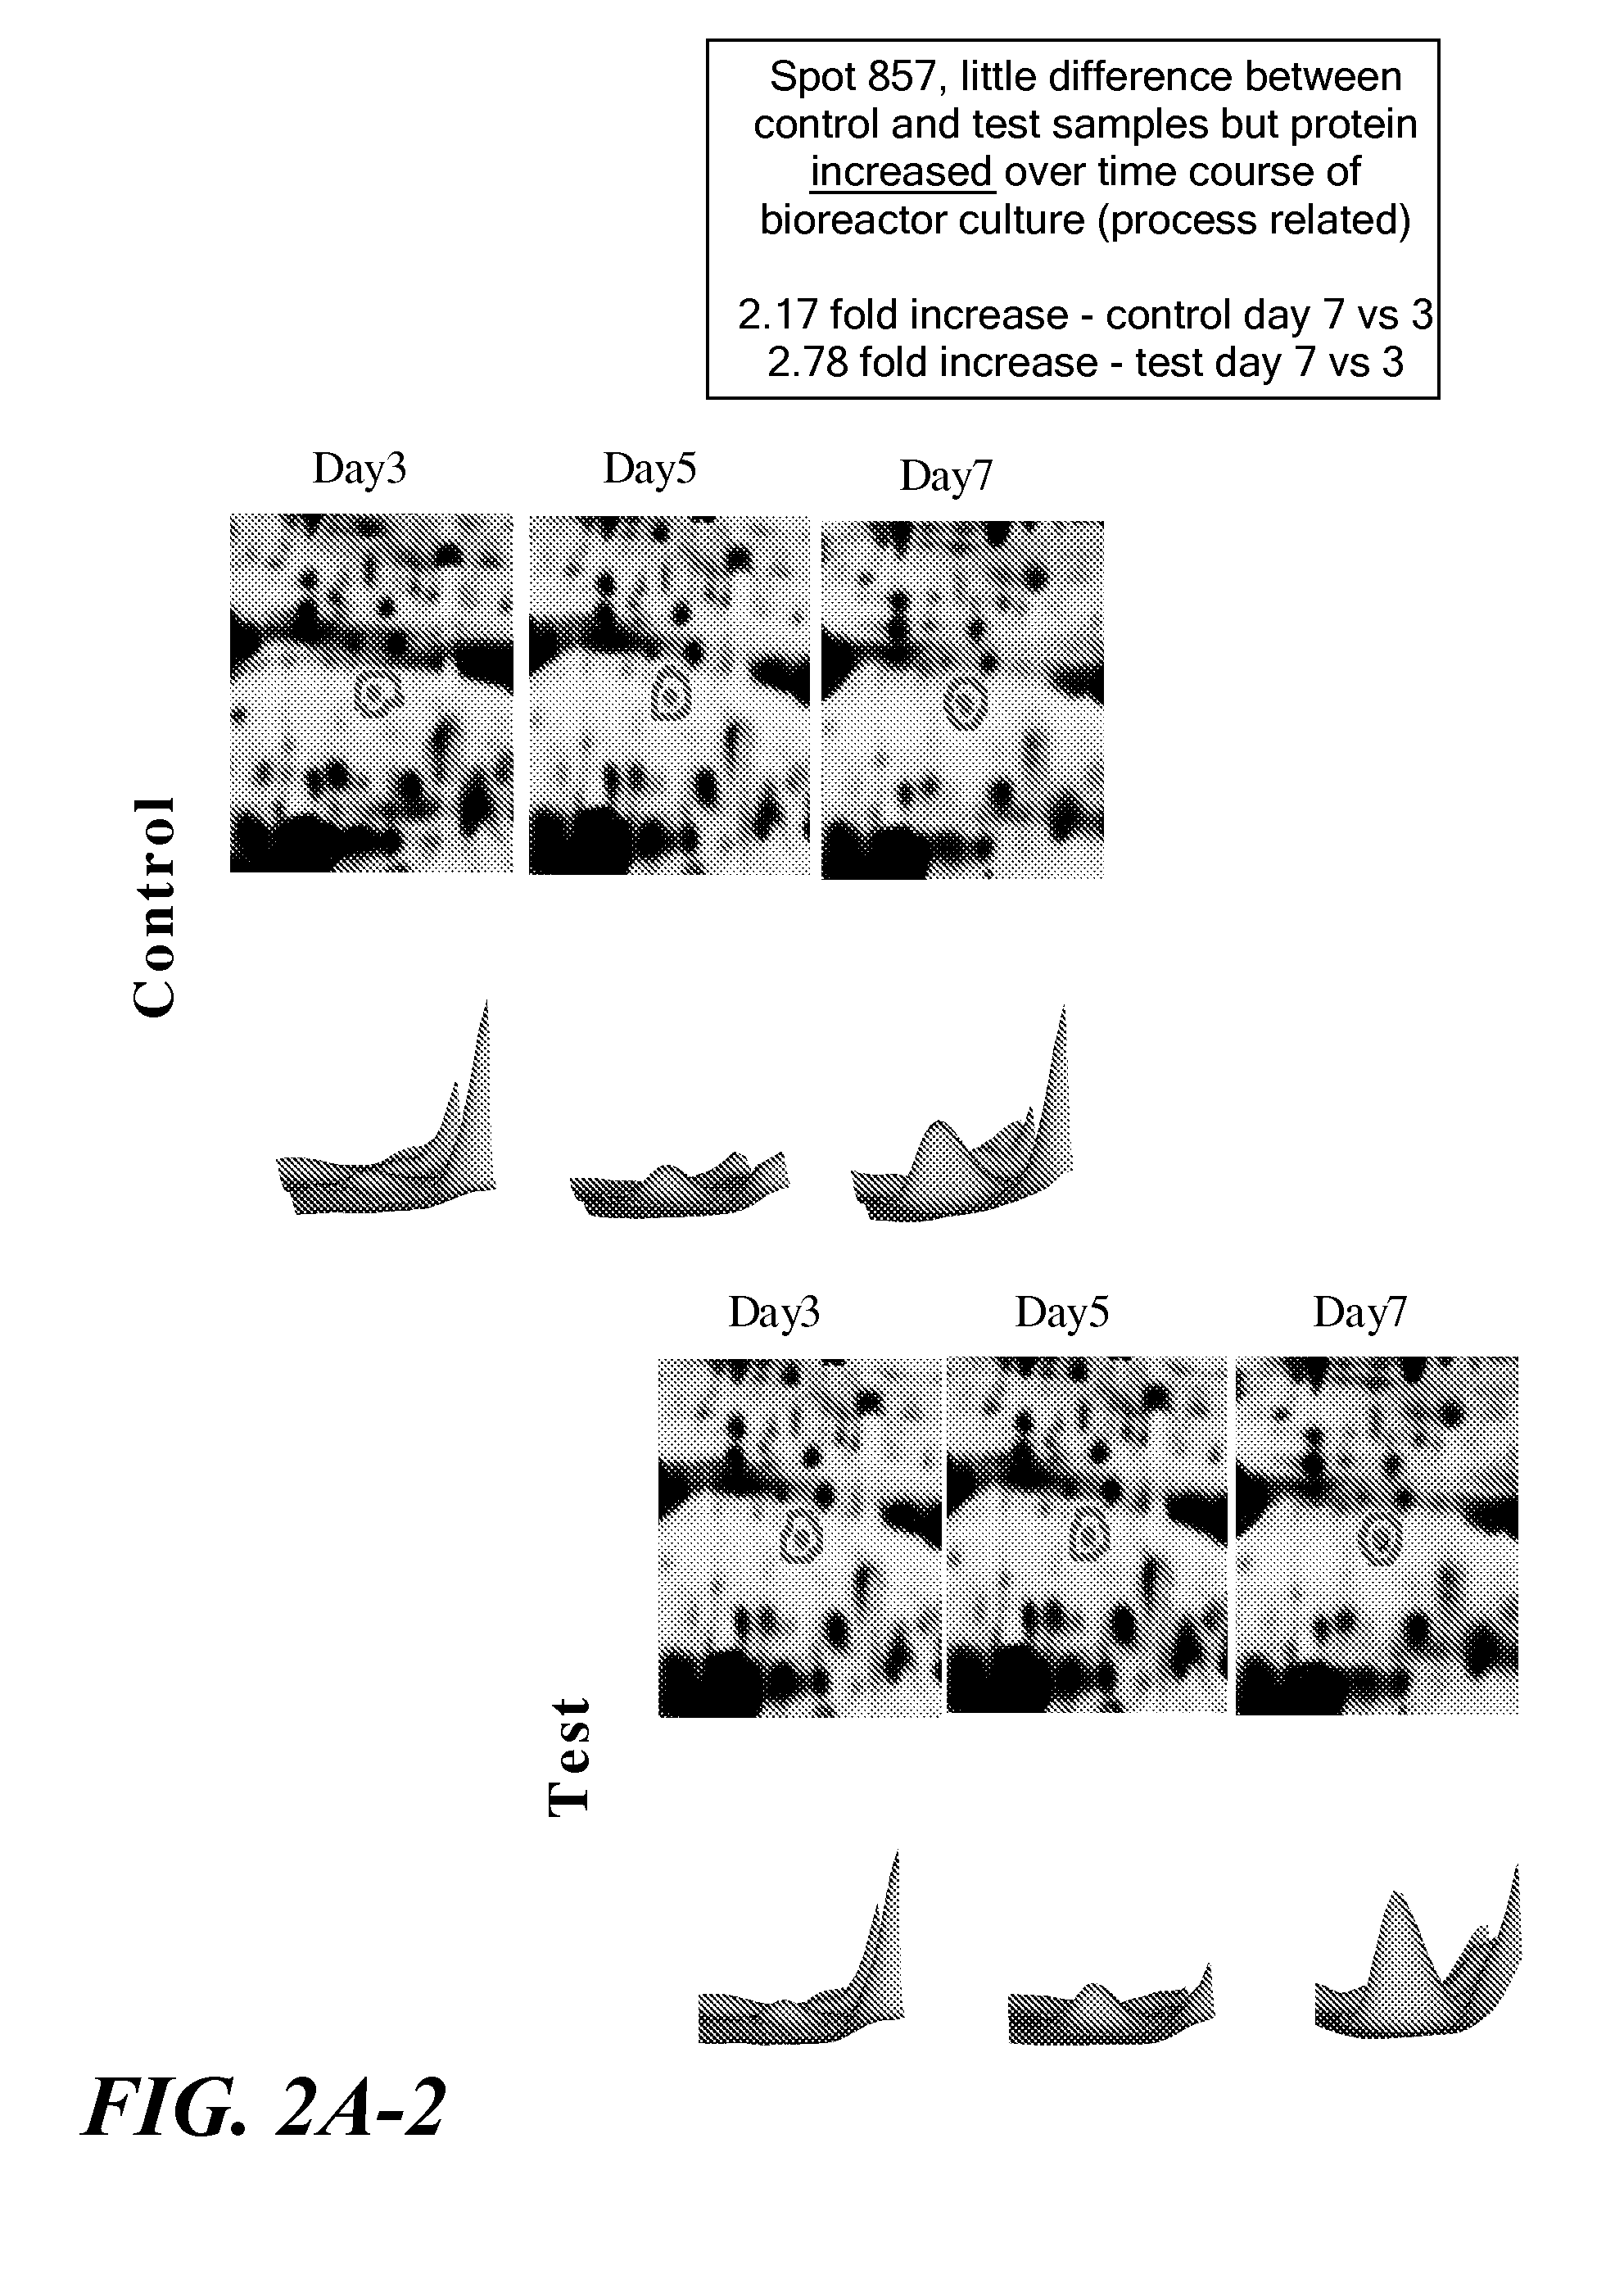
[0130]The protein expression profiles of replicate samples of the test cell line taken at one time point were compared to the protein expression profiles of replicate samples of the same cell line but taken at a different time point to identify differentially expressed proteins over time (ANOVA analysis). Preferably, samples were taken from distinct growth phases. For example, expression profiles of samples taken from an exponential phase were compared to the expression profiles of samples taken from a lag phase. To be considered as a differentially-expressed protein at in the DeCyder analysis, a protein must have been identified in all sample gels; have demonstrated at least a 1.5-fold up- or down-regulation; and have demonstrated a T-test score less than 0.05. The same analysis was done with the control cell line. In this experiment, the test cell line maintains a high viability throughout the fed batch, while the control cell lin...
PUM
| Property | Measurement | Unit |
|---|---|---|
| Time | aaaaa | aaaaa |
| Density | aaaaa | aaaaa |
| Gene expression profile | aaaaa | aaaaa |
Abstract
Description
Claims
Application Information