
Methods for using co-regulated genesets to enhance detection and classification of gene expression patterns

a gene expression and co-regulated technology, applied in the field of enhanced detection of biological responses to perturbations, can solve the problems of high rate of measurement error, high complexity of cell profile, and difficulty in analyzing biological response data, so as to reduce the dimension of data set, and reduce the risk of data loss

Inactive Publication Date: 2009-08-13
MICROSOFT TECH LICENSING LLC
View PDF23 Cites 33 Cited by
  • Summary
  • Abstract
  • Description
  • Claims
  • Application Information

AI Technical Summary

Benefits of technology

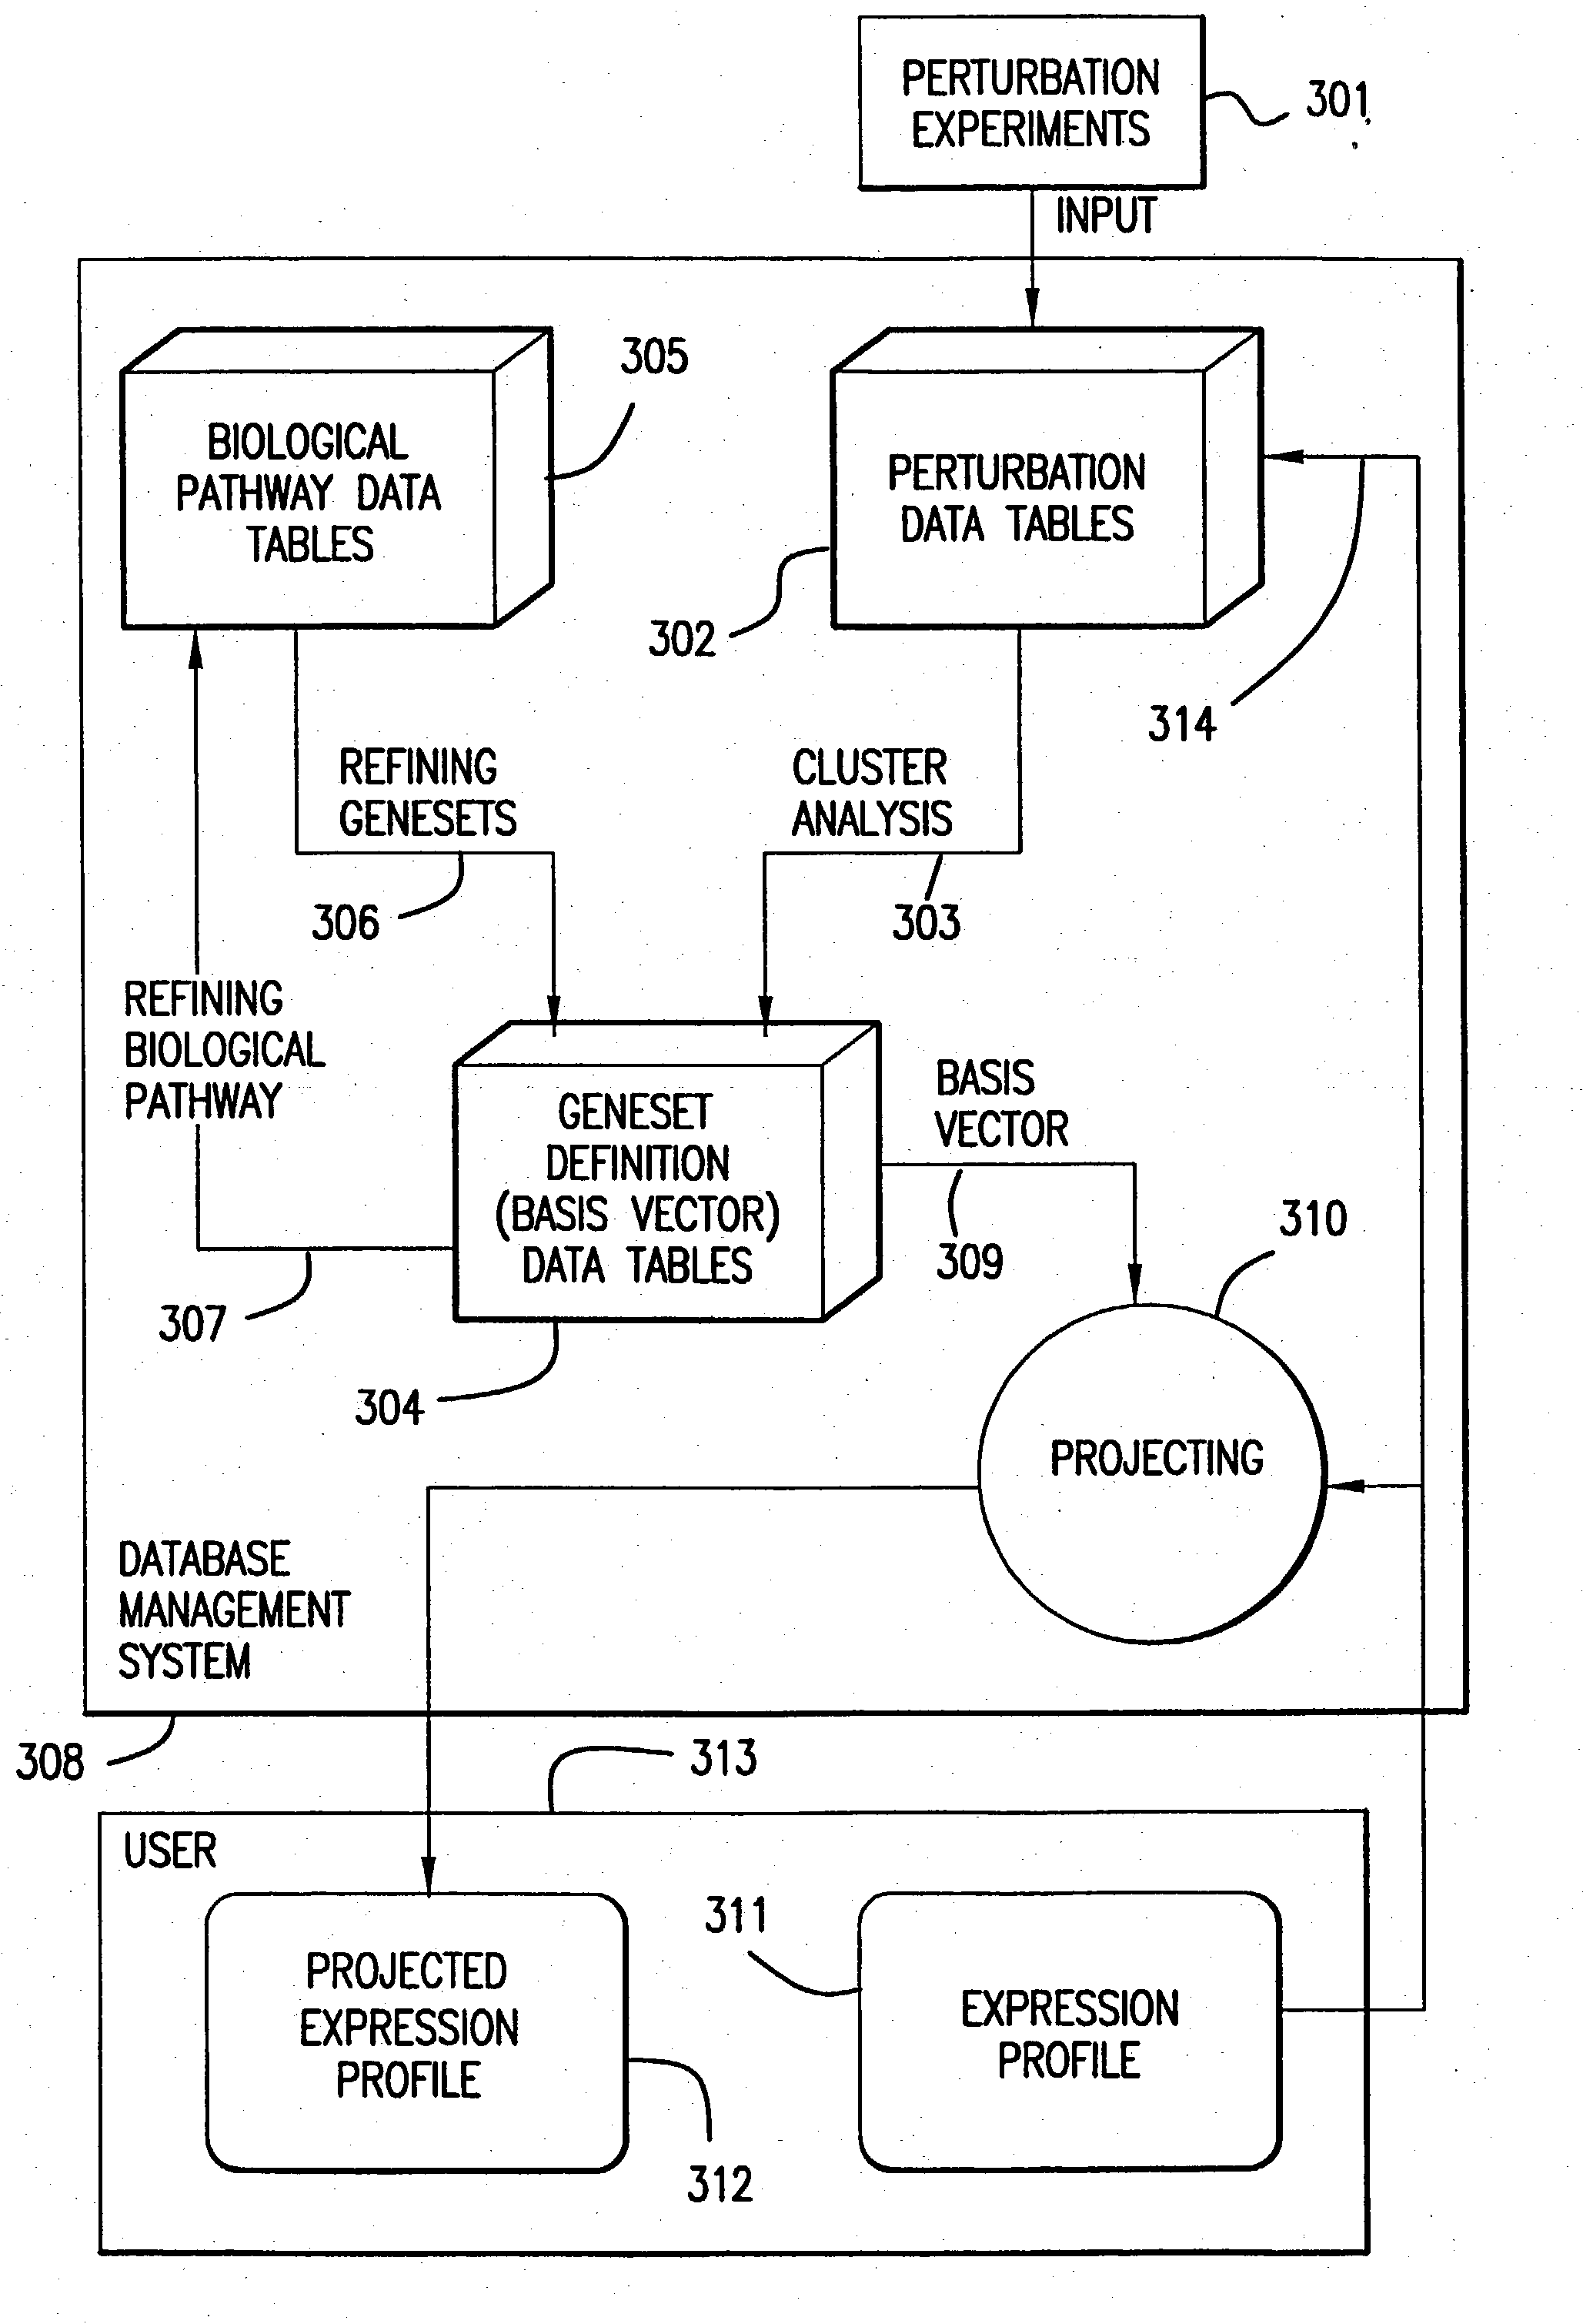
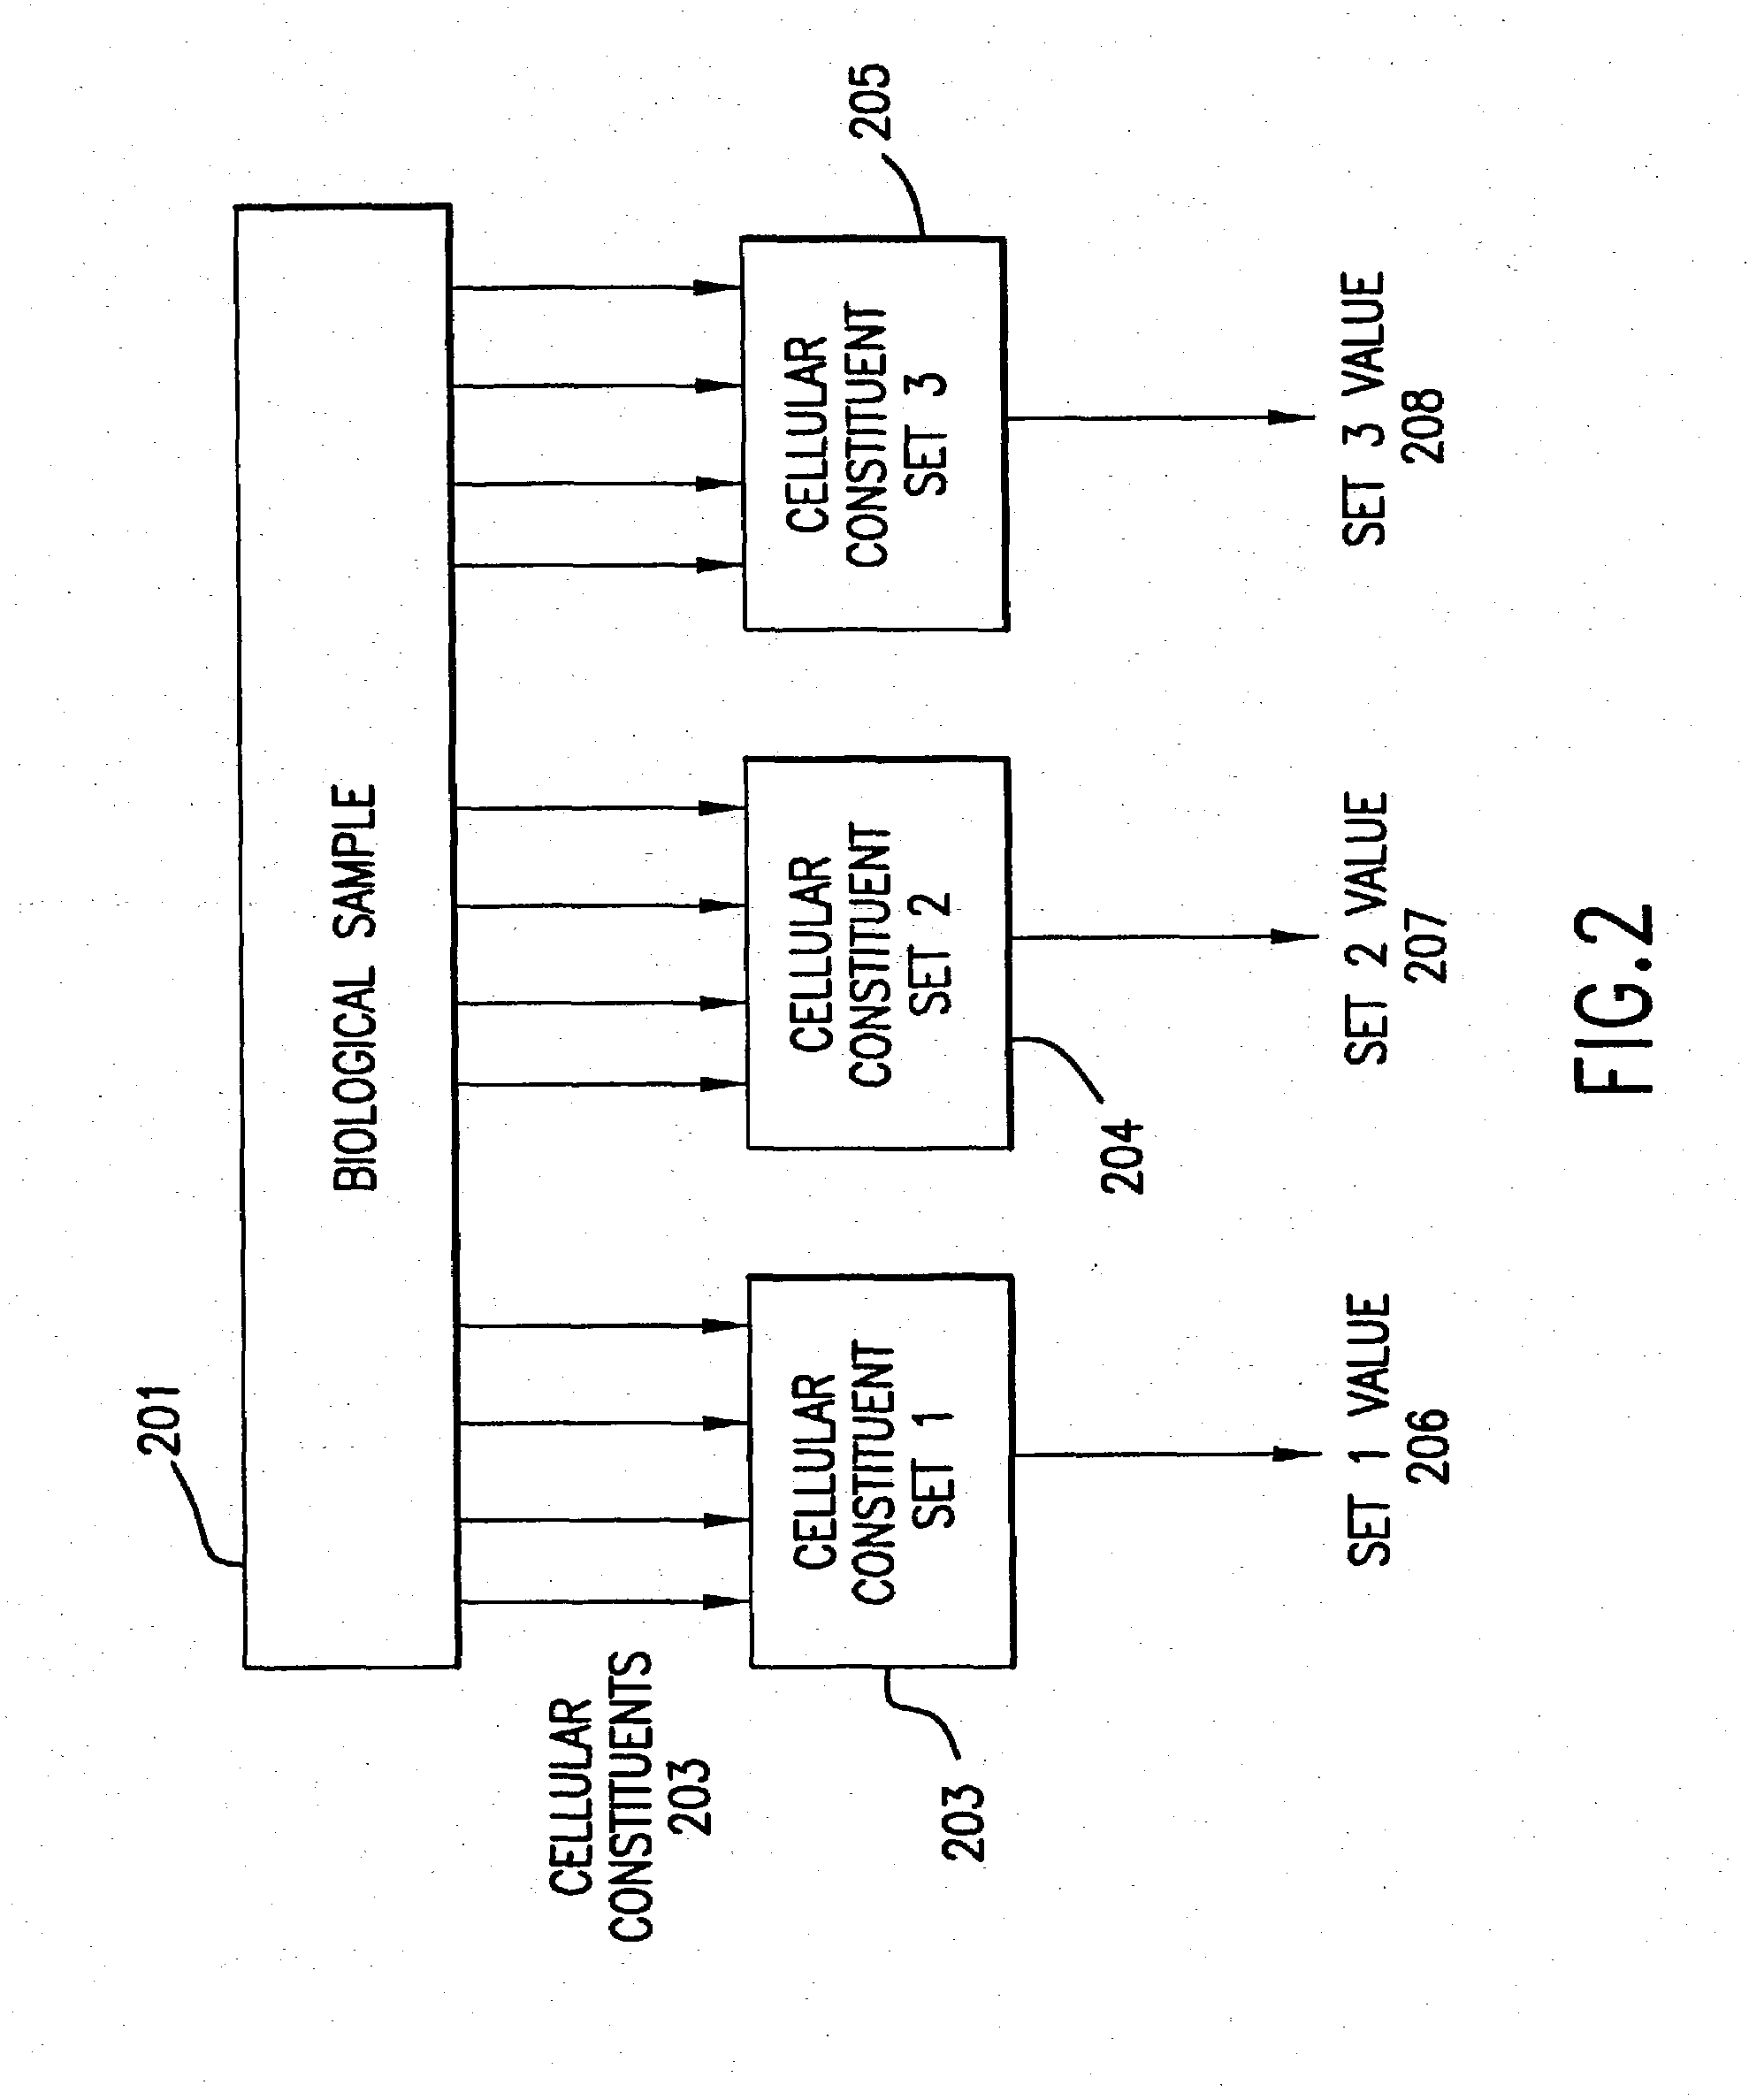
[0118]One advantage of using projected profiles is that projected profiles are less vulnerable to measurement errors. Assuming independent measurement errors in the data for each cellular constituent, the fractional standard error in the projected profile element is approximately Mn−1/2 times the average fractional standard error for the individual cellular constituents, where Mn is the number of cellular constituents in the n'th geneset. Thus if the average up or down-regulation of the cellular constituents is significant at x standard deviations, then the projected profile element will be signi

Problems solved by technology

The profile of a particular cell is therefore typically of high complexity.
The complexity of the biological response data coupled with measurement errors makes such an analysis of biological response data a challenging task.
Current techniques for quantifying profile changes suffer from high rates of measurement error such as false detection, failures to detect, or inaccurate quantitative determinations.

Method used


Image

  • Methods for using co-regulated genesets to enhance detection and classification of gene expression patterns
  • Methods for using co-regulated genesets to enhance detection and classification of gene expression patterns
  • Methods for using co-regulated genesets to enhance detection and classification of gene expression patterns

Examples


example 1

6.1. Example 1

Clustering Genesets by Coregulation

[0268]This example illustrates one embodiment of the clustering method of the invention.

6.1.1. Materials and Methods

Transcript Measurement:

[0269]Yeast (Saccharomyces cerevisiae, Strain YPH499, see, Sikorski and Hieter, 1989, A system of shuttle vectors and yeast host strains designated for efficient manipulation of DNA in Saccharomyces cerevisiae, Genetics 122:19-27) cells were grown in YAPD at 30° C. to an OD600 of 1.0 (±0.2), and total RNA prepared by breaking cells in phenol / chloroform and 0.1% SDS by standard procedures (Ausubel et al., 1995, Current Protocols in Molecular Biology, Greene Publishing and Wiley-Interscience, New York, Ch. 13). Poly(A)+ RNA was selected by affinity chromatography on oligo-dT cellulose (New England Biolabs) essentially as described in Sambrook et al. (Molecular Cloning—A Laboratory Manual (2nd Ed.), Vol. 1, Cold Spring Harbor Laboratory, Cold Spring Harbor, N.Y., 1989). First strand cDNA synthesis was...

example 2

6.2. Example 2

Enhancing Detection of Response Pattern Using Geneset Average Response

[0275]This example illustrates enhanced detection of a particular response pattern by geneset averaging.

[0276]Geneset number 3 in the clustering analysis result of FIG. 6 involves genes regulated by the Gcn4 transcription factor. This was verified via the literature and via multiple sequence alignment analysis of the regulatory regions 5′ to the individual genes (Stormo and Hartzell, 1989, Identifying protein binding sites from unaligned DNA fragments, Proc Natl Acad Sci 86:1183-1187; Hertz and Stormo, 1995, Identification of consensus patterns in unaligned DNA and protein sequences: a large-deviation statistical basis for penalizing gaps, Proc of 3rd Intl Conf on Bioinformatics and Genome Research, Lim and Cantor, eds., World Scientific Publishing Co., Ltd. Singapore, pp. 201-216). Twenty of 32 genes in geneset 3 had a common promoter sequence appropriate to Gcn4. These 20 were used to define a gene...

example 3

6.3. Example 3

Improved Classification of Drug Activity

[0277]The 18-experiment data set mentioned in Example 1, supra, was combined with an additional 16 experiments using a variety of perturbations including immunosuppressive drugs FK506 and Cyclosporin A, and mutations in genes relevant to the activity of those drugs; and drugs unrelated to immunosuppression—hydroxyurea, 3-Aminotriazole, and methotrexate. The experimental conditions are listed in Table 3:

TABLE 3Additional 16 ExperimentsExperiment No.Experimental conditions / Perturbations13-Aminotriazole (0.01 mM)23-Aminotriazole (1 mM)33-Aminotriazole (10 mM)43-Aminotriazole (100 mM)5Hydroxyurea (1.6 mM)6Hydroxyurea (3.1 mM)7Hydroxyurea (6.2 mM)8Hydroxyurea (12.5 mM)9Hydroxyurea (25 mM)10Hydroxyurea (50 mM)11Methotrexate (3.1 μM)12Methotrexate (6 μM)13Methotrexate (25 μM)14Methotrexate (50 μM)15Methotrexate (100 μM)16Methotrexate (200 μM)

[0278]A cluster analysis was performed with the combined data set. A first down selection of gen...


PUM

PropertyMeasurementUnit
Molar densityaaaaaaaaaa

Abstract

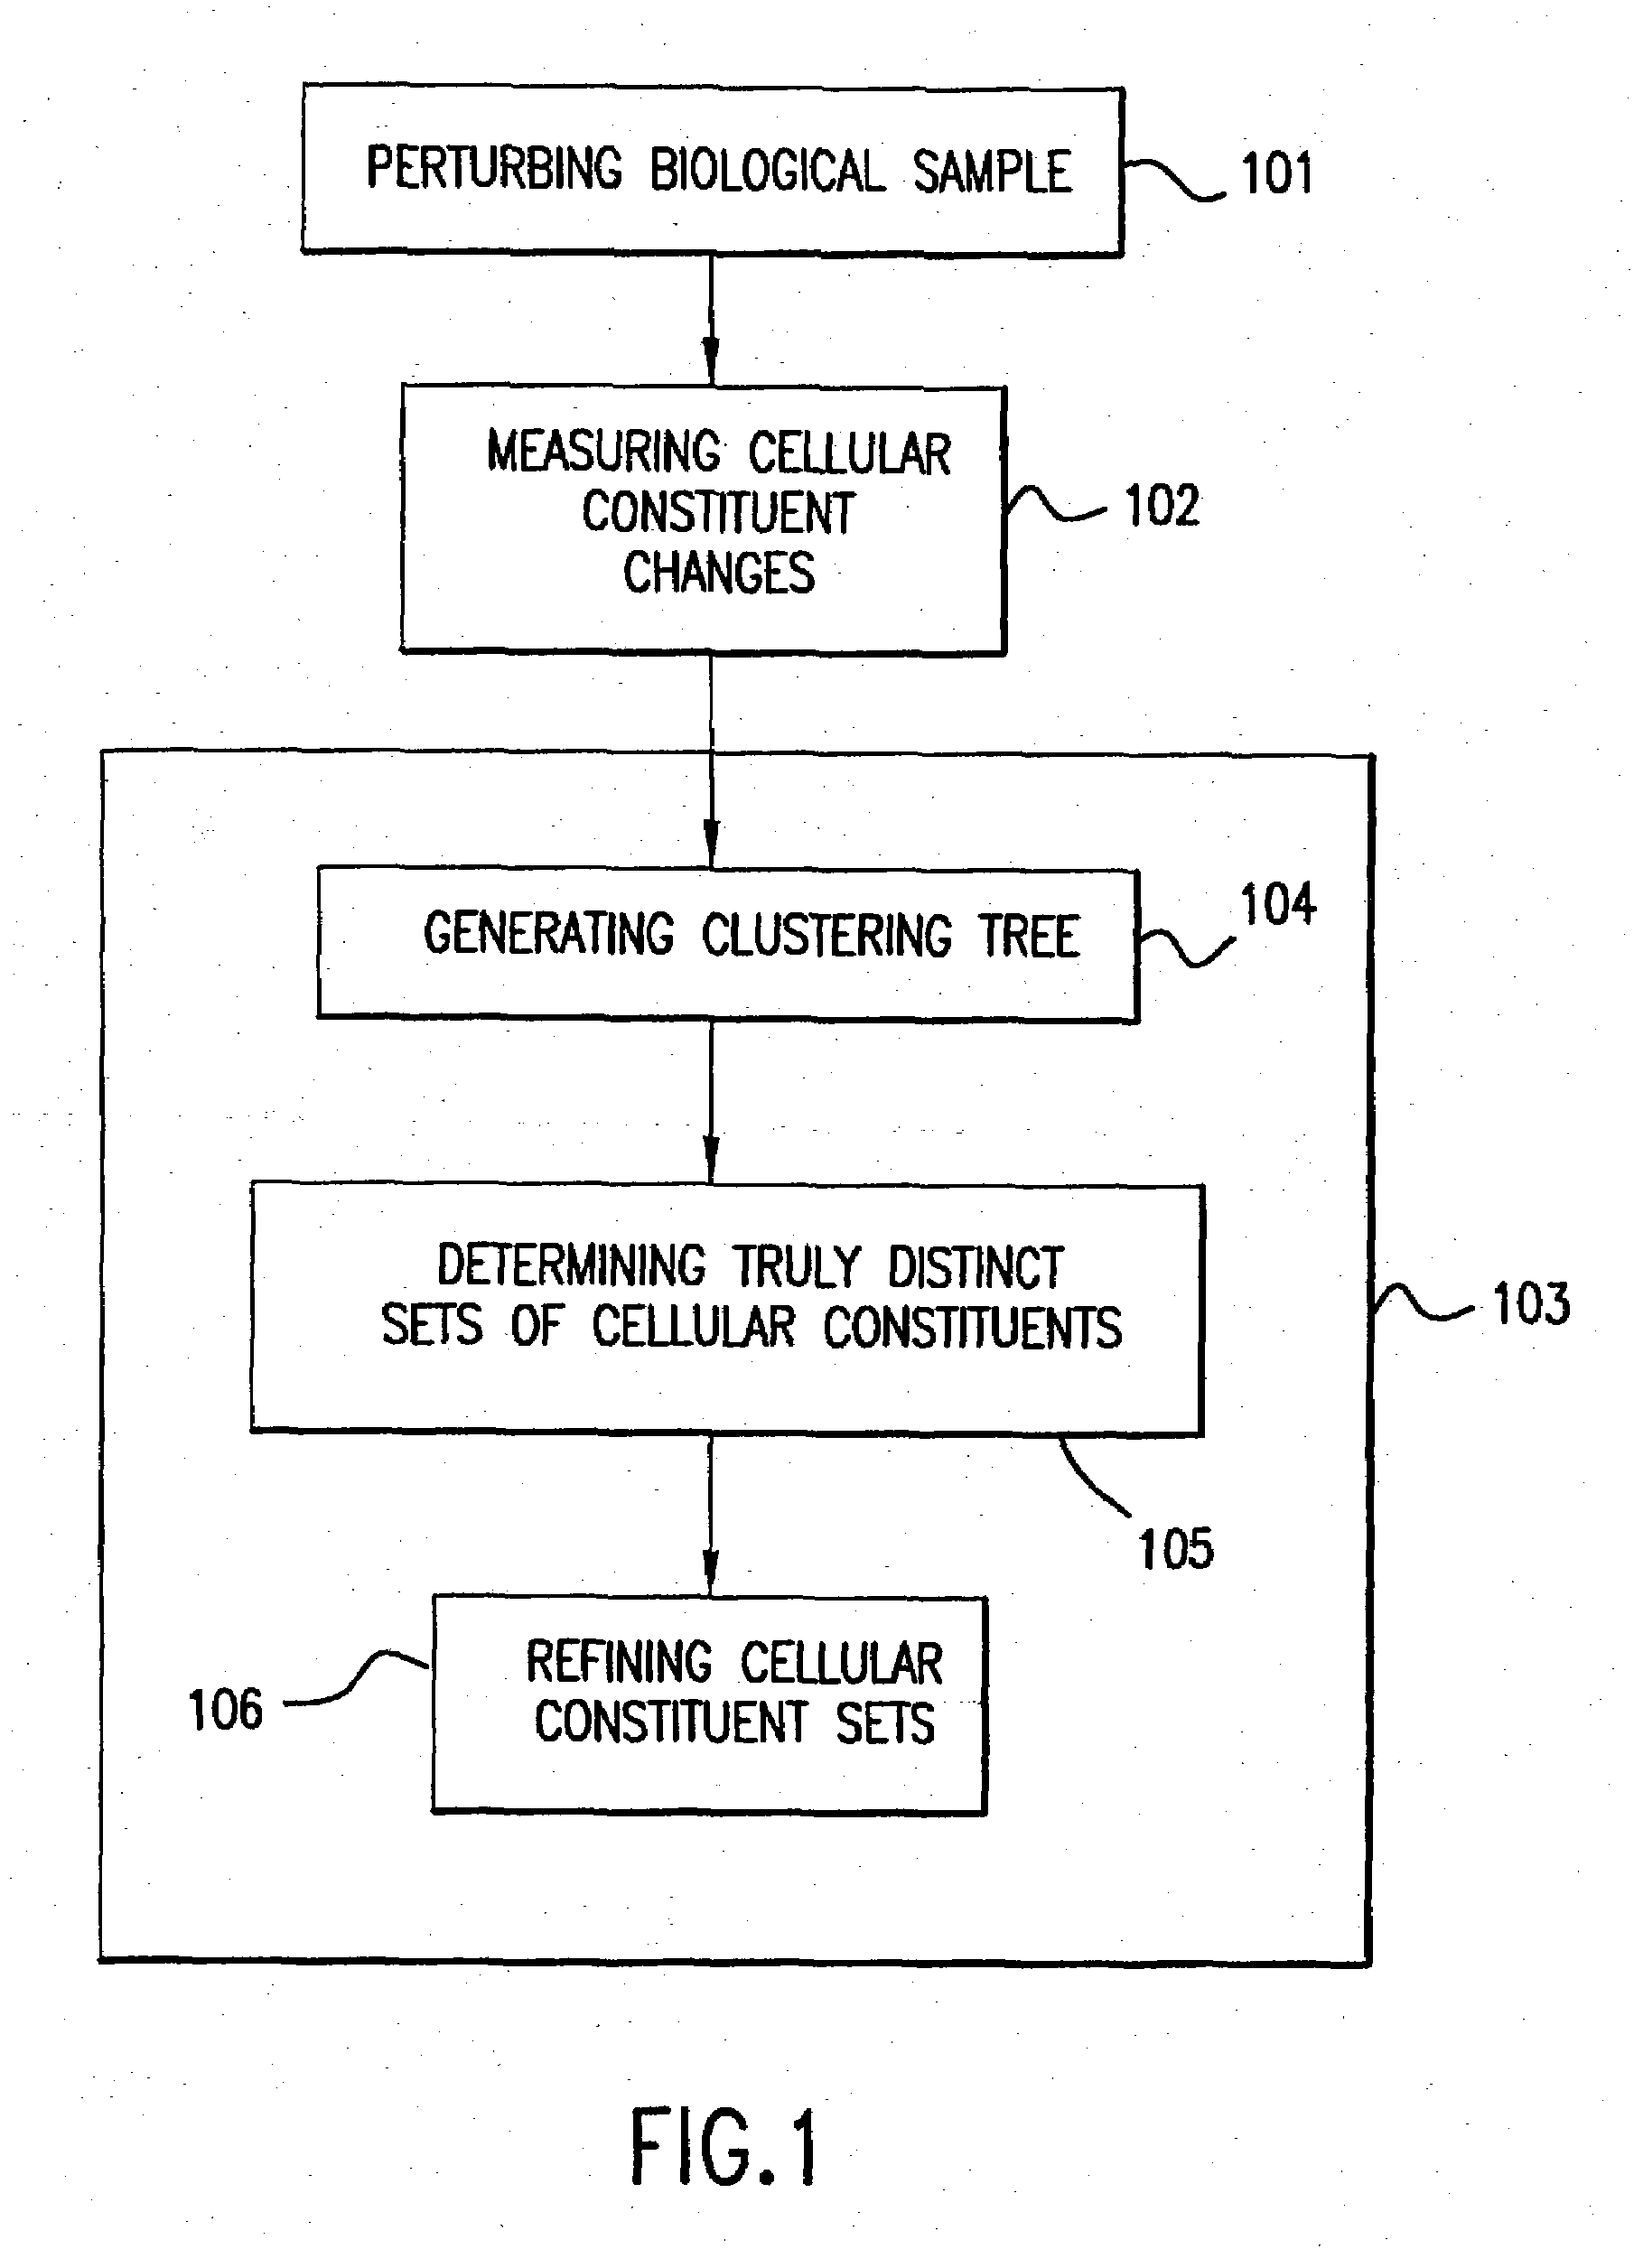
The present invention provides methods for enhanced detection of biological response patterns. In one embodiment of the invention, genes are grouped into basis genesets according to the co-regulation of their expression. Expression of individual genes within a geneset is indicated with a single gene expression value for the geneset by a projection process. The expression values of genesets, rather than the expression of individual genes, are then used as the basis for comparison and detection of biological response with greatly enhanced sensitivity. In another embodiment of the invention, biological responses are grouped according to the similarity of their biological profile.The methods of the invention have many useful applications, particularly in the fields of drug development and discovery. For example, the methods of the invention may be used to compare biological responses with greatly enhanced sensitivity. The biological responses that may be compared according to these methods include responses to single perturbations, such as a biological response to a mutation or temperature change, as well as graded perturbations such as titration with a particular drug. The methods are also useful to identify cellular constituents, particularly genes, associated with a particular type of biological response. Further, the methods may also be used to identify perturbations, such as novel drugs or mutations, which effect one or more particular genesets. The methods may still further be used to remove experimental artifacts in biological response data.

Description

[0001]This is a continuation-in-part of application Ser. No. 09 / 220,275, filed on Dec. 23, 1998, which is a continuation-in-part of application Ser. No. 09 / 179,569 filed Oct. 27, 1998, each of which is incorporated herein, by reference, in its entirety.1. FIELD OF THE INVENTION[0002]The field of this invention relates to methods for enhanced detection of biological responses to perturbations. In particular, it relates to methods for analyzing structure in biological expression patterns for the purposes of improving the ability to detect certain specific gene regulations and to classify more accurately the actions of compounds that produce complex patterns of gene regulation in the cell.2. BACKGROUND OF THE INVENTION[0003]Within the past decade, several technologies have made it possible to monitor the expression level of a large number of transcripts at any one time (see, e.g., Schena et al., 1995, Quantitative monitoring of gene expression patterns with a complementary DNA micro-ar...

Claims


Application Information

Patent Timeline
IPC IPC(8): G06F19/00G01N33/50G16B40/00C12M1/00C12N15/09C12P21/04C12Q1/68C40B30/02C40B30/04C40B40/02C40B50/02C40B50/06C40B60/12G01N33/15G01N33/68G06F17/10G06F17/16G06F17/18G06F17/30G16B25/10G16B25/30
CPCC12Q1/6809C12Q1/6834G06F19/24G06F19/20G01N33/6803G16B25/00G16B40/00G16B25/30G16B25/10
Inventor FRIEND, STEPHEN H.STOUGHTON, ROLANDHE, YUDONG
Owner MICROSOFT TECH LICENSING LLC
Learn More