
Prediction of phenotypes and traits based on the metabolome

Active Publication Date: 2012-05-17
PIONEER HI BRED INT INC
View PDF16 Cites 29 Cited by
  • Summary
  • Abstract
  • Description
  • Claims
  • Application Information

AI Technical Summary

Benefits of technology

[0019]e) pre-processing said first set of data and said second set of data to align, reduce noise and dimensionality, and normalize;
[0039]b) reducing noise and dimensionality using statistical analyses, wherein said statistical analyses includes smoothing, noise subtraction or thresholding;
[0070]e) pre-processing said first set of data and said second set of data to align, reduce noise and dimensionality and normalize;
[0090]b) reducing noise and dimensionality using statistical analyses, wherein said statistical analyses includes smoothing, noise subtraction or thresholding;

Problems solved by technology

Although strategies have been developed to reduce the time and expense required for making such assessments, significant time and cost are still necessary to evaluate crops under different stresses, seasons and environmental conditions.
However, a drawback of this approach is that it requires knowledge of the particular gene of interest and does not necessarily produce a reliable prediction of the phenotype of the plant at maturity.
Other techniques, such as RNA or protein screening, suffer from similar drawbacks, in that genes of interest must be known and that the accuracy and precision of predicting the plant's phenotype are relatively low.
Although efforts have been made to relate the metabolome of a new plant variety to a phenotype or trait of interest, such studies can be challenging and imprecise.
Traditional metabolome analysis is complex, expensive and time consuming.
High fidelity naming and quantification of metabolites is typically slow and labor intensive.
Thus, the use of metabolomics for evaluating and predicting plant phenotypes can be complex and costly.

Method used


Image

  • Prediction of phenotypes and traits based on the metabolome
  • Prediction of phenotypes and traits based on the metabolome
  • Prediction of phenotypes and traits based on the metabolome

Examples


example 1

Quantitative Prediction of Relative Plant Biomass and Nitrogen Use Efficiency Under Nitrogen Deprivation

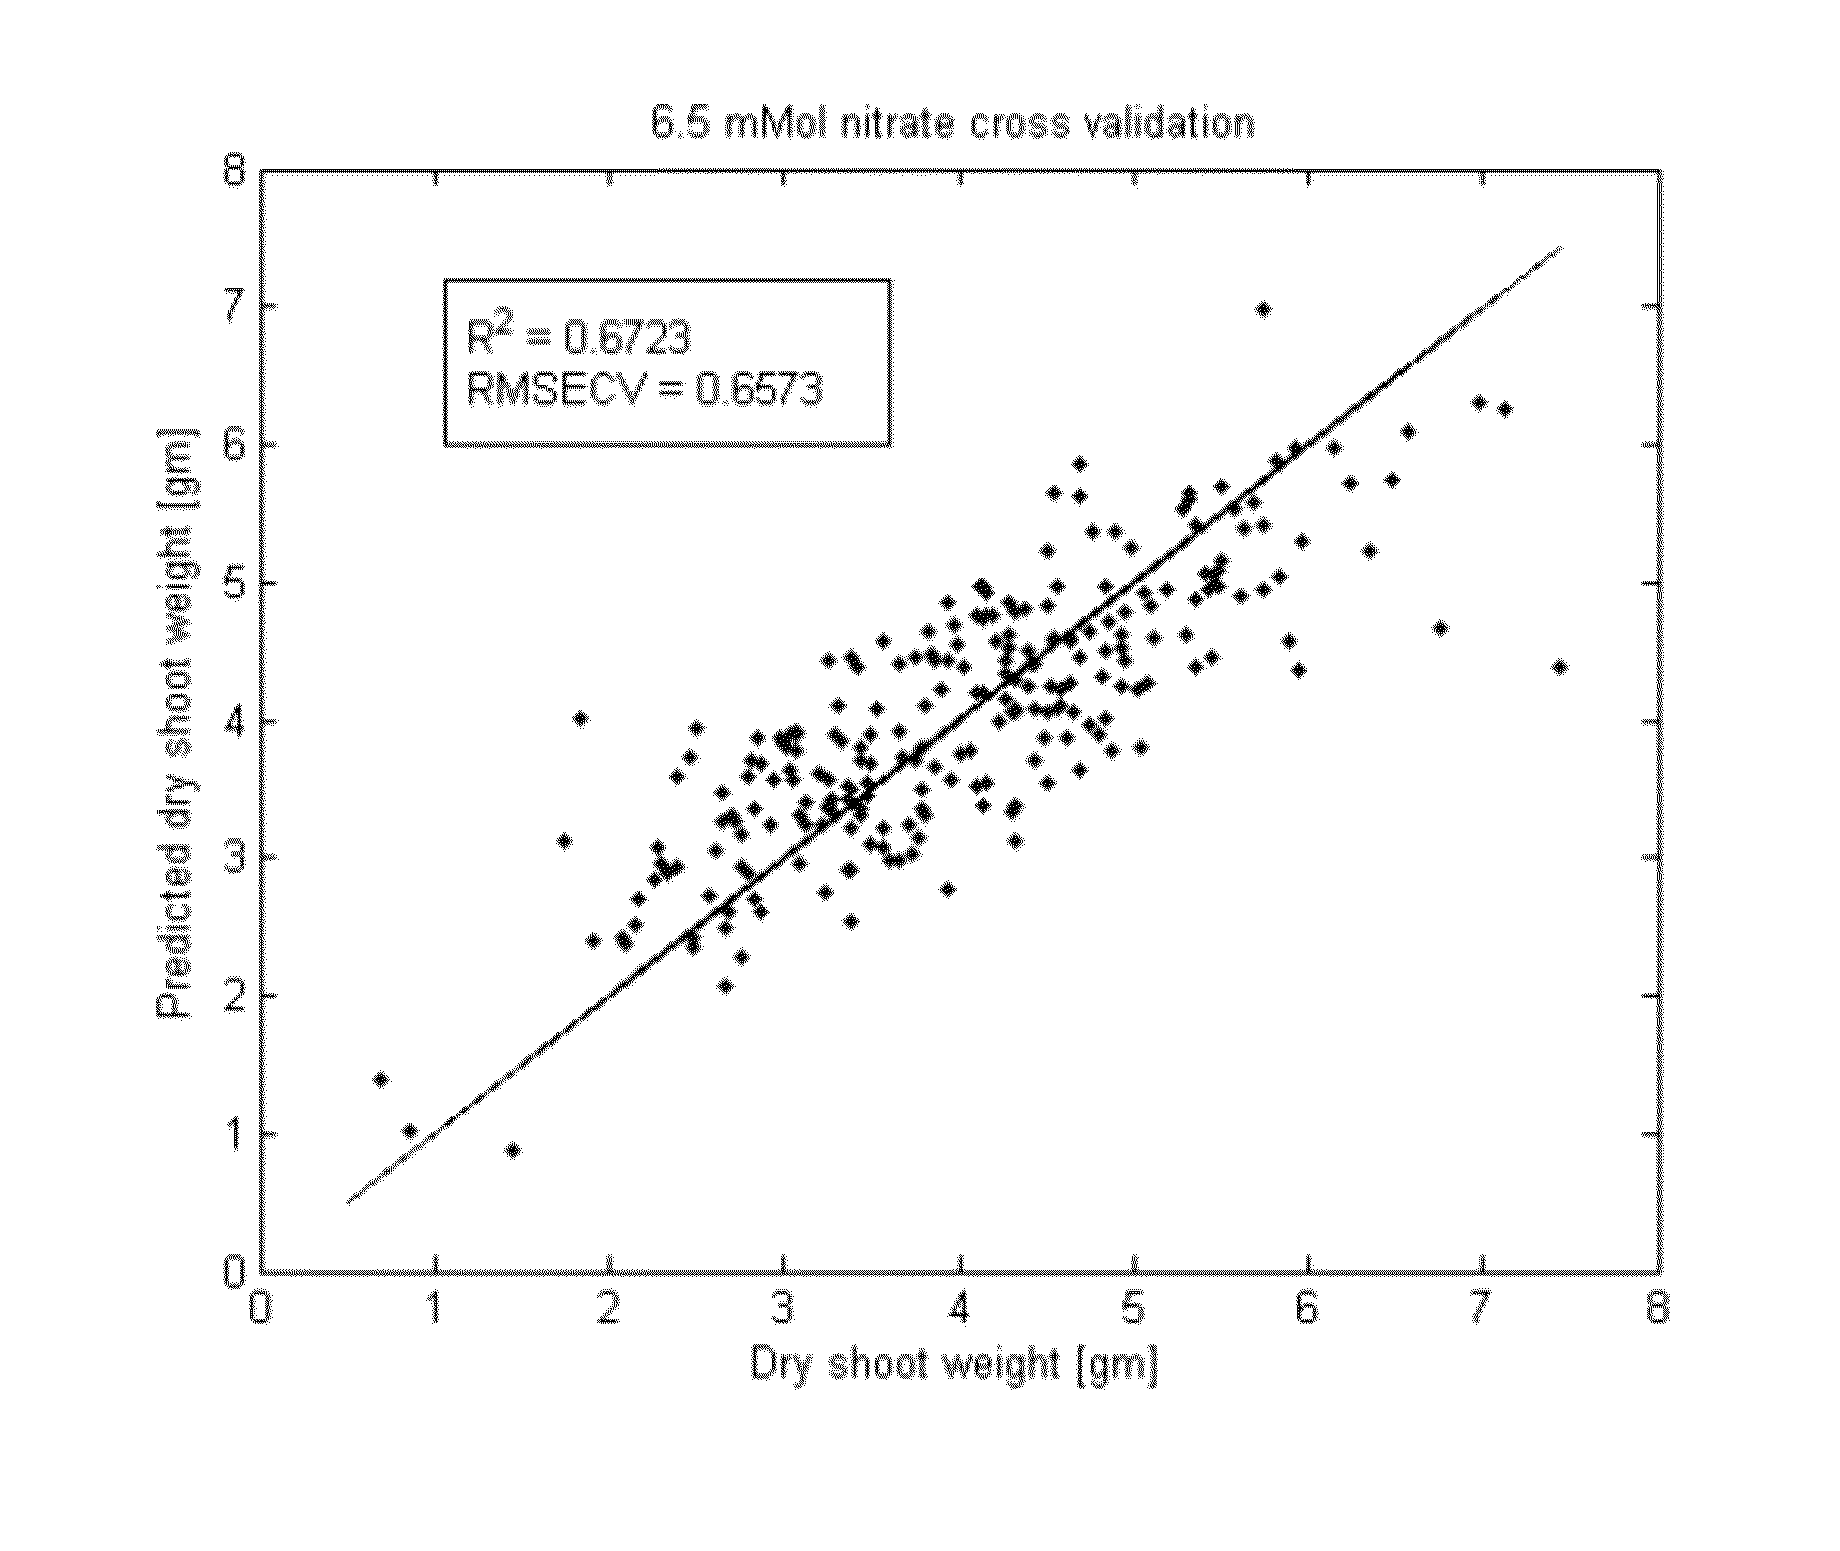
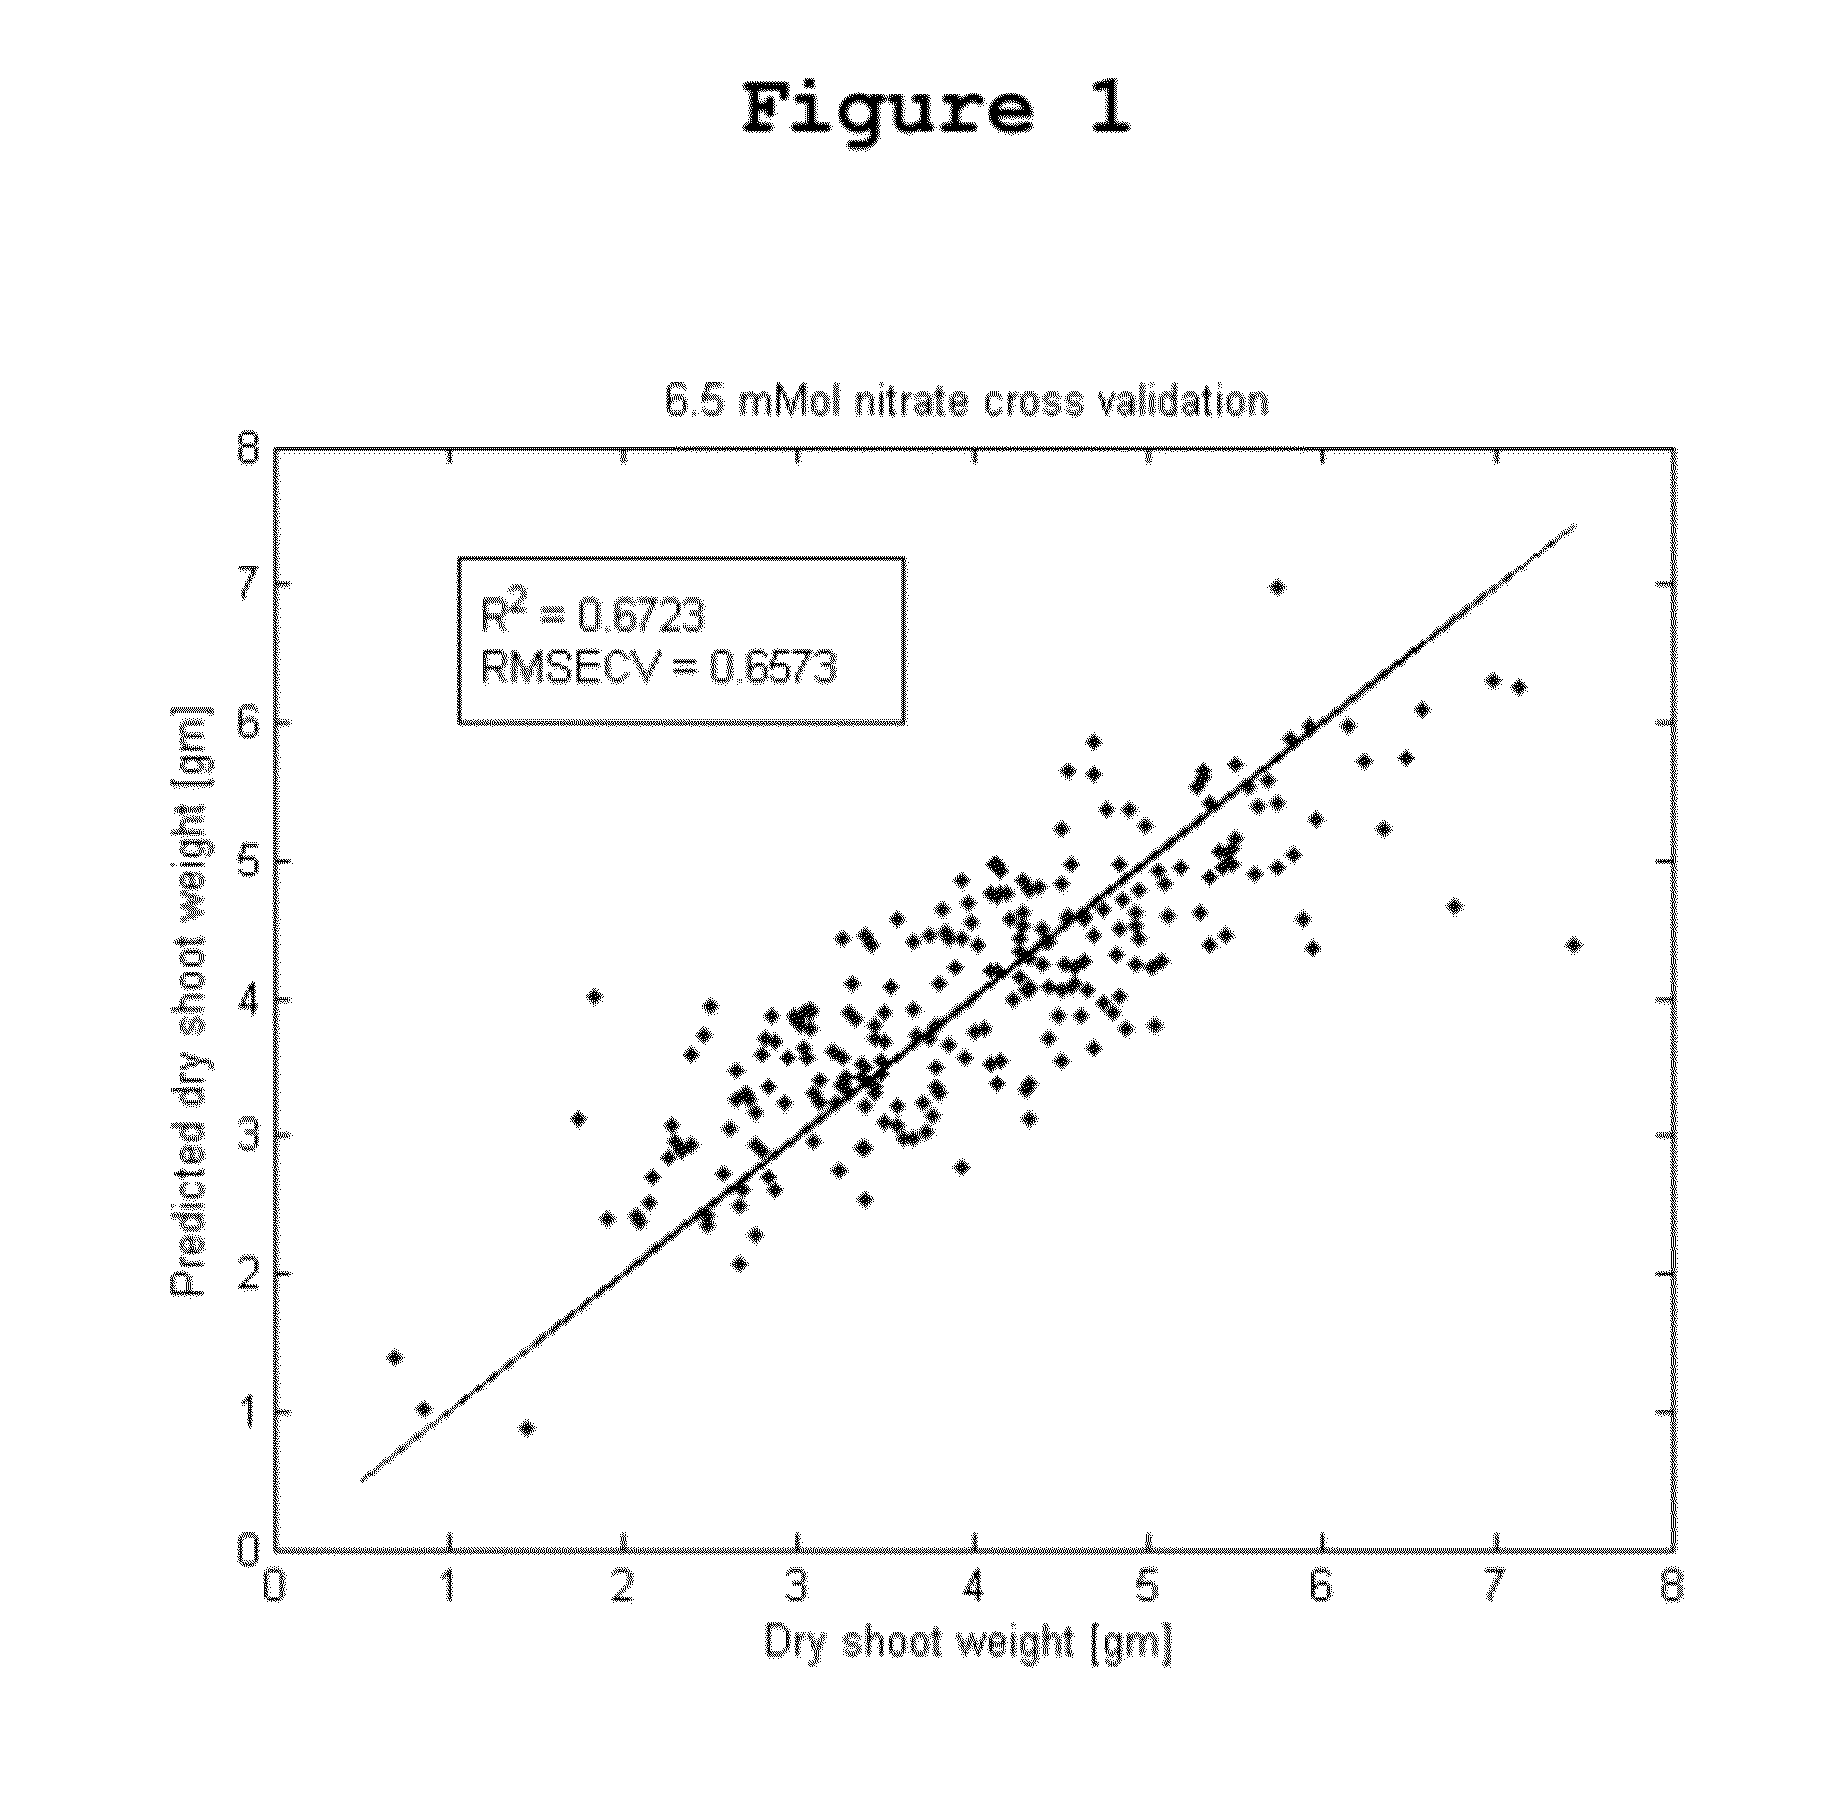
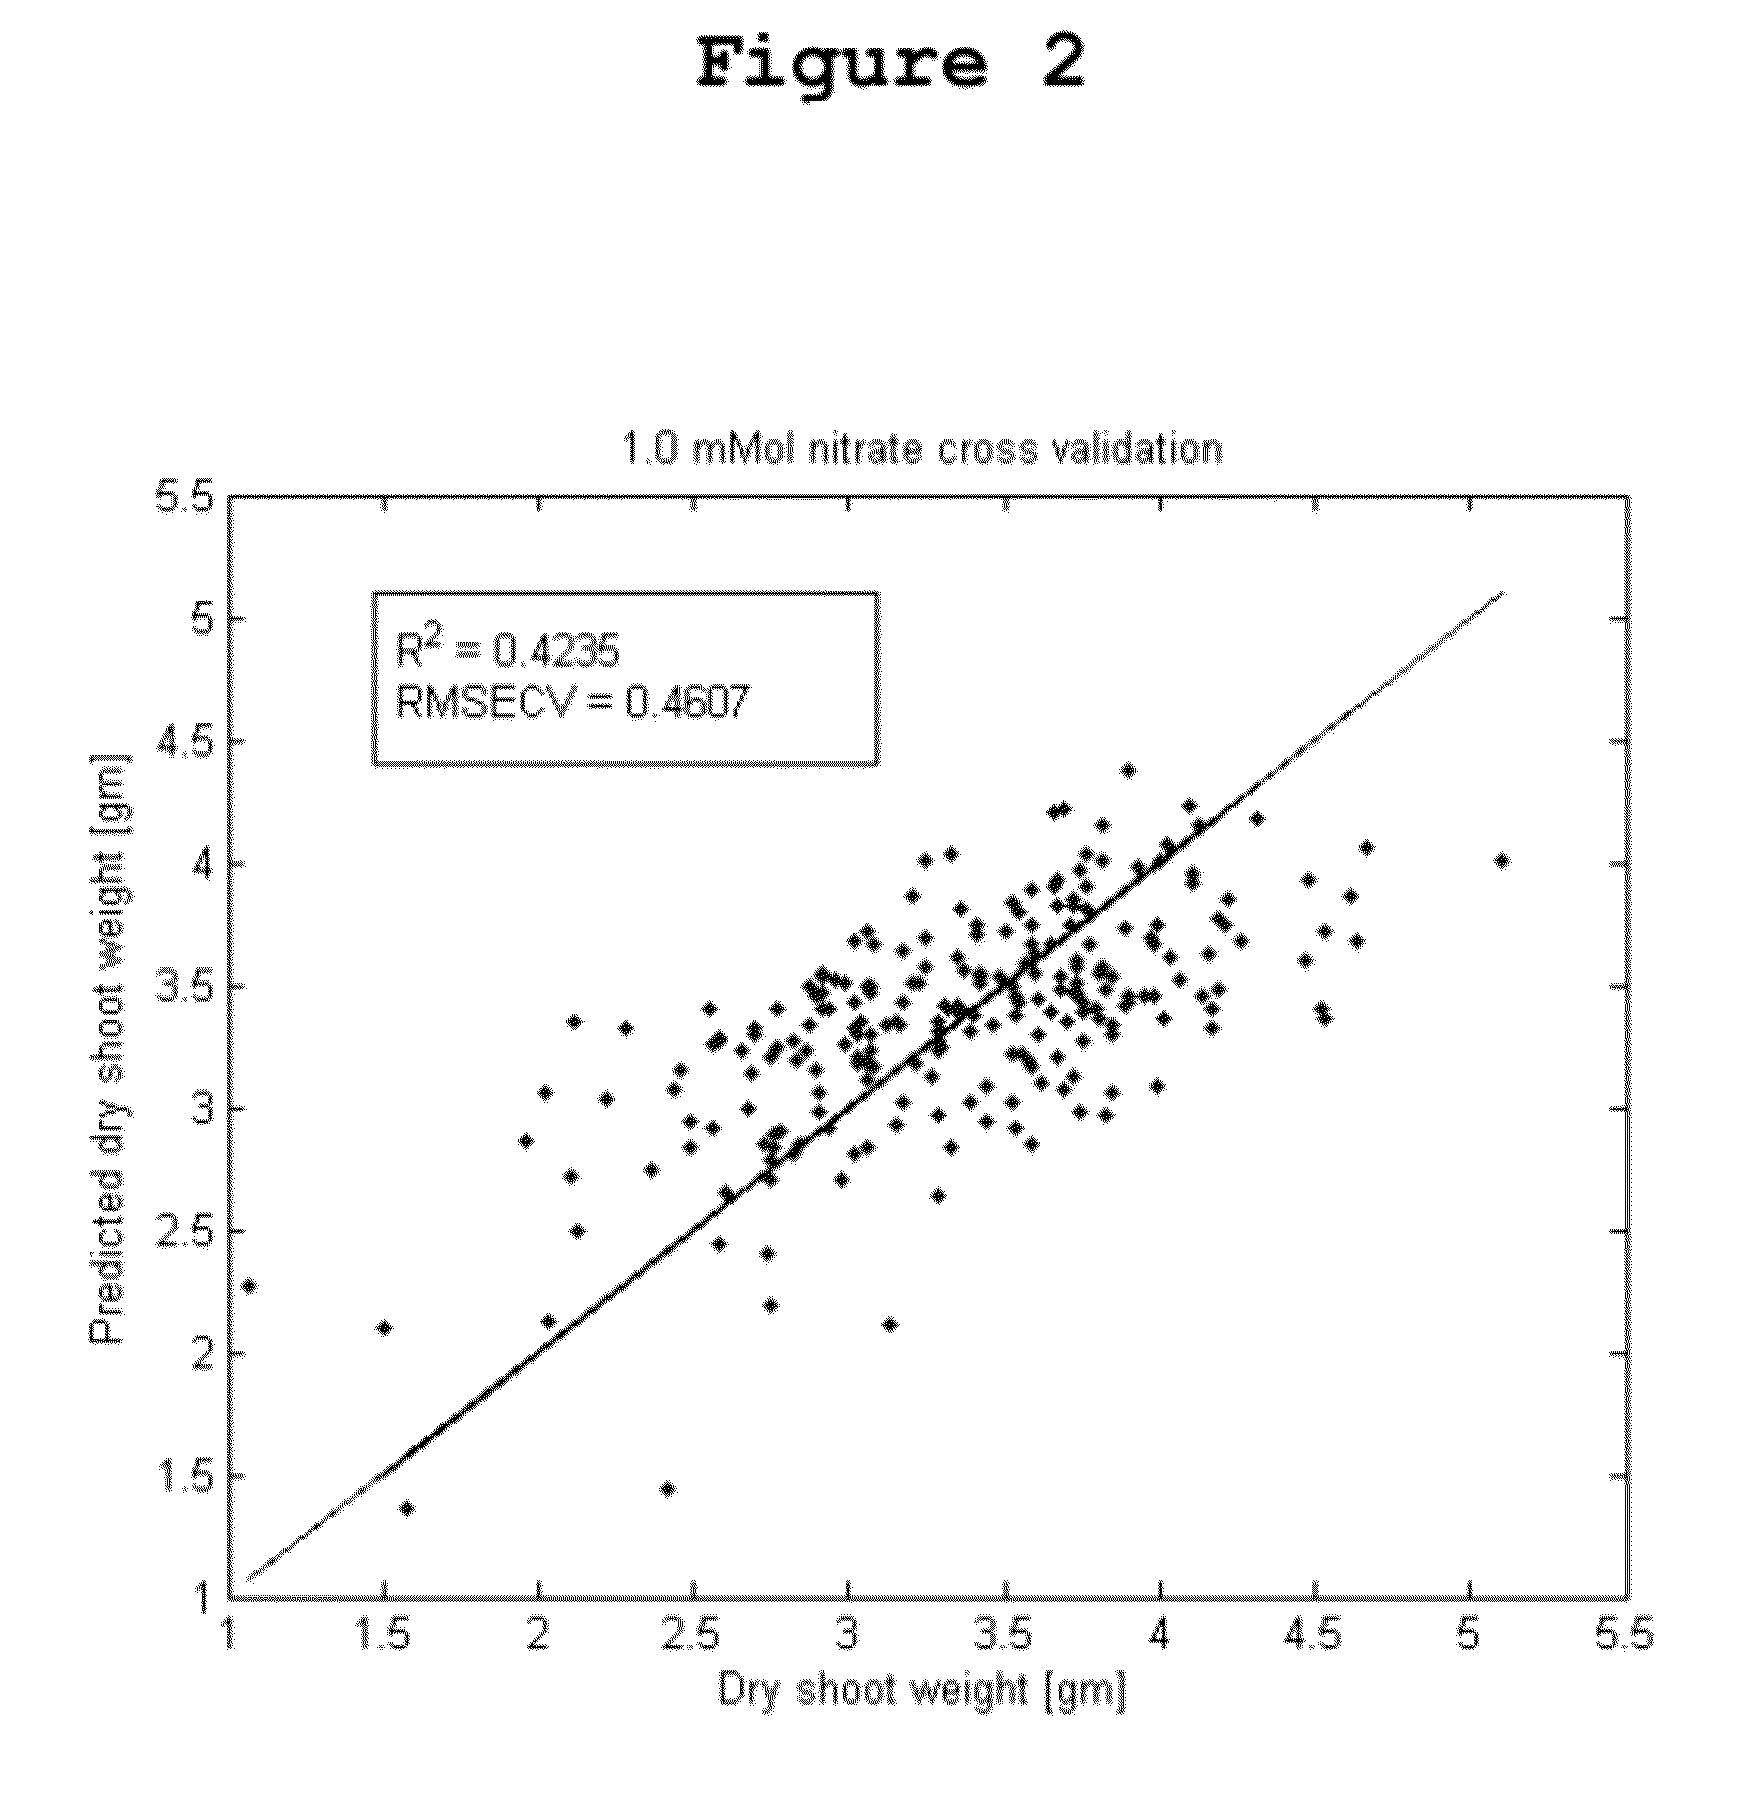
[0182]Relative plant biomass and nitrogen use efficiency (NUE) were predicted in corn using the methods of the invention. Plant biomass was observed as an indicator of plant productivity under different treatment conditions. As used herein, “nitrogen use efficiency” or “NUE” is defined as the ratio of aerial plant biomass under low nitrogen conditions to the aerial plant biomass under normal nitrogen conditions. Relative plant biomass and NUE were predicted using 250 inbred corn lines. Twelve replicates of each inbred line were grown under normal nitrogen solutions (6.5 mMol nitrate) or low nitrogen solutions (1.0 mMol nitrate). Six batches of each group of plants were grown over six time periods from August to January, and the plants were sampled for metabolomics at vegetative stage 7. Characterization of plant metabolic and phenotypic profiles was accomplished as described herei...

example 2

Qualitative Class Prediction for Ranking Transgenes in Response to Drought

[0197]A PLSDA classification model was used to predict the qualitative effect of two drought-tolerance genes in transgenic corn plants. As demonstrated herein below, the metabolome can be used to gauge the efficacy of genetic modifications by comparing the proximity of the stressed metabolome to a PLSDA classification model built between unmodified restricted water plants and unmodified well-watered plants. This can be accomplished through a dimensionally-reduced class prediction. In the PLSDA classification model, each metabolite is weighted according to its ability to separate the treatments. The model can then be used to predict the transgenically modified plants' response to stress.

[0198]In the present example, two drought-tolerance constructs were tested in a greenhouse drought assay. Control plants were used that had independent planting dates for each of the constructs. Transgenic plant seeds were obtai...

example 3

Qualitative Prediction of Transgene Responses

[0200]In the widescale testing of transgenic hybrids expressing a gene of interest, a high yielding preferred phenotype was observed. Twenty two hybrids expressing the gene of interest were planted in Chile in a field experiment. Hybrids from the same genotype with different gene stacks were also included to provide metabolic contrasts. Based on the extensive product testing, hybrids were classified according to the observation of the yield effects.

[0201]A PLSDA model was calculated using a single genotype with the gene of interest incorporated into the hybrid from each of the parents. In the Chile experiment, one of these common parent hybrids exhibited a high yielding phenotype, while the other did not. The classes in this PLSDA model were designated high yield and other. The model was improved through variable selection, using a genetic algorithm and the other hybrids as a validation set. Using the predictions from the replicates, a pr...


PUM


Abstract

The invention provides methods for characterizing metabolic profiles, phenotypic profiles and trait profiles in plants or groups of plants. Additionally, methods for establishing an unbiased model between a phenotypic profile and a metabolic profile, or between a trait profile and metabolic profile, are also provided by the invention. Further, methods for using such unbiased models to accurately predict the development of a phenotype of interest or a trait of interest in an independent, immature plant are also provided. In one embodiment, immature plants are selected for use based on their predicted development of a phenotype or trait of interest.

Description

CROSS-REFERENCE TO RELATED APPLICATIONS[0001]This application claims the benefit of U.S. Provisional Application 61 / 414,645, filed Nov. 17, 2010, herein incorporated by reference in its entirety.FIELD OF THE INVENTION[0002]The invention relates to the field of metabolomics and, more particularly, the use of metabolomics data and statistical analyses to predict phenotypes and traits in plants.BACKGROUND OF THE INVENTION[0003]The agricultural industry continuously develops new plant varieties which are designed to produce high yields under a variety of environmental and adverse conditions. At the same time, the industry also seeks to decrease the costs and potential risks associated with traditional approaches such as fertilizers, herbicides and pesticides. In order to meet these demands, plant breeding techniques have been developed and used to produce plants with desirable phenotypes. Such phenotypes may include, for example, increased crop quality and yield, increased crop toleranc...

Claims


Application Information

Patent Timeline
IPC IPC(8): H01J49/40H01J49/26G16B5/00G16B20/00G16B20/20G16B20/50G16B40/20G16B40/30
CPCG06F19/18G06F19/24G01N33/4833B01D15/08G16B40/00G16B5/00G16B20/00G16B40/30G16B20/50G16B20/20G16B40/20G01N30/8675A01H3/00
Inventor HAZEBROEK, JANJANNI, JAMESLIGHTNER, JON
Owner PIONEER HI BRED INT INC
Learn More