Spectroscopic methods to detect and characterize microorganisms

a microorganism and spectroscopic technology, applied in the field of spectroscopic methods to detect and characterize microorganisms, can solve the problems of poor quality spectra and slow application of this method to the study of the conformation of biological molecules

Active Publication Date: 2018-10-11
SPECTRAL PLATFORMS
View PDF1 Cites 9 Cited by
  • Summary
  • Abstract
  • Description
  • Claims
  • Application Information

AI Technical Summary

Benefits of technology

[0004]Aspects of the present disclosure include methods and systems for Resonant Raman spectroscopy. Methods according to certain embodiments include irradiating a sample with a monochromatic light source at a first irradiation intensity and a second irradiation intensity, determining the intensity of one or more of the Resonant Raman scattering and fluorescence scattering at the first irradiation intensity and second irradiation intensity, calculating a rate of change of one or more of the intensity of Resonant Raman scattering and fluorescence scattering in response to the change in irradiation intensity from the first irradiation intensity to the second irradiation intensity and comparing one or more of the rate of change in the intensity of Resonant Raman scattering and the rate of change in the intensity of fluorescence scattering with the rate of change in the irradiation intensity by the monochromatic light source to determine the spectroscopic response of the sample. In some embodiments, the spectroscopic response (e.g., Resonant Raman scattering and/or flu...

Problems solved by technology

The application of this method to the study of the conformations of biological molecules has developed only slowly because of numerou...

Method used


Image

  • Spectroscopic methods to detect and characterize microorganisms
  • Spectroscopic methods to detect and characterize microorganisms
  • Spectroscopic methods to detect and characterize microorganisms

Examples


example 1

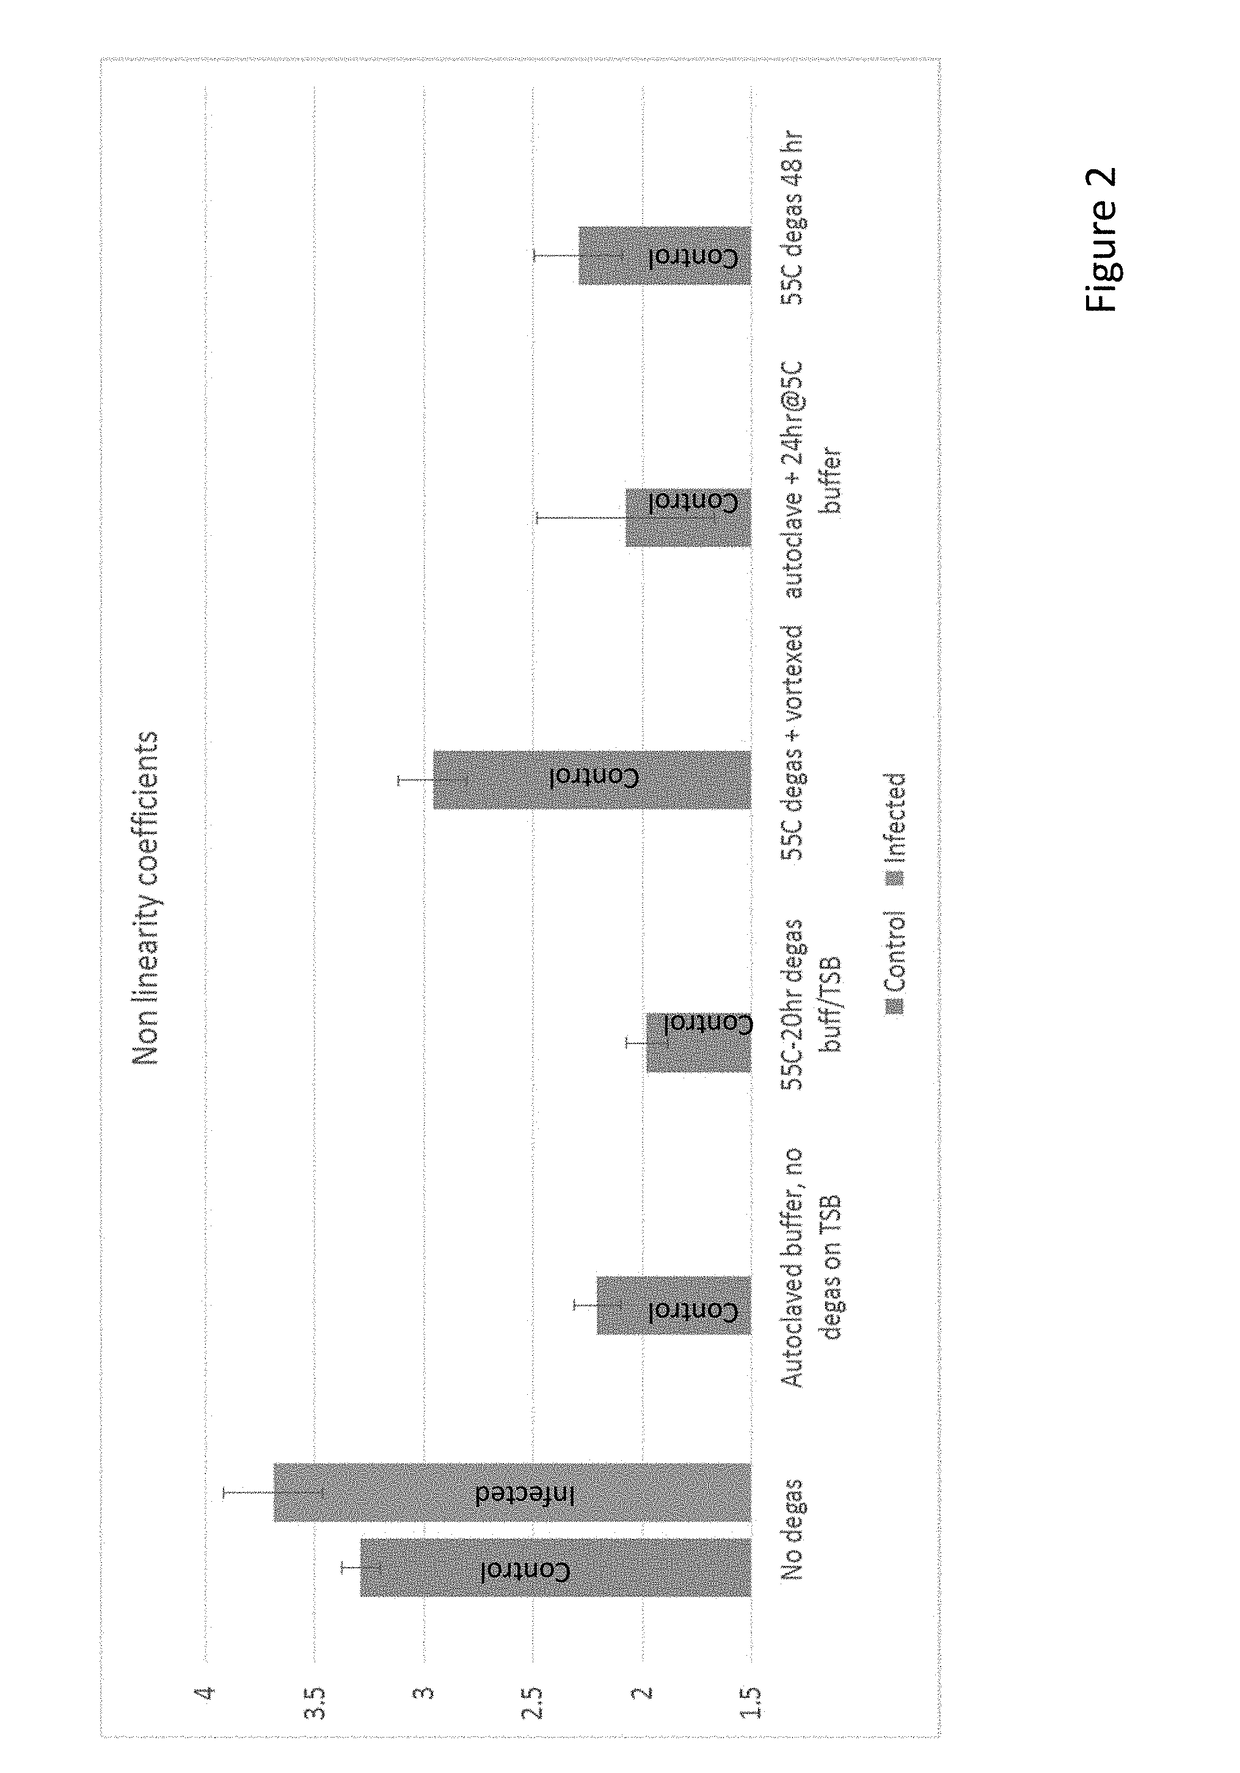
[0341]FIG. 2 depicts an example of non-linear Resonant Raman spectroscopy for characterizing small changes in a composition. The samples contain lycopene that is non-covalently associated into albumin (as described in U.S. Patent Publication No. 2016 / 0324933, the disclosure of which is herein incorporated by reference), to which a nutritional buffer was added to support microbial metabolism, and a buffer that maintains the pH at 7.2.

[0342]In these examples, non-linear Resonant Raman spectroscopy measures the Resonant Raman spectrum of lycopene and the magnitude of the Raman peaks are a sensitive function of small changes in the composition. Since the lycopene is incorporated into albumin, the non-linearity of the Resonant Raman response (i.e., the calculated non-linear Resonant Raman coefficient) characterizes the environment provided by albumin, and since albumin is designed to solubilize molecules that are insoluble in water, the non-linearity of the Resonant Raman will respond to...

example 2

[0345]Bilirubin is a powerful antioxidant present in serum and has very weak optical absorption at 532 nm. In this example, bilirubin is used to control the signal in non-linear Resonant Raman spectroscopy and is used to improve signal-to-noise ratio when characterizing test samples.

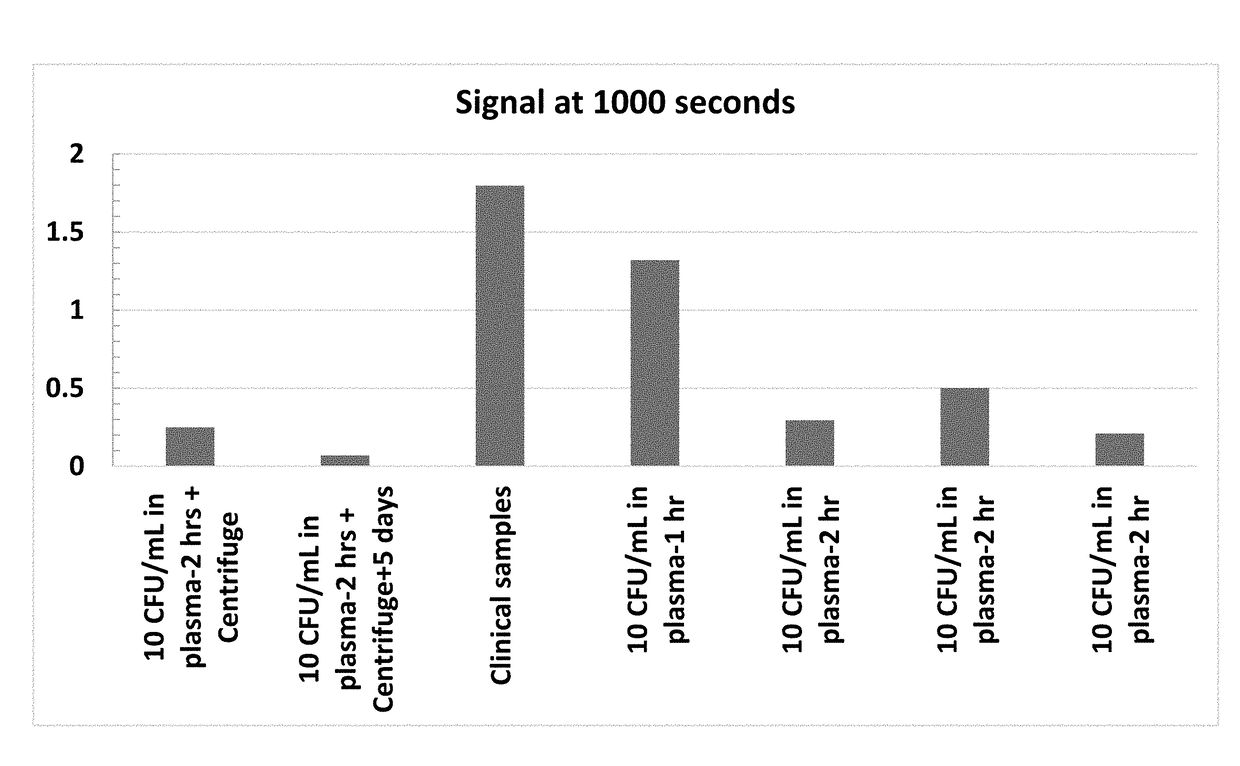
[0346]In the samples described, bilirubin is added and is non-covalently associated with an albumin protein. FIGS. 3 and 4 depict the effect of bilirubin on the average Resonant Raman peak intensity. FIG. 3 depicts the average Raman peak height from 4 uninfected control samples and 3 samples infected with 10 CFUs of S. aureus. In all cases, the reagent includes lycopene incorporated into albumin and diluted into 4 mL of buffer medium and containing 0.5× of a nutritional broth to enable bacteria metabolism. FIG. 4 depicts the average Raman peak height from 4 uninfected control samples and 3 samples infected with 10 CFUs of S. aureus with 1 μM of added bilirubin. By comparison with FIG. 3, the dip in the i...

example 3

[0349]Without being bound to any particular theory or mechanism of action, bilirubin in the subject methods enhances the signal in non-linear Resonant Raman spectroscopy by: (a) scavenging free radicals generated by the laser light. This reduces the artifact that can interfere with the signal, and so reduces the standard deviation around the control samples. Thus, the standard deviation around the average rates of change of the lycopene peaks in uninfected samples decreases as bilirubin is added to the assay (b) scavenging free radicals generated by the metabolic activity of the microorganism present in the sample. This can slow down the changes caused by the microorganism, in particular when changes to the sample are too rapid to observe cleanly in the absence of bilirubin.

[0350]FIG. 7 shows a plot of the signal-to-noise ratio of samples that contain lycopene non-covalently associated with an albumin protein and different amounts of bilirubin as a function of data collection time. ...


PUM


Abstract

Methods and systems for Resonant Raman spectroscopy are provided. Methods according to certain embodiments include irradiating a sample with a monochromatic light source at a first irradiation intensity and a second irradiation intensity, determining the intensity of one or more of the Resonant Raman scattering and fluorescence scattering at the first irradiation intensity and second irradiation intensity, calculating a rate of change of one or more of the intensity of Resonant Raman scattering and fluorescence in response to the change in irradiation intensity from the first irradiation intensity to the second irradiation intensity and comparing one or more of the rate of change in the intensity of Resonant Raman scattering and the rate of change in the intensity of fluorescence scattering with the rate of change in the irradiation intensity by the monochromatic light source to determine the Resonant Raman response of the sample. Methods also include determining the presence or absence of a microorganism in a sample and correcting for variations associated with measurement instrumentation (e.g., monochromatic light source) and variations associated with the sample (e.g., fluorescence from non-target compounds). Also provided are methods for determining the antimicrobial susceptibility of a microorganism to an antimicrobial agent as well as methods for characterizing a phenotype of an unknown microorganism in a sample. Systems for practicing the subject methods are also provided.

Description

CROSS-REFERENCE[0001]This application claims the benefit of U.S. Provisional Patent Application No. 62 / 614,216, filed Jan. 5, 2018, and U.S. Provisional Patent Application No. 62 / 473,876, filed Mar. 20, 2017, which applications are incorporated herein by reference in their entireties.INTRODUCTION[0002]Raman spectroscopy is used to characterize the vibrational, rotational and other low frequency molecular motions of compounds and is commonly employed to provide data for identifying the presence of particular molecules in a sample. Raman scattering is the inelastic scattering of monochromatic light (e.g., ultraviolet, visible or near infrared) where the light interacts with molecular vibrations resulting in a shift in energy by the scattered photons. The application of this method to the study of the conformations of biological molecules has developed only slowly because of numerous difficulties such as the great complexity of the spectra, poor quality spectra obtained from dilute sol...

Claims


Application Information

Patent Timeline
IPC IPC(8): G01N21/65C12Q1/04C12Q1/14C12Q1/18G01N21/64
CPCG01N21/65C12Q1/04C12Q1/14C12Q1/18G01N21/6428G01N2201/06113G01N21/6408G01N21/6486
Inventor VERMA, RAVIYU, CHANGJUN
Owner SPECTRAL PLATFORMS
Why Eureka
Try Eureka