Detection of neutrons and heavy charged particles
a neutron and heavy charge technology, applied in the field of radiation dosimetry techniques, can solve the problems of difficult discrimination between neutrons and heavy charge particles, low saturation fluence, and laborious wet-chemistry processing
- Summary
- Abstract
- Description
- Claims
- Application Information
AI Technical Summary
Problems solved by technology
Method used
Image
Examples
example i
[0132]Samples of a Al2O3:C,Mg crystal in the form of plates with dimensions 18 mm×10 mm×1.6 mm are cut along the optical c-axis and polished on the larger opposing sides to obtain optically transparent surfaces. The concentration of Mg in the crystal determined by spectral analysis is 27 ppm. The “as-grown” crystal has a green coloration due to the optical absorption band at 435 nm with an absorption coefficient of 3 cm−1.
[0133]One crystal is prepared for alpha-particle irradiations and one half of it is covered with the masking tape having thickness greater than the penetration range of alpha particles from 241Am source. Two other dosimeter configurations of Al2O3:C,Mg single crystals with neutron converters are also used. The first configuration involves covering the crystal with 6LiF and 7LiF converters for thermal neutron measurements. The second configuration involves covering the crystal with a 1 mm thick high density polyethylene converter for the production of recoil protons...
example ii
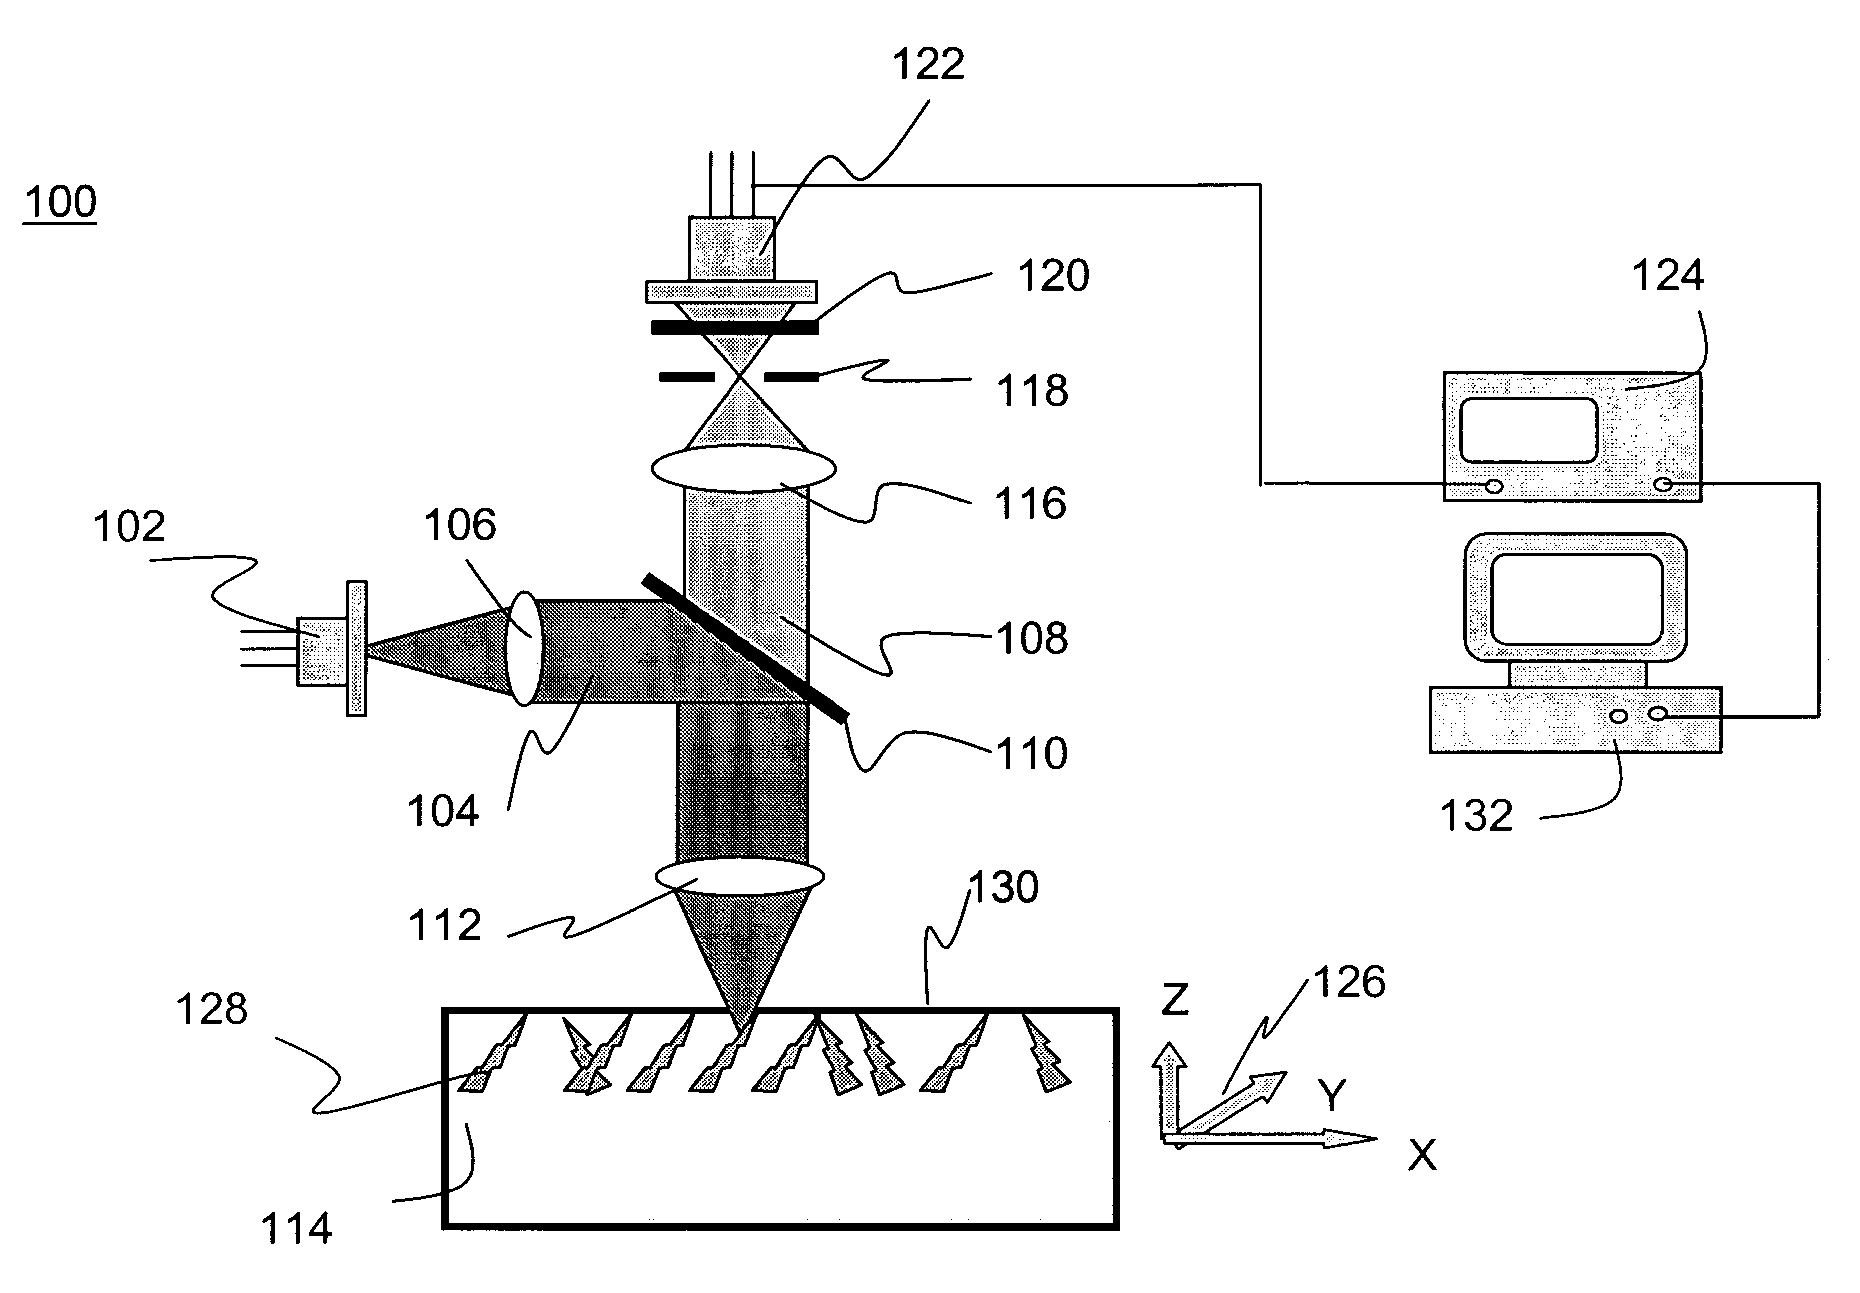
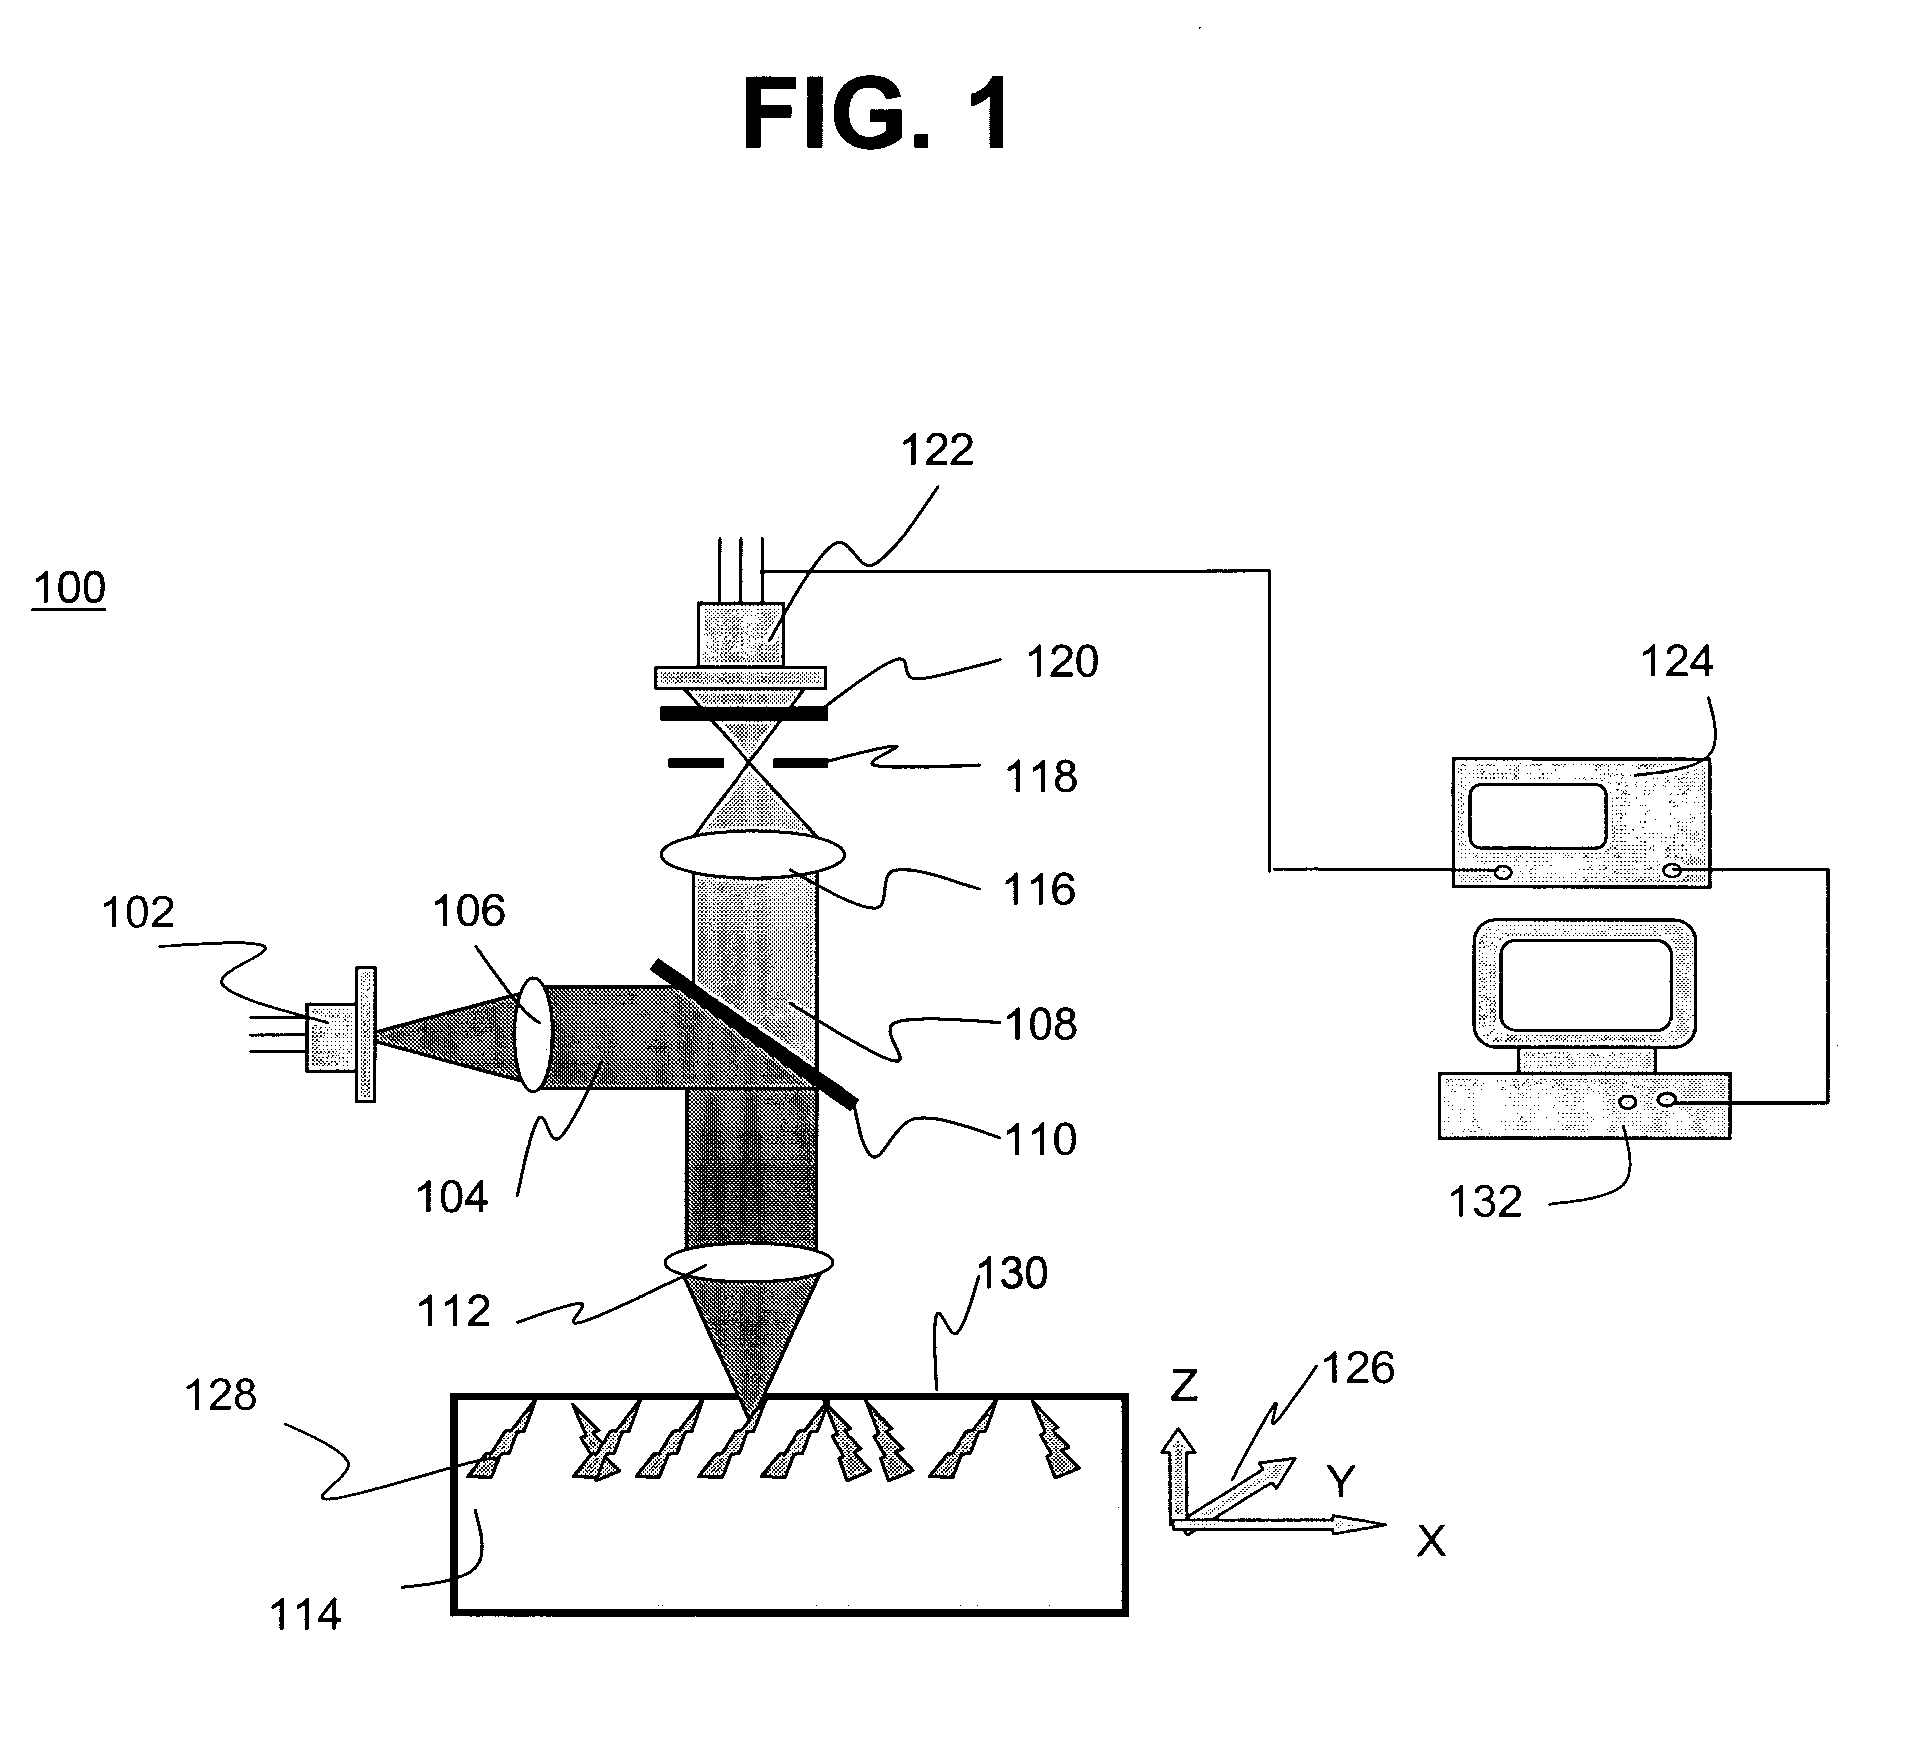
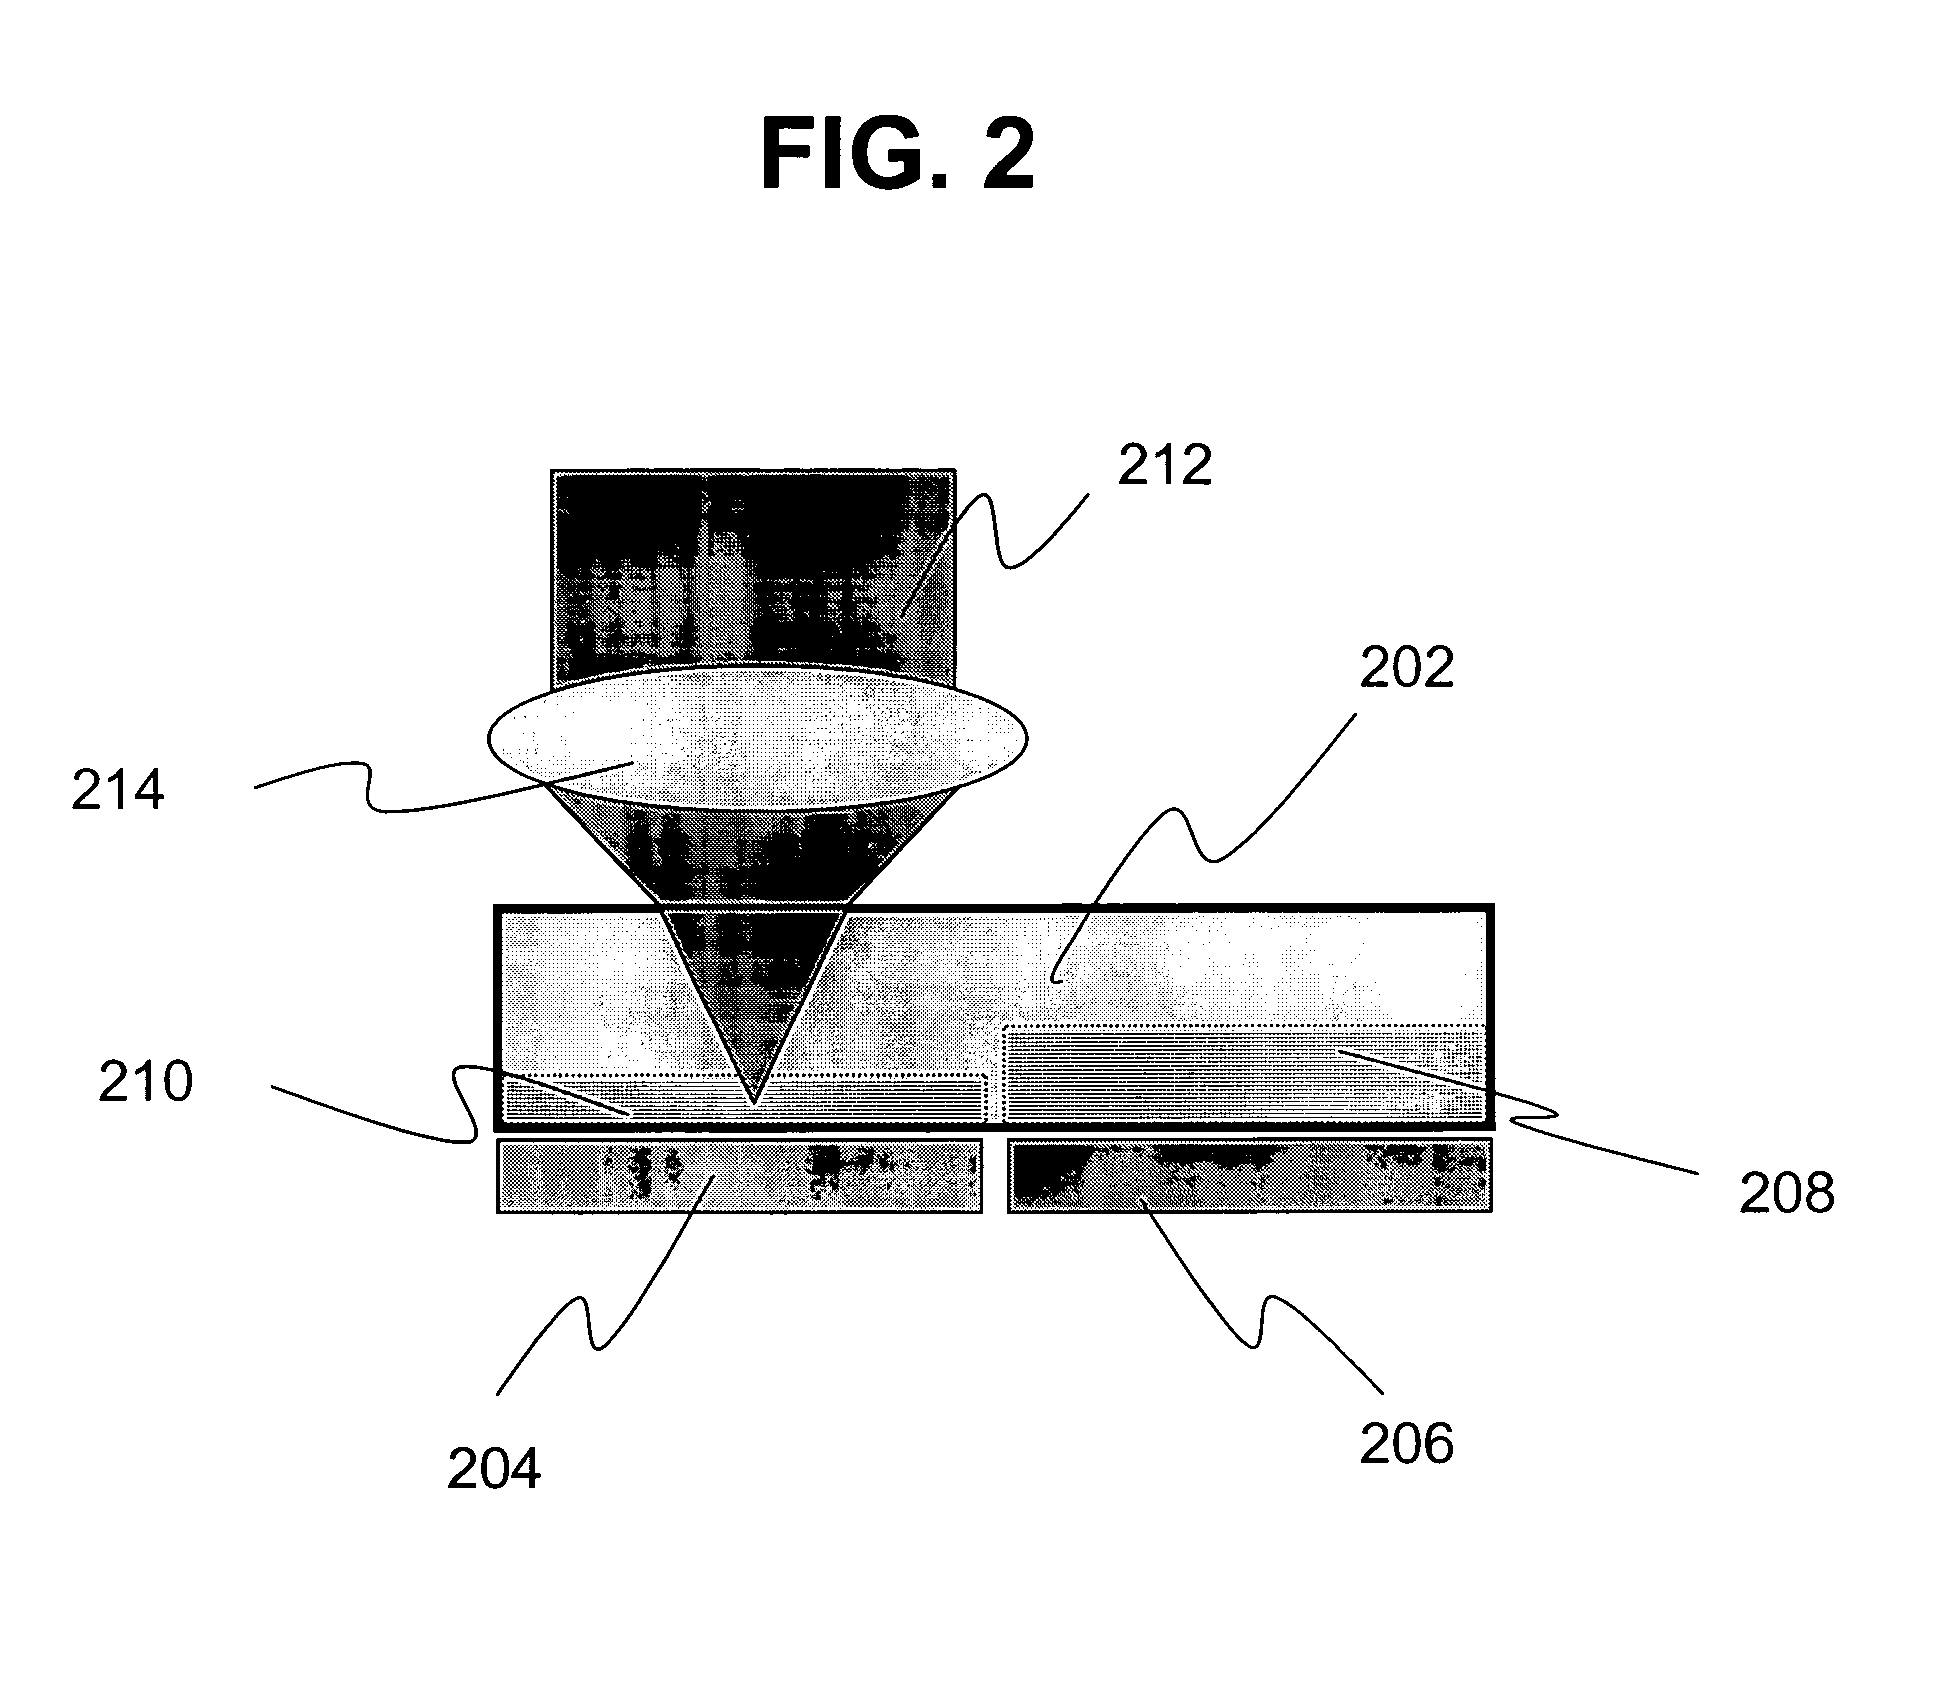
[0136]To obtain a depth distribution of the fluorescent signal after alpha particle irradiation, Al2O3:C,Mg crystals are irradiated with a high fluence of alpha particles from an 241Am source. The images in FIGS. 3 and 4 show the distribution of fluorescent intensity as a function of depth (XZ-scan) in the crystal before (FIG. 4) and after (FIG. 3) the irradiation. As shown in FIGS. 3 and 4, the individual and overlapping tracks can be easily seen. The average depth distribution of the fluorescent signal is graphically plotted in FIG. 24, where the curve indicated by arrow 2401 represents the signal after alpha irradiation, the curve indicated by arrow 2402 is the signal from the masked crystal and the curve 2403 is the difference of two curves 2401 and 2402. The maximum average fluorescence is measured at depths between 1 and 3 μm below the surface; individual tracks perpendicular to the crystal surface have a maximum range of 14–17 μm. According to calculations performed using SRI...
example iii
[0137]The sensitivity and the detection efficiency of the method of the present invention is demonstrated by the imaging of single tracks after short time exposure with alpha particles from an 241Am source of known low emission rate, to determine whether an image of single tracks can be obtained, and to distinguish the fluorescent signal produced within the track from the background fluorescence. The known fluence of alpha particles provides an estimate of the detection efficiency of the new technology. The Al2O3:C,Mg crystals are exposed to alpha particles from a 241Am source having an assumed uniform deposition within a 18 mm radius. The calibration data indicates a flux of 0.0085 s−1 mm−2 at a distance of 5 mm from the source. The exposure time is 64.32 hours and the delivered fluence of alpha particles is 1968 mm−2. Based on the data from FIG. 24, the optimum depth for imaging the majority of tracks incident on the sample at different angles is determined to be 3 μm below the su...
PUM
 Abstract
Description
Claims
Application Information
 - R&D
- Intellectual Property
- Life Sciences
- Materials
- Tech Scout
- Unparalleled Data Quality
- Higher Quality Content
- 60% Fewer Hallucinations
Browse by: Latest US Patents, China's latest patents, Technical Efficacy Thesaurus, Application Domain, Technology Topic, Popular Technical Reports.
© 2025 PatSnap. All rights reserved.Legal|Privacy policy|Modern Slavery Act Transparency Statement|Sitemap|About US| Contact US: help@patsnap.com


