
System for generating thermographic images using thermographic signal reconstruction

a thermographic image and signal reconstruction technology, applied in the field of thermographic imaging, can solve the problems of subjective visual defect identification methods, the surface immediately above the defect cools at a different rate, and traditional methods become less effective, so as to reduce the size and complexity of the temperature-time history of image data, improve the temporal and spatial signal-to-noise ratio of infrared camera output, and reduce the size and complexity of image data. the effect of reducing the size and complexity of image data

Active Publication Date: 2010-05-25
THERMAL WAVE IMAGING INC
View PDF10 Cites 48 Cited by
  • Summary
  • Abstract
  • Description
  • Claims
  • Application Information

AI Technical Summary

Benefits of technology

"The present invention is a system and method for determining the time response of a sample's temperature change. It uses a camera to capture images of the sample over time, each image containing a plurality of pixels with amplitudes corresponding to the sample's temperature change. A processor then creates a data array for each pixel, which is a reconstructed version of the raw image data. This is done by fitting a polynomial to the pixel amplitude data. The processor then generates a plurality of reconstructed images from the data array, which is a scaled version of the original image. These reconstructed images are then combined to create an image mosaic, which provides a more complete and accurate representation of the sample's temperature change over time."

Problems solved by technology

More particularly, these defects cause the surface immediately above the defect to cool at a different rate that the surrounding defect-free areas.
However, as manufacturing processes and safety standards requirements place higher demands regarding smaller / more subtle defect detection, these traditional methods become less effective because the small signal levels associated with subtle defects are lost in the noise, drift, and instability that is inherent to infrared cameras.
Also, visual defect identification methods tend to be subjective, and they do not readily and easily lend themselves to the automatic defect detection process.
Further, it is not possible to measure the depth of the defects simply by viewing the infrared images.
These types of calculations, however, often require expensive low noise, high-speed digital infrared cameras.
Further, the cumbersome nature of having a computer attached to the camera for conducting calculations makes the combination impractical for applications outside of a laboratory, such as field inspections.
Also, infrared data sequences of thermal decay typically used in non-destructive testing tend to be difficult to manipulate mathematically due to their low signal-to-noise ratios and large dynamic range and also require a great deal of computer processing power, memory and storage space.
In addition to the data storage, memory and processing problems noted above due to the large size of the infrared image data files, contrast-based methods require the identification of a defect-free region on the sample as a reference point.
This requirement is often not realistic for some samples if, for example, the size of the defect is larger than the infrared camera's field of view.
In such a case, there is no defect-free area available that can act as a reference for a given region.
Further, if the entire sample exhibits a defect (e.g., a large delamination running underneath the entire surface of the sample), there is no contrast between any region of the sample because the whole sample is equally or nearly equally defective.
If a defect (or group of defects) occupies a large portion of the field of view, the contrast method is ineffective because a significant portion of the mean value result is composed of data derived from defective sample points which acts to reduce any appreciable difference between the defect area and the mean when the contrast value is calculated.
Further, in evaluating the results from both the contrast-based methods and the data obtained directly from the infrared camera, identifying the time at which a maximum peak slope occurs (indicating the presence of a defect) is often difficult because the signals are often inherently noisy, thus the contrast based method must be capable of discriminating between pixels associated with defects and pixels associated with noise.
The peak slope may also be obscured if the instantaneous temperature of the sample exceeds the camera's peak temperature detection capabilities, causing an initial, highly nonlinear response from the camera due to camera saturation.
This approach, however, sacrifices spatial resolution to lessen temporal noise.
Another approach for reducing temporal noise is to average data over a selected number of consecutive frames, but this approach sacrifices temporal precision.
As a result, known techniques for reducing temporal and spatial noise necessarily degrade temporal and / or spatial resolution and precision.
However, when one understands the underlying physical process of thermal imaging as well as the nuances of using all but the most expensive thermal imaging cameras, these approaches prove unsuccessful for several reasons:
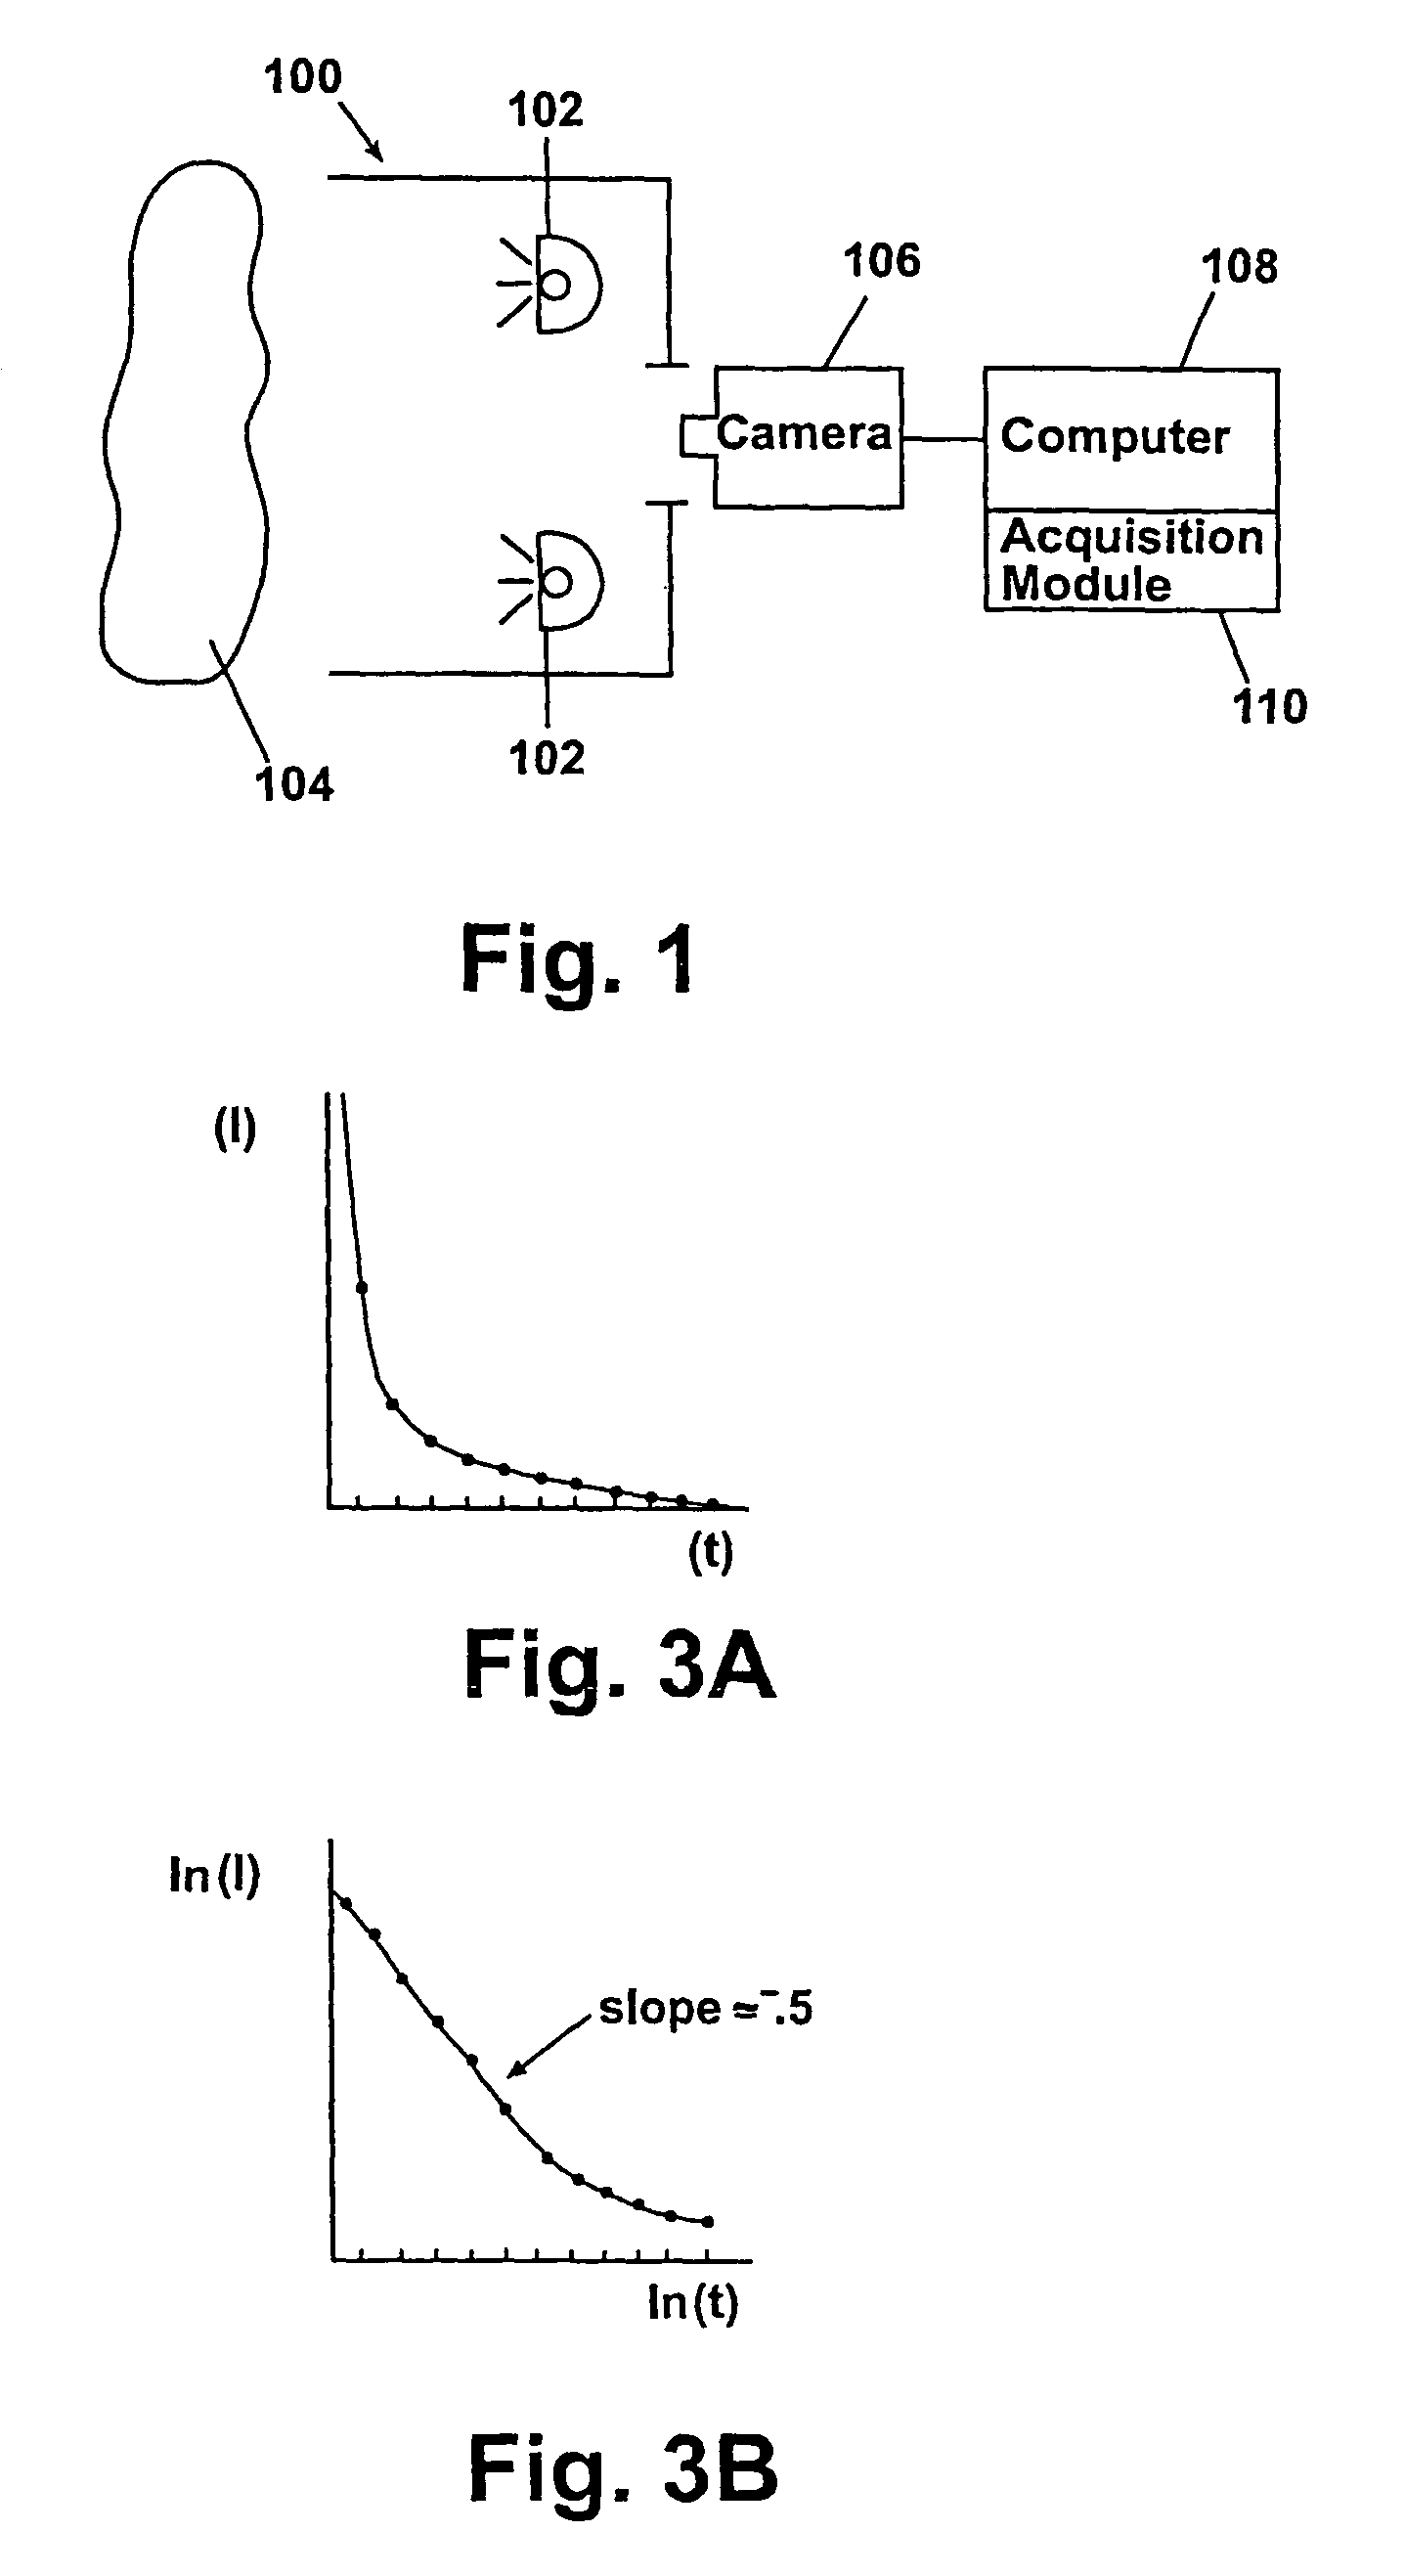
Thermographic data (when generated using a pulse of energy to heat the sample), presents an extremely large dynamic range thereby making it extremely difficult to accurately fit both the data occurring early in the sampling process (large amplitude) and later in the sampling process (small amplitude).
However, such high order terms introduce undesirable errors (such as oscillations) in the polynomial fit later in the time-temperature sequence when in fact the data is not oscillatory but rather stable.
As a result, the signal generated during this portion of the imaging exercise is often highly non-linear.
The early, high amplitude, data points dominate the fit and worsen the fit for later occurring data points.
The difference between the thermal response of an intact point (i.e. a defect free portion of a sample) and the thermal response of a sub-surface defects is often very small (e.g. on the order of the temperal noise) and accordingly very difficult to identify.
A defective component may fail to be “in spec” not because of a discreet defect, but rather because of distributed defects caused by process variables or problems due to tooling or material composition.
If the thermal emission patterns of the two specimens deviate from one another more than a predetermined amount, the production specimen is deemed defective.
Although the advantages associated with automated inspection are obvious, there are various challenges posed by automated inspection of thermal images.
Thus, these software routines will render inaccurate results if the orientation (rotation or translation) of the production image differs from that of the “gold standard” image.
Additionally, many known software algorithms employ temperature based schemes which makes them highly sensitive to the camera angle of the thermal imaging camera and the amount of heat energy used to thermally stimulate the samples.
Although this approach is effective in some applications, it has several notable drawbacks.
Accordingly, this approach does not lend itself to discriminate between a sample that is “all good” or “all bad” even though it is often highly desirable to be able to discriminate in this way.3. Comparison of two samples can only be accomplished by image-to-image comparison of each image “slice” in the corresponding data sequence of each sample.
This approach is not only cumbersome but lends itself to inaccuracies (if the images contain temperature or temperature contrast data).
These inaccuracies arise primarily because it is very difficult to establish repeatable temperatures from shot-to-shot (inasmuch as temperature is highly dependent on ambient conditions, heat energy input, energy distribution and other factors).
Although this type of information is very useful in terms of physical dimensions or determining whether or not there are defects in the sample, it is entirely possible that a sample could be defect-free and yet still be sufficiently deficient to warrant rejection.
For example, a specimen could be compositionally different (e.g. a mixture in the fabrication process was incorrect), or it could contain an excessive amount of porosity (pores that are too small to be resolved thermally, but that effect the density of the sample).

Method used


Image

  • System for generating thermographic images using thermographic signal reconstruction
  • System for generating thermographic images using thermographic signal reconstruction
  • System for generating thermographic images using thermographic signal reconstruction

Examples


Embodiment Construction

General

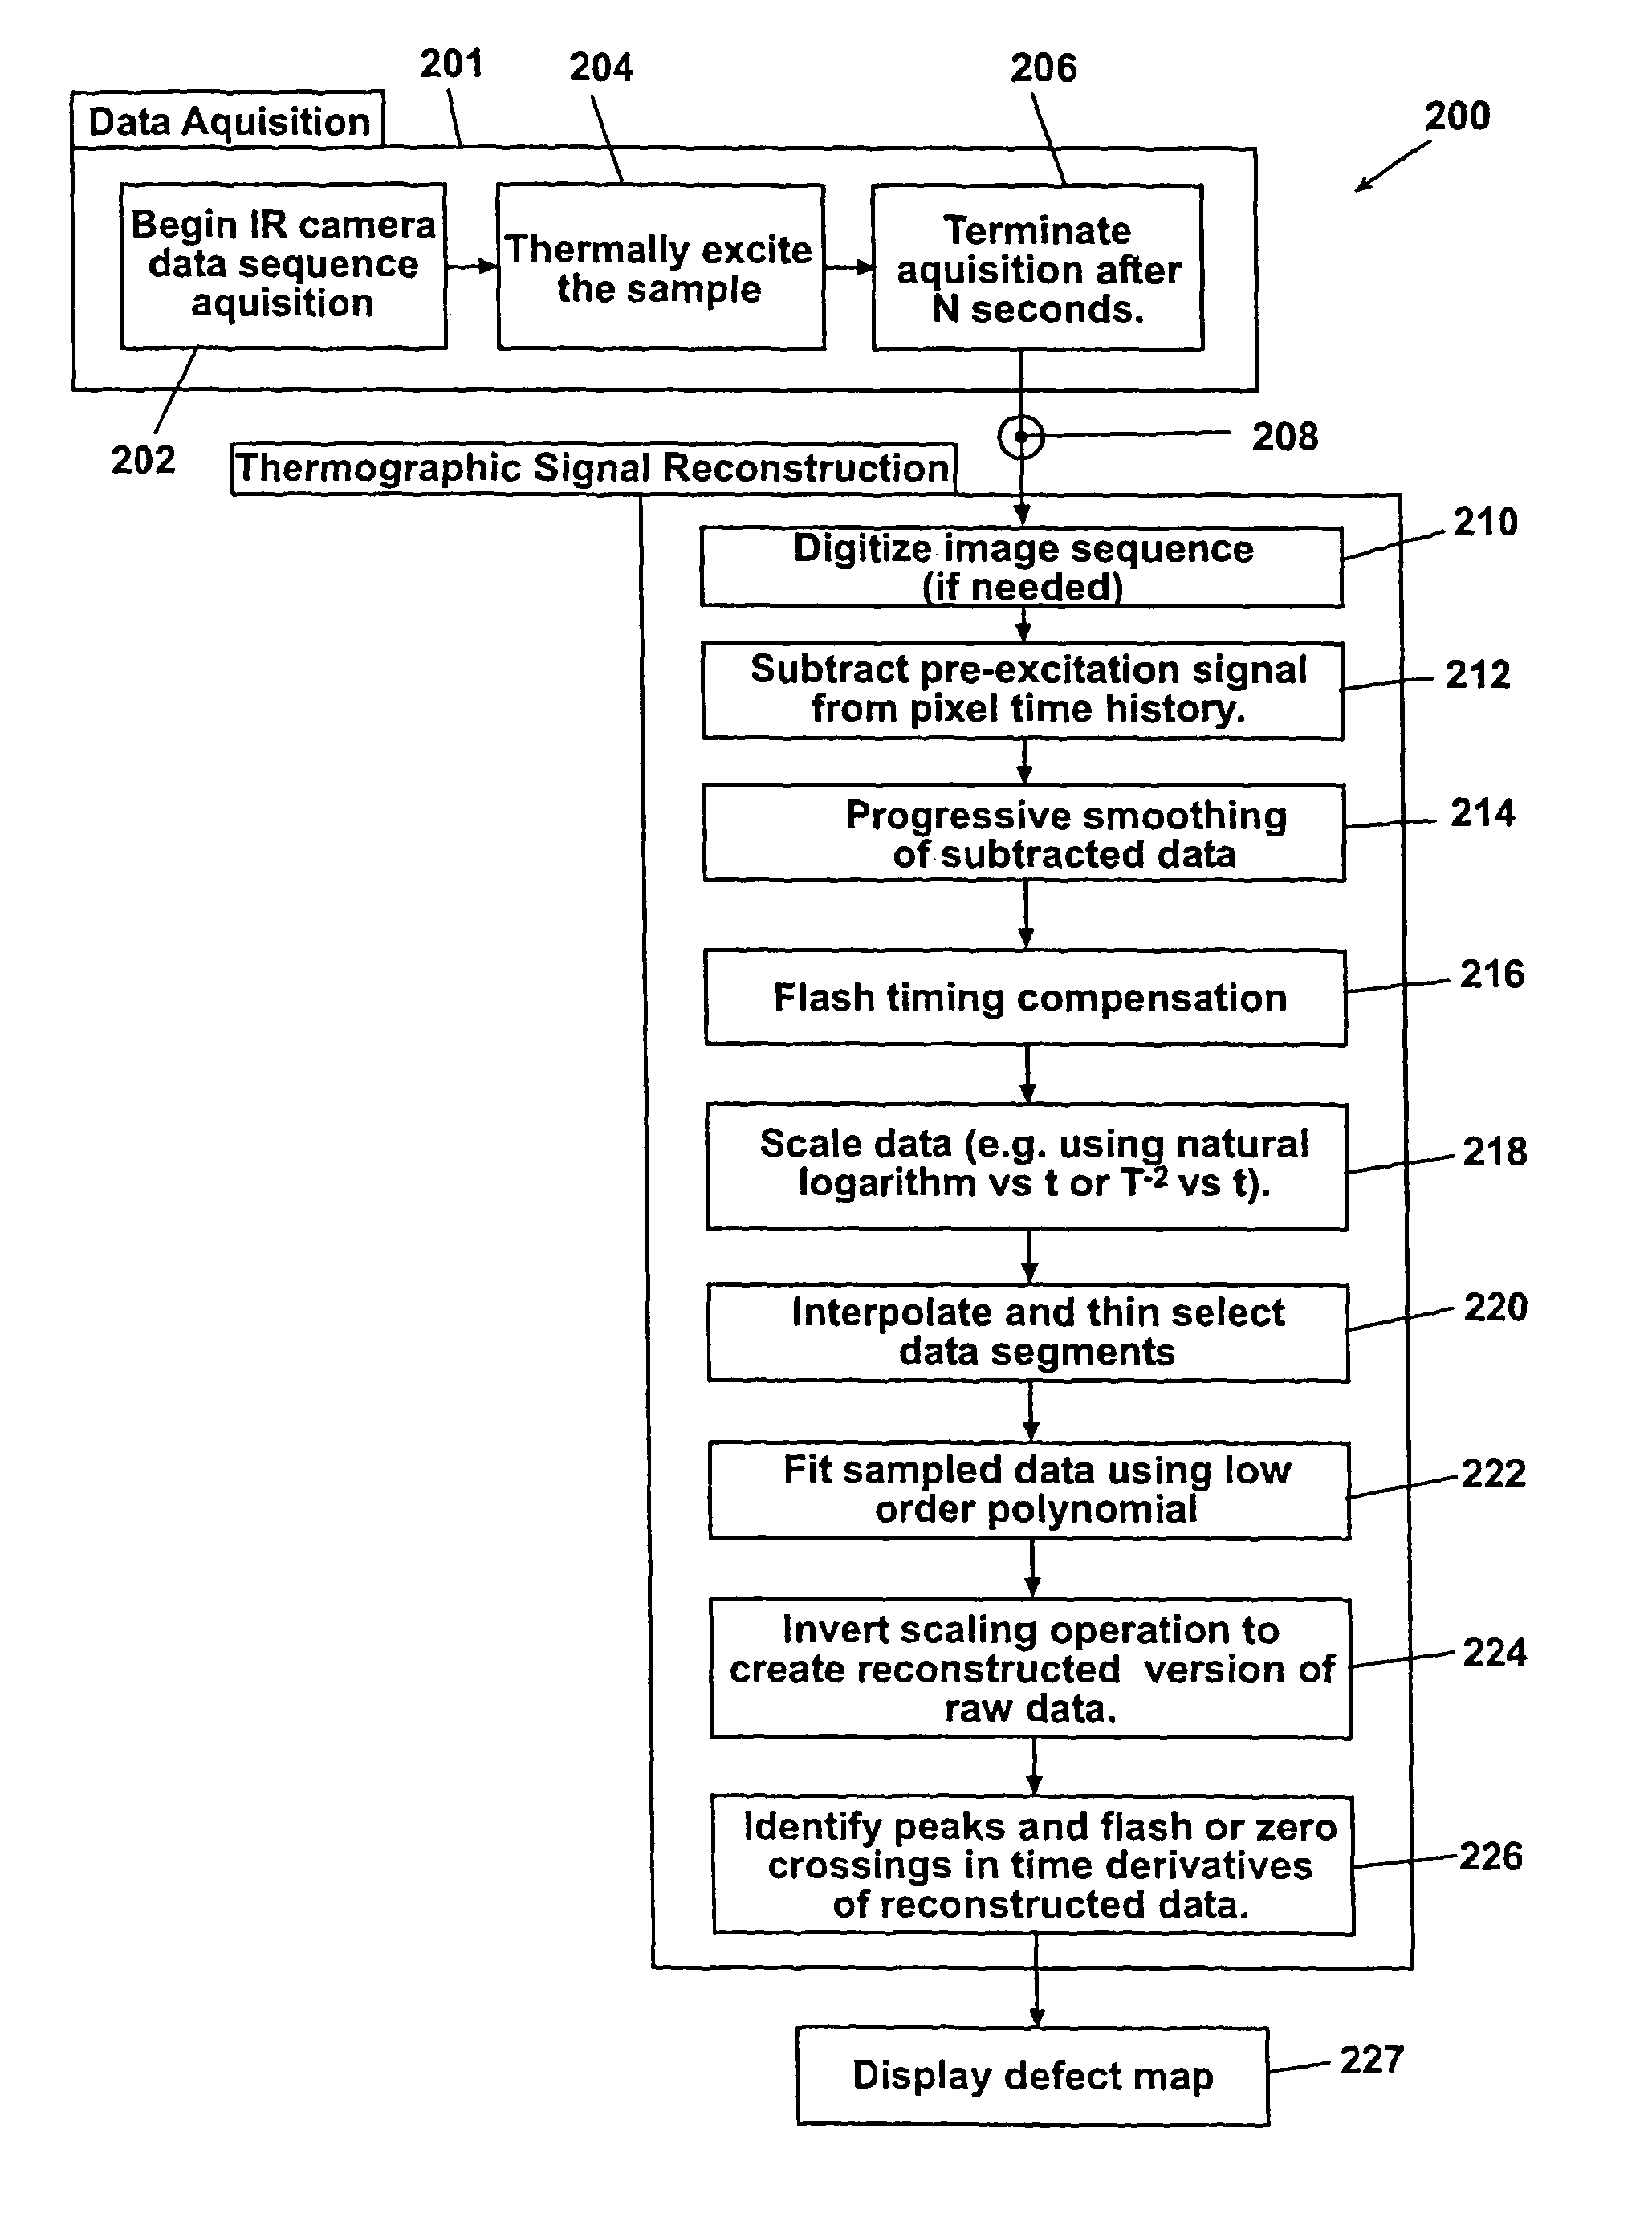
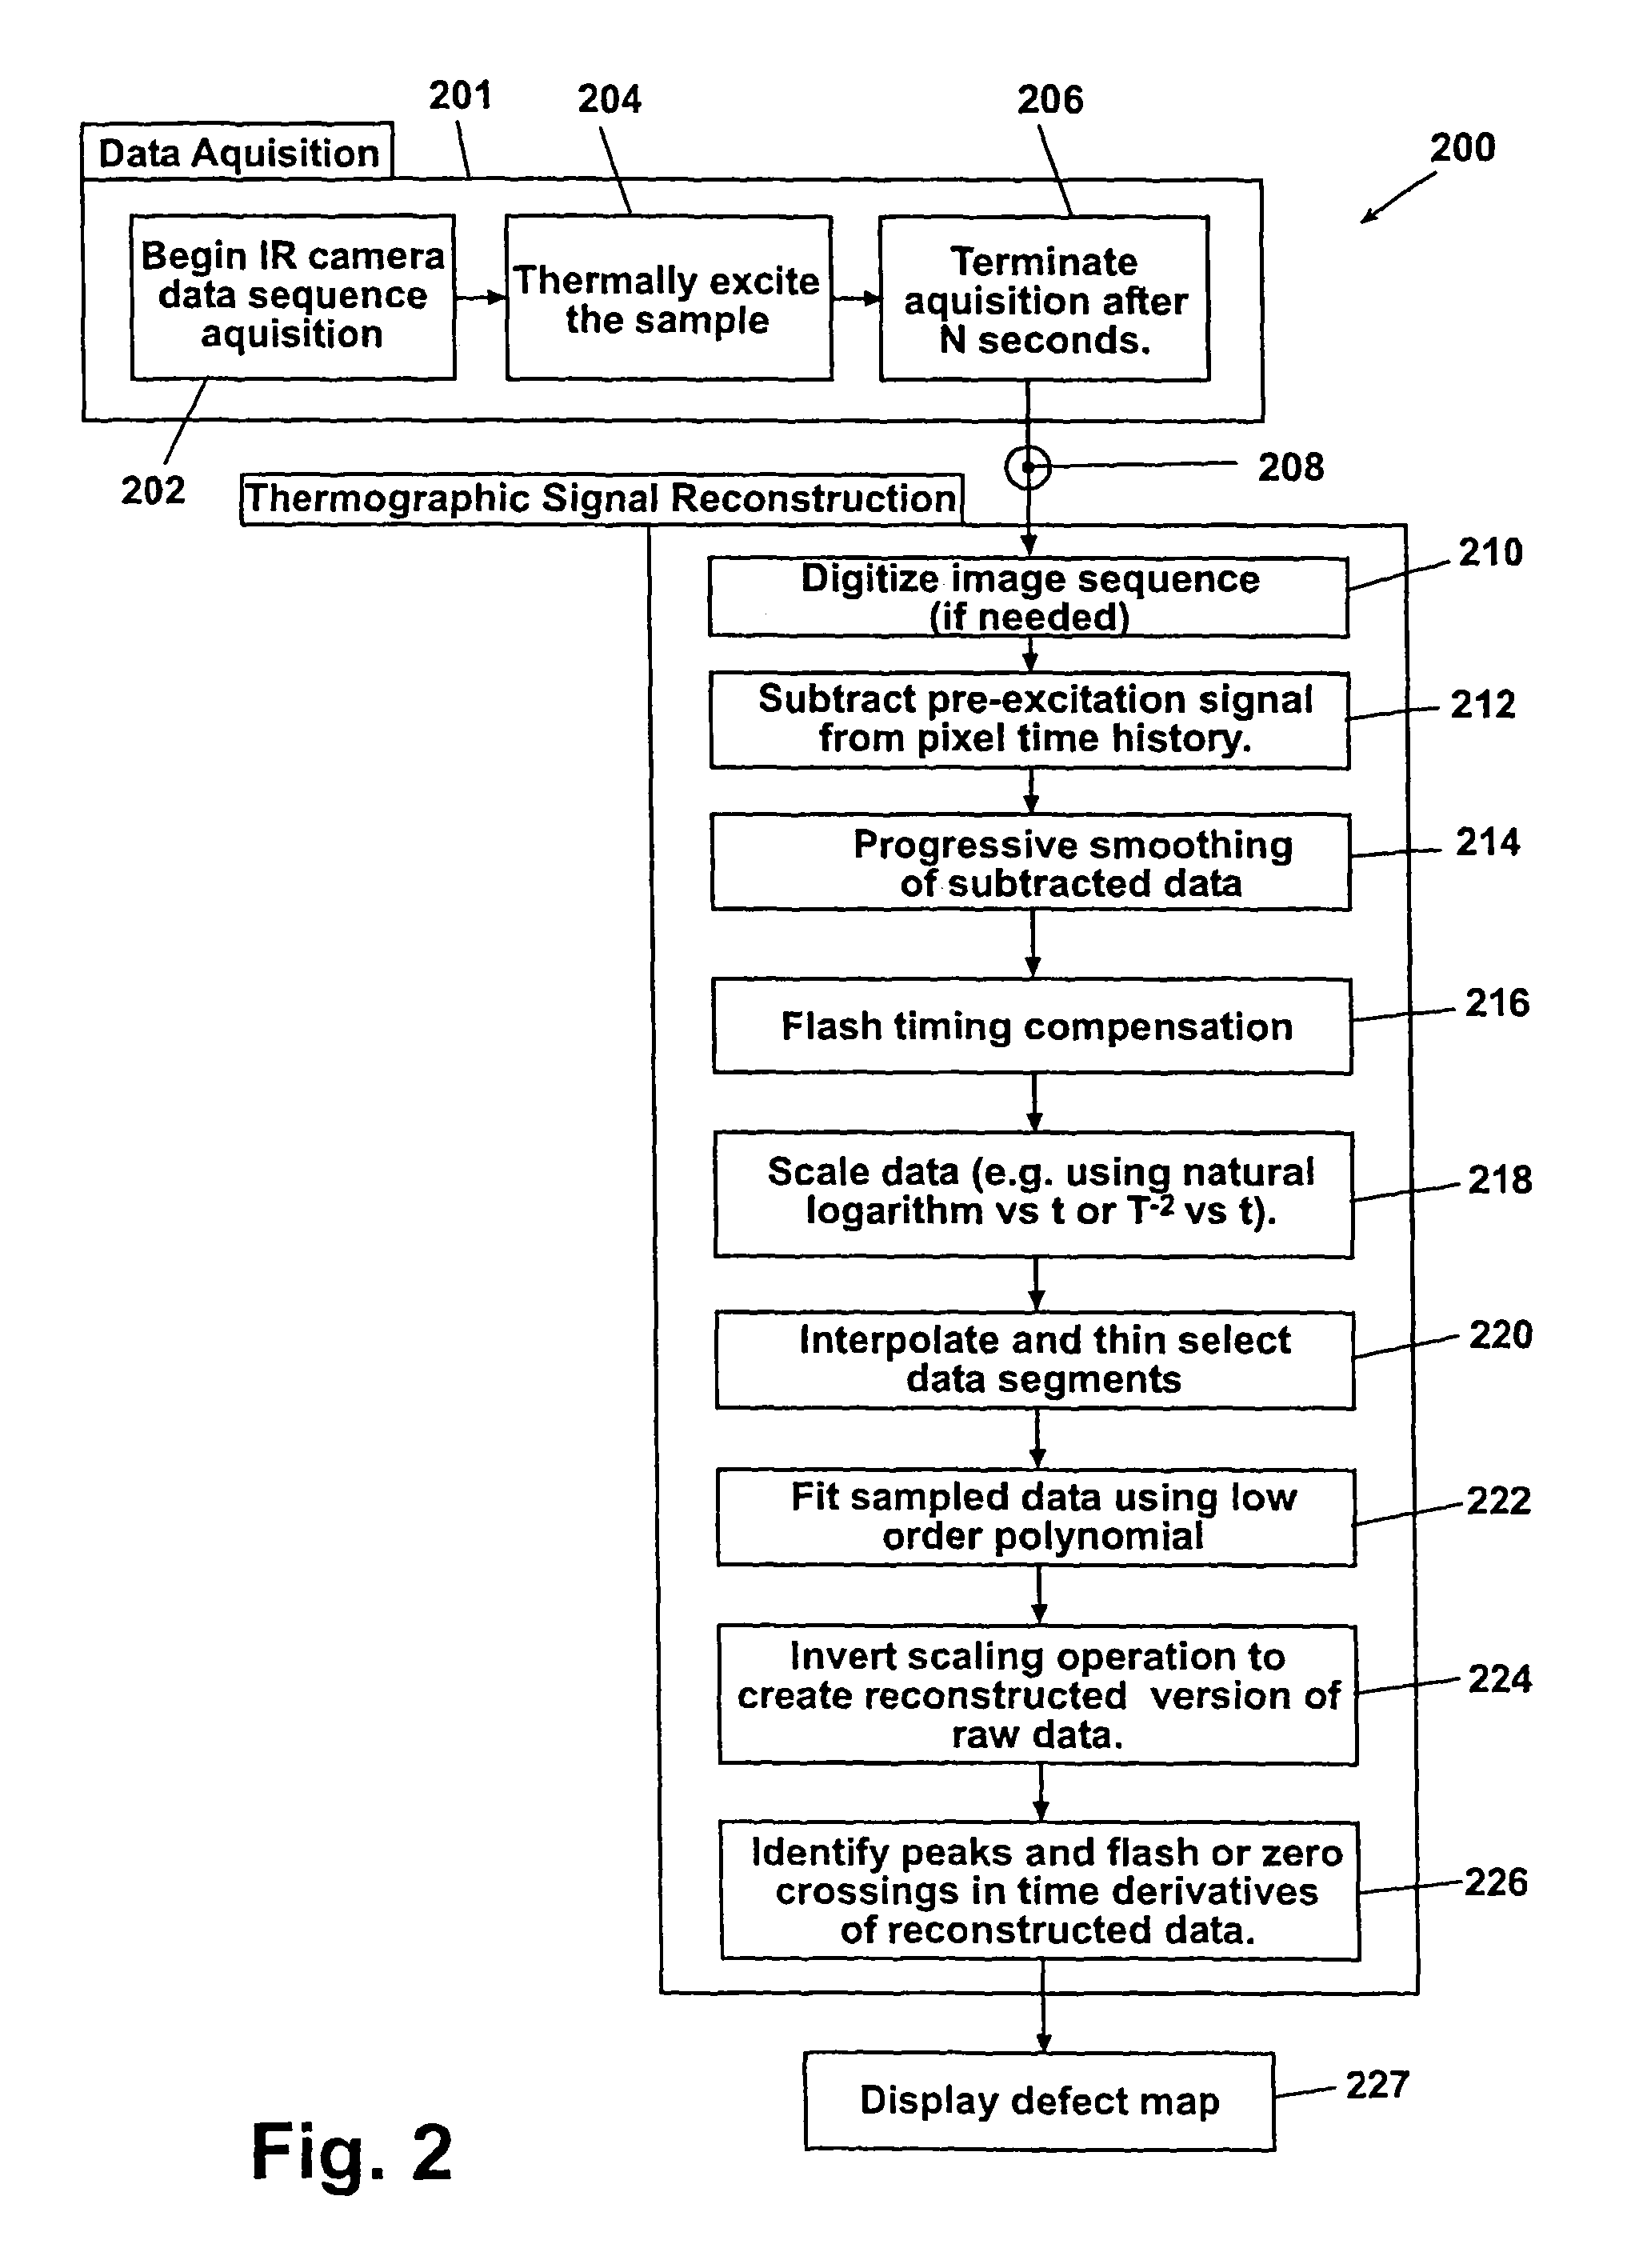
[0106]The system of the present invention operates on a reconstructed representation of the entire temperature-time history of acquired thermographic data rather than the raw thermographic data. This approach is beneficial because:

[0107]A. The reconstructed representation of the temperature-time history of the thermographic data is typically an order of magnitude smaller than the raw thermographic data in terms of the amount of computer memory it requires for storage.

[0108]B. The reconstructed representation of the thermographic data is almost entirely free of temperal noise (typically introduced from the infrared camera) and mechanical instability. There are several possible sources of mechanical instability associated with using infrared cameras. Infrared cameras require cooling to very low temperatures (typically infrared cameras are cooled with liquid nitrogen using a Stirling engine). A Stirling engine employs, amongst other components, a small oscillating piston. Becaus...


PUM

PropertyMeasurementUnit
skin thicknessaaaaaaaaaa
timeaaaaaaaaaa
depthaaaaaaaaaa

Abstract

A method for compiling thermographic data including obtaining data indicative of a monotonically changing characteristic of a specimen, sequencing the data or a surrogate of the data into a plurality of groups, categorizing, within each group, the frequency distribution of an attribute of the data or an attribute of said surrogate data, and compiling, from one or more groups, a collection of two or more of the frequency distributions.

Description

REFERENCE TO RELATED APPLICATIONS[0001]This application is a continuation-in-part of U.S. application Ser. No. 10 / 123,726, filed Apr. 15, 2002, now U.S. Pat. No. 6,751,342 which is a continuation-in-part of U.S. application Ser. No. 09 / 729,617, filed Dec. 4, 2000, now U.S. Pat. No. 6,516,084 which claims the benefit of U.S. Provisional Application No. 60 / 168,556, filed Dec. 2, 1999 and Provisional Application No. 60 / 175,792 filed Jan. 12, 2000. This application also claims the benefit of U.S. Provisional Application No. 60 / 284,649 filed Apr. 18, 2001 and U.S. Provisional Application No. 60 / 283,566 filed Apr. 13, 2001.TECHNICAL FIELD[0002]The present invention generally relates to thermal imaging and more particularly relates to non-destructive detection of defects in a sample using thermographic image data.BACKGROUND OF THE INVENTION[0003]Active thermography is used to nondestructively evaluate samples for sub-surface defects. It is effective for uncovering internal bond discontinui...

Claims


Application Information

Patent Timeline
Patent Type & Authority Patents(United States)
IPC IPC(8): G06K9/00G01N25/72G06F17/30
CPCG01N25/72
Inventor SHEPARD, STEVEN M.
Owner THERMAL WAVE IMAGING INC
Learn More