Micro-pore spectrometer and spectral reconstruction method

A micro-hole and spectrometer technology, applied in the field of spectroscopy, to achieve low price, high diffraction efficiency, and increase the amount of incoming light

Inactive Publication Date: 2018-06-12
XIJING UNIV
View PDF3 Cites 3 Cited by
  • Summary
  • Abstract
  • Description
  • Claims
  • Application Information

AI Technical Summary

Problems solved by technology

Therefore, its limited spectral detection range

Method used


Image

  • Micro-pore spectrometer and spectral reconstruction method
  • Micro-pore spectrometer and spectral reconstruction method
  • Micro-pore spectrometer and spectral reconstruction method

Examples


Embodiment 1

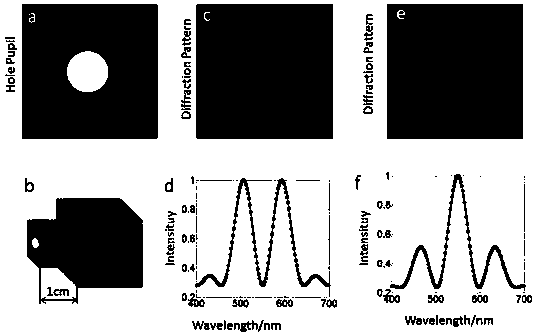
[0039] Embodiment 1 verifies the validity of the present invention when performing spectrum measurement. Utilize the present invention to carry out the measurement result of spectrum measurement such as figure 2 shown. In this real-time example, figure 2 a is the micro-hole in the spectrometer, figure 2 The size of a is 1.024×1.024mm. figure 2 b is the structure diagram of the spectrometer, the distance between the microhole and the CCD in the spectrometer is 1cm. The number of CCD arrays is 256×256 pixels, and the size of each pixel is 4 μm. figure 2 d and figure 2 The solid lines in f represent two spectral curves to be measured. figure 2 c and figure 2 e is the diffraction pattern corresponding to the two spectra to be measured respectively. We have two diffraction patterns ( figure 2 In c and 2e), 300 pixels are respectively selected to construct the equation system. By solving the system of equations, the spectral curves were reconstructed. figure 2 d...

Embodiment 2

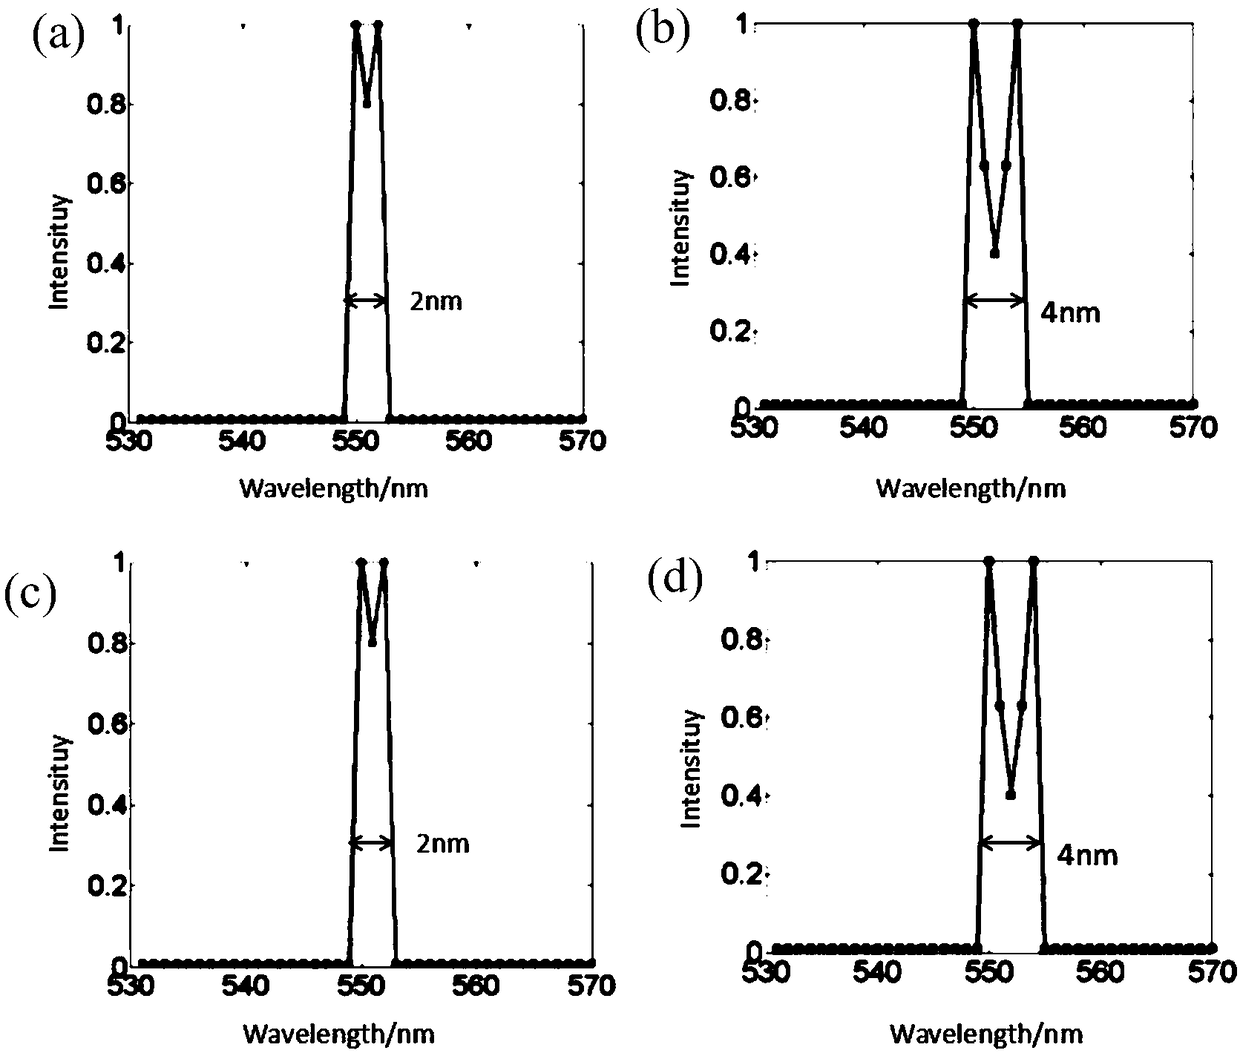
[0041] Example 2 demonstrates the resolution of the spectrometer. Such as image 3 a and image 3 The green line part in b is the two spectra to be measured. The two spectra have a peak at 2nm and 4nm, respectively. Use this spectrum to measure the above two spectra, the measurement results are as follows image 3 c and image 3 shown in d. We can see that the two 2nm and 4nm peaks can be clearly seen in the reconstruction results.

Embodiment 3

[0043] Example 3 demonstrates the anti-noise performance of the reconstruction algorithm of the present invention. In this noise immunity test, the figure 2 The spectrum in a is used as the spectrum to be measured. The diffraction pattern of the spectrum measured in embodiment 3 obtains by following equation simulation:

[0044]

[0045] Here ε rand,i is a random number, which obeys the normal distribution with variance σ=0.1. We are looking at the diffraction pattern figure 2 In c, 360 pixels were selected to construct the equation set to reconstruct the spectrum. When the noise SNR=96db, the reconstructed spectrum agrees very well with the original spectrum (such as Figure 4 shown in a). When SNR=90db, the error between the reconstructed spectrum and the original spectrum is very small (such as Figure 4 shown in b). When SNR=85db, the error of the reconstruction result increases, and the reconstruction result is still good although there are some noises (such ...


PUM


Abstract

The invention provides a micro-pore spectrometer and a spectral reconstruction method. The micro-pore spectrometer is only composed of a light intensity detector and a micro-hole. A to-be-measured spectrum is incident on the micro-hole and is transmitted to the light intensity detector after being diffracted by the micro-hole. The light intensity detector records a corresponding diffraction pattern. After that, the data processing is carried out on the recorded diffraction pattern by using the algorithm provided by the invention, so that the to-be-measured spectrum can be reconstructed accurately. In addition, all spectral components entering the spectrometer can be detected by the detector due to the fact that one part of the micro-hole is completely transparent. Therefore, the micro-porespectrometer has an ultra-wide spectral detection range. The micro-pore spectrometer is simple in structure, extremely low in cost, light in weight, and small in size. The volume of the micro-pore spectrometer can be controlled to be within 1 cm * 1 cm * 1 cm and even smaller. As a result, the micro-pore spectrometer can be widely applied. The micro-pore spectrometer can be loaded on a satellitefor space exploration. The micro-pore spectrometer can also be integrated to a smart phone for pesticide detection, air pollutant detection, water quality monitoring, medical diagnosis and the like.

Description

technical field [0001] The invention relates to the field of spectroscopy, in particular to a microhole spectrometer and a spectral reconstruction method. Background technique [0002] Spectrometers are basic tools in almost all modern scientific fields, such as materials, chemistry, archaeological relics, drug detection, public safety, etc. At present, the most common spectrometers on the market use dispersive elements such as gratings for light splitting. Although this kind of spectrometer can get many precise spectral measurement effects. But various improvements to spectrometers have never stopped, especially the direction of miniaturization, low price, and easy use [Opt.Express 20, 489-507 (2012), Appl. Phys. Lett. Photon.2 161-164(2008), Nature Commun.1,59(2010)]. A spectrometer based on an absorption filter is a very favorable solution for miniaturization. In particular, quantum dot spectrometers have emerged in recent years. Quantum dot spectrometers use quantum...

Claims


Application Information

Patent Timeline
Patent Type & Authority Applications(China)
IPC IPC(8): G01J3/28G01J3/02
Inventor 李拓
Owner XIJING UNIV
Why Eureka
Try Eureka