Microfluidic fluorescence immunoassay chip for rapidly and quantitatively detecting sST2 in whole blood
A quantitative detection, fluorescence immunological technology, applied in the field of immunoassay, can solve the problems of poor sensitivity, linearity, repeatability and quantitative accuracy, repeatability, accuracy and linear range, sensitivity and linear range, etc. Wide, high sensitivity, high sensitivity effect
- Summary
- Abstract
- Description
- Claims
- Application Information
AI Technical Summary
Problems solved by technology
Method used
Image
Examples
Embodiment 1
[0063] Example 1 Composition and preparation of a microfluidic fluorescent immune chip for rapid quantitative detection of sST2 In this implementation example, a microfluidic fluorescent immune chip for rapid quantitative detection of sST2 in whole blood includes a central plate 1 and a bottom plate 9, and the central plate 1 Being of optically transparent material, the bottom plate 9 is located adjacent to the underside of the center plate 1 , the center plate and the bottom plate being joined to each other directly and in a fluid-tight manner by laser welding in the area where they overlap each other around this recess.
[0064] A sample inlet 3 for introducing samples into the chip is provided on one side of the surface of the center plate. The sample inlet is closed in a pressure-tight manner, and enters the first sample mixing area sequentially from the sample inlet 3 through the flow channel. 4. The tracer area and the second sample mixing area, the two sample mixing area...
Embodiment 2
[0088] Example 2 Rapid Quantitative Detection of sST2 Microfluidic Fluorescent Immunochip Drawing Standard Curve Determination and Information Storage
[0089] Take the chip out of storage conditions and equilibrate to room temperature before testing;
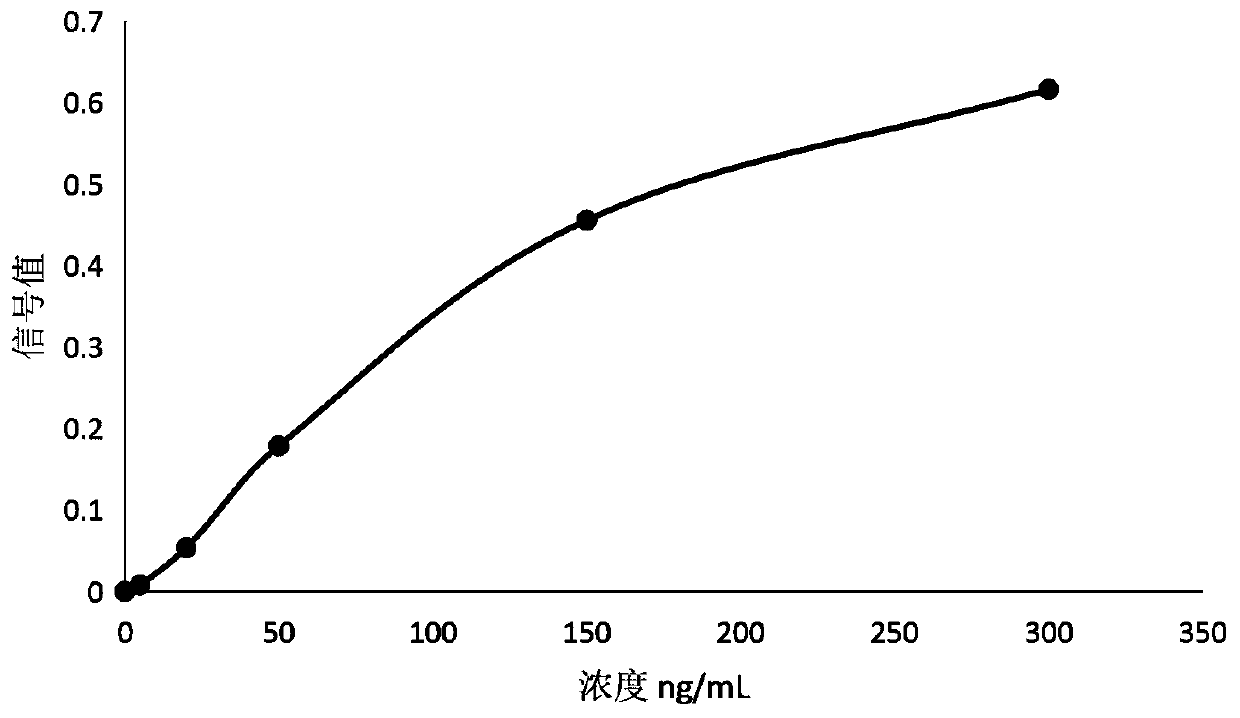
[0090] Step 1. Prepare sST2 calibrator with diluent, the concentration is: 0, 5, 20, 50, 150, 300ng / mL
[0091] Step 2. Take 50 μL of the calibrator and add it to the sample inlet of the microfluidic chip. Before each sampling, the pipette head needs to be replaced to avoid cross-contamination. After 10 minutes, read the system detection signal through ResponseIQ. The concentration was detected twice, and the signal value measurement results of the calibrator solution series are shown in Table 1. The regression curve of the calibrator dose-signal value was obtained by four-parameter logic fitting, as shown in Table 1. image 3 shown.
[0092] Table 1
[0093]
Embodiment 3
[0094] Example 3 Methodological Verification of Microfluidic Fluorescent Immunochip for Rapid Quantitative Detection of sST2
[0095] The chip in embodiment 1 is verified according to the conventional manufacturing and verification procedures in the art, and the results are as follows:
[0096] 1. Chip precision measurement
[0097] 1.1 Intra-batch precision analysis
[0098] A batch of chips in Example 1 was used to measure high and low concentration quality control solution series respectively, and 10 chips were measured in parallel, and the intra-assay coefficients of variation were respectively 3.21% and 2.09%. The results are shown in Table 2.
[0099] Table 2
[0100] Target value (ng / mL) Measurement times Intra-analytical CV(%) 30 10 3.21 150 10 2.09
[0101] 1.2 Batch-to-batch precision analysis
[0102] The chips in Example 1 are taken in three batches, and each batch of chips is measured for high and low concentration quality control...
PUM
| Property | Measurement | Unit |
|---|---|---|
| wavelength | aaaaa | aaaaa |
| volume | aaaaa | aaaaa |
| volume | aaaaa | aaaaa |
Abstract
Description
Claims
Application Information
 - R&D
- Intellectual Property
- Life Sciences
- Materials
- Tech Scout
- Unparalleled Data Quality
- Higher Quality Content
- 60% Fewer Hallucinations
Browse by: Latest US Patents, China's latest patents, Technical Efficacy Thesaurus, Application Domain, Technology Topic, Popular Technical Reports.
© 2025 PatSnap. All rights reserved.Legal|Privacy policy|Modern Slavery Act Transparency Statement|Sitemap|About US| Contact US: help@patsnap.com


