Method of and system for multiplexed analysis by spectral imaging
a technology of spectral imaging and multiplexing, applied in the field of multiplexing analysis by spectral imaging, can solve the problems of limited capabilities, increasing the number of microtiter plates screened per day, and limited methods intrinsically limited
- Summary
- Abstract
- Description
- Claims
- Application Information
AI Technical Summary
Problems solved by technology
Method used
Image
Examples
example 1
[0338] This example demonstrates a preparation of a sample for spectral imaging, in accordance with the present invention.
[0339] Vials containing reagents as described herein were assembled:
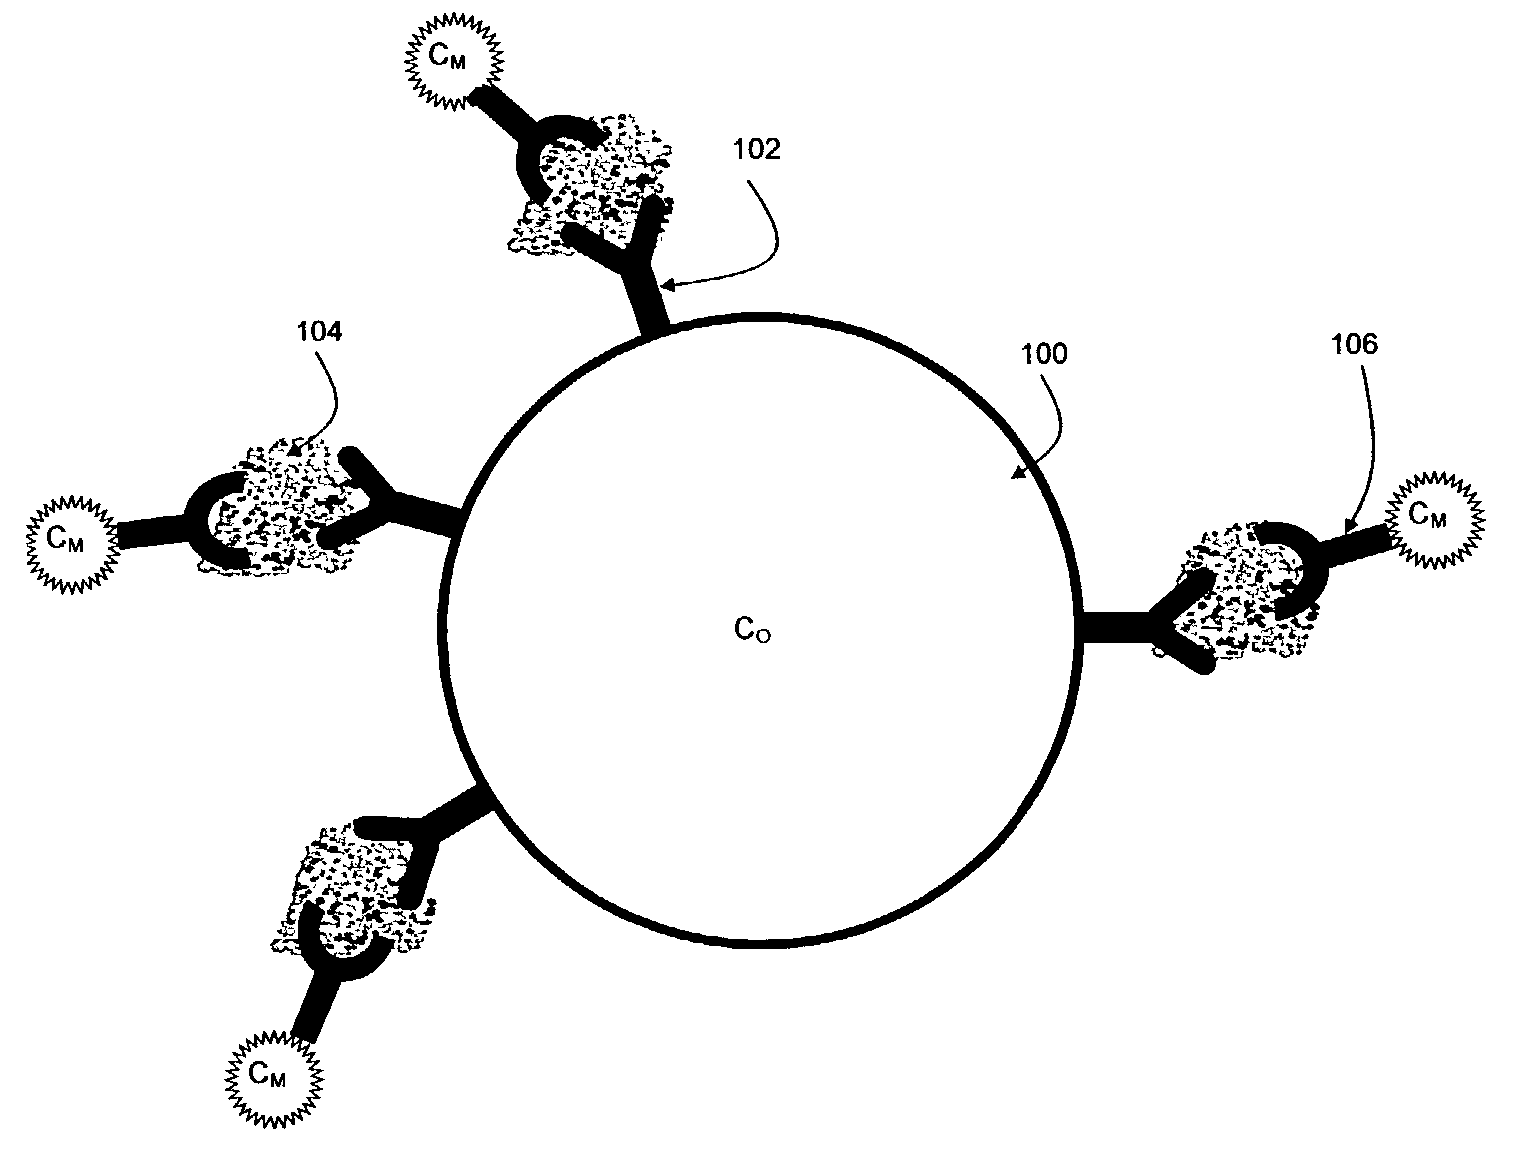
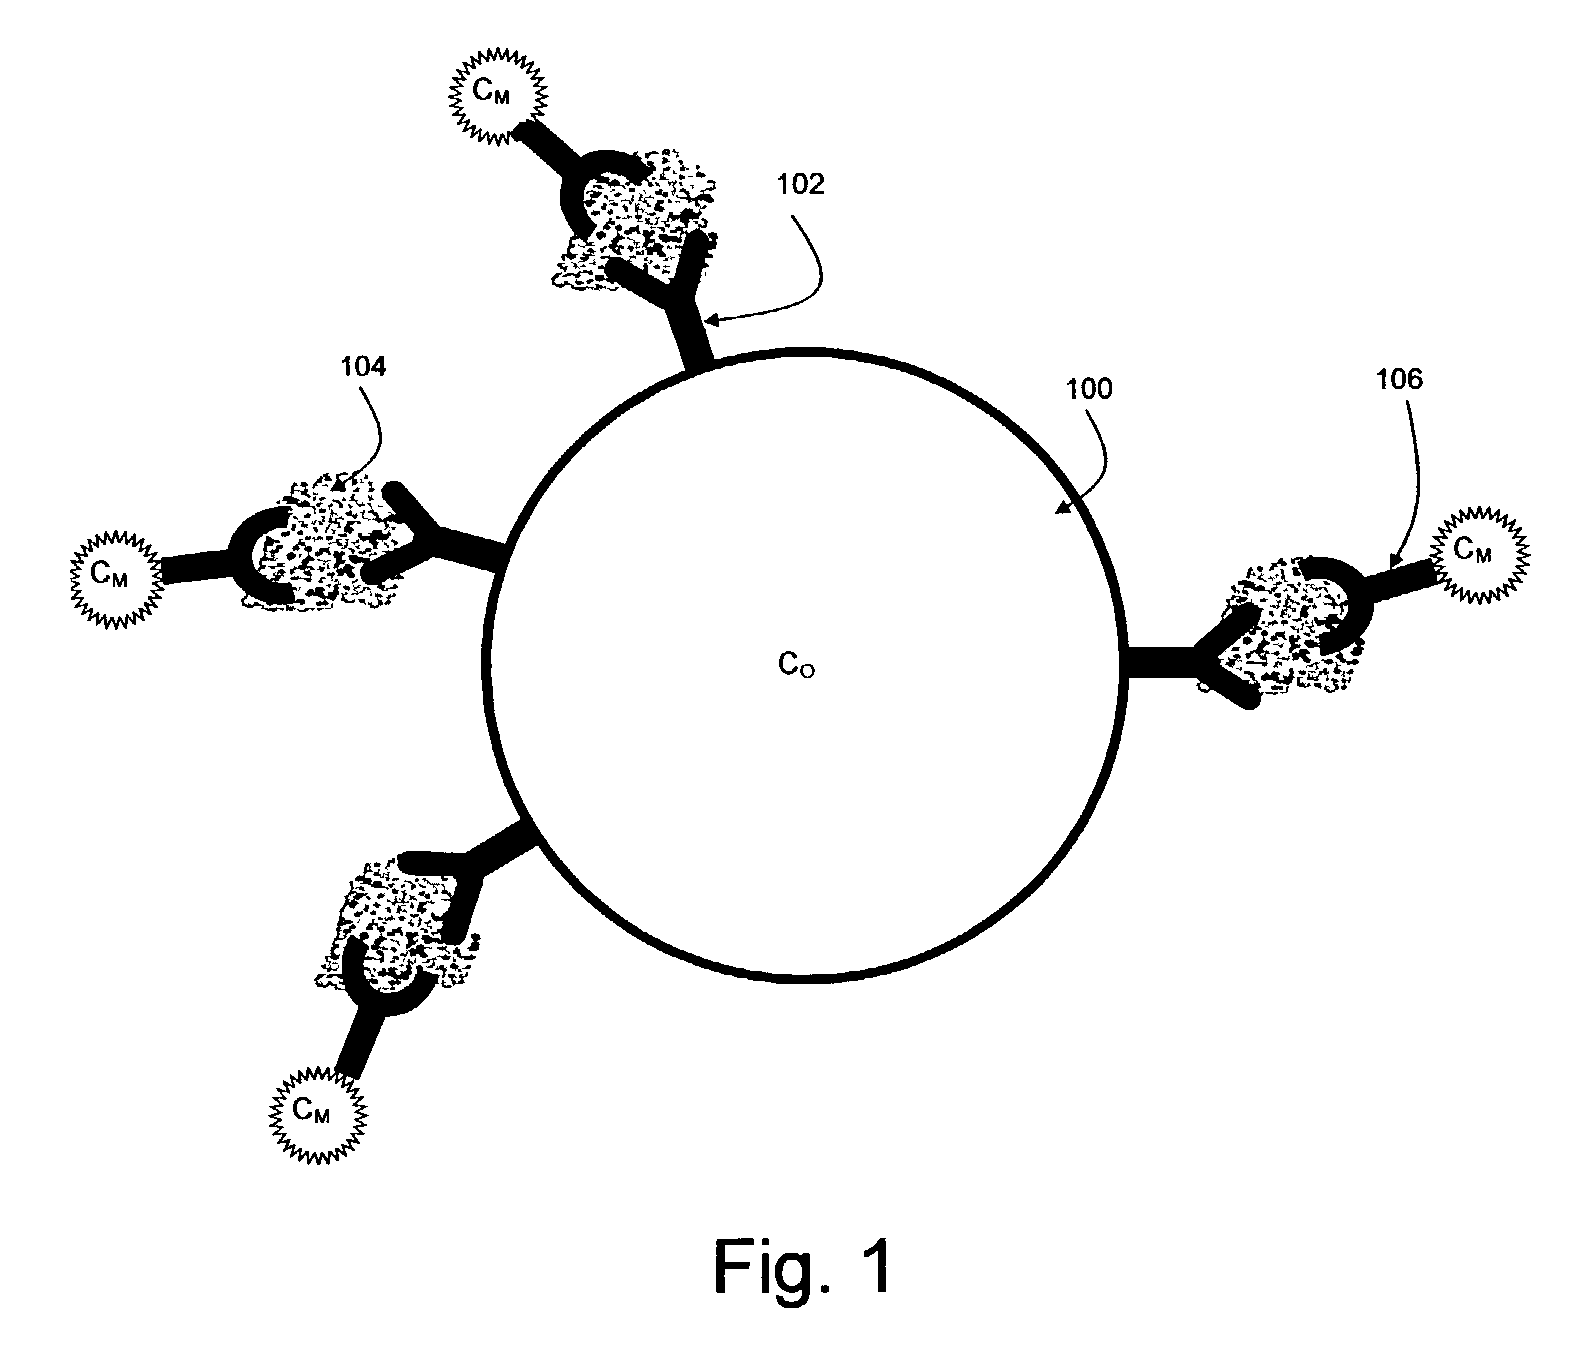
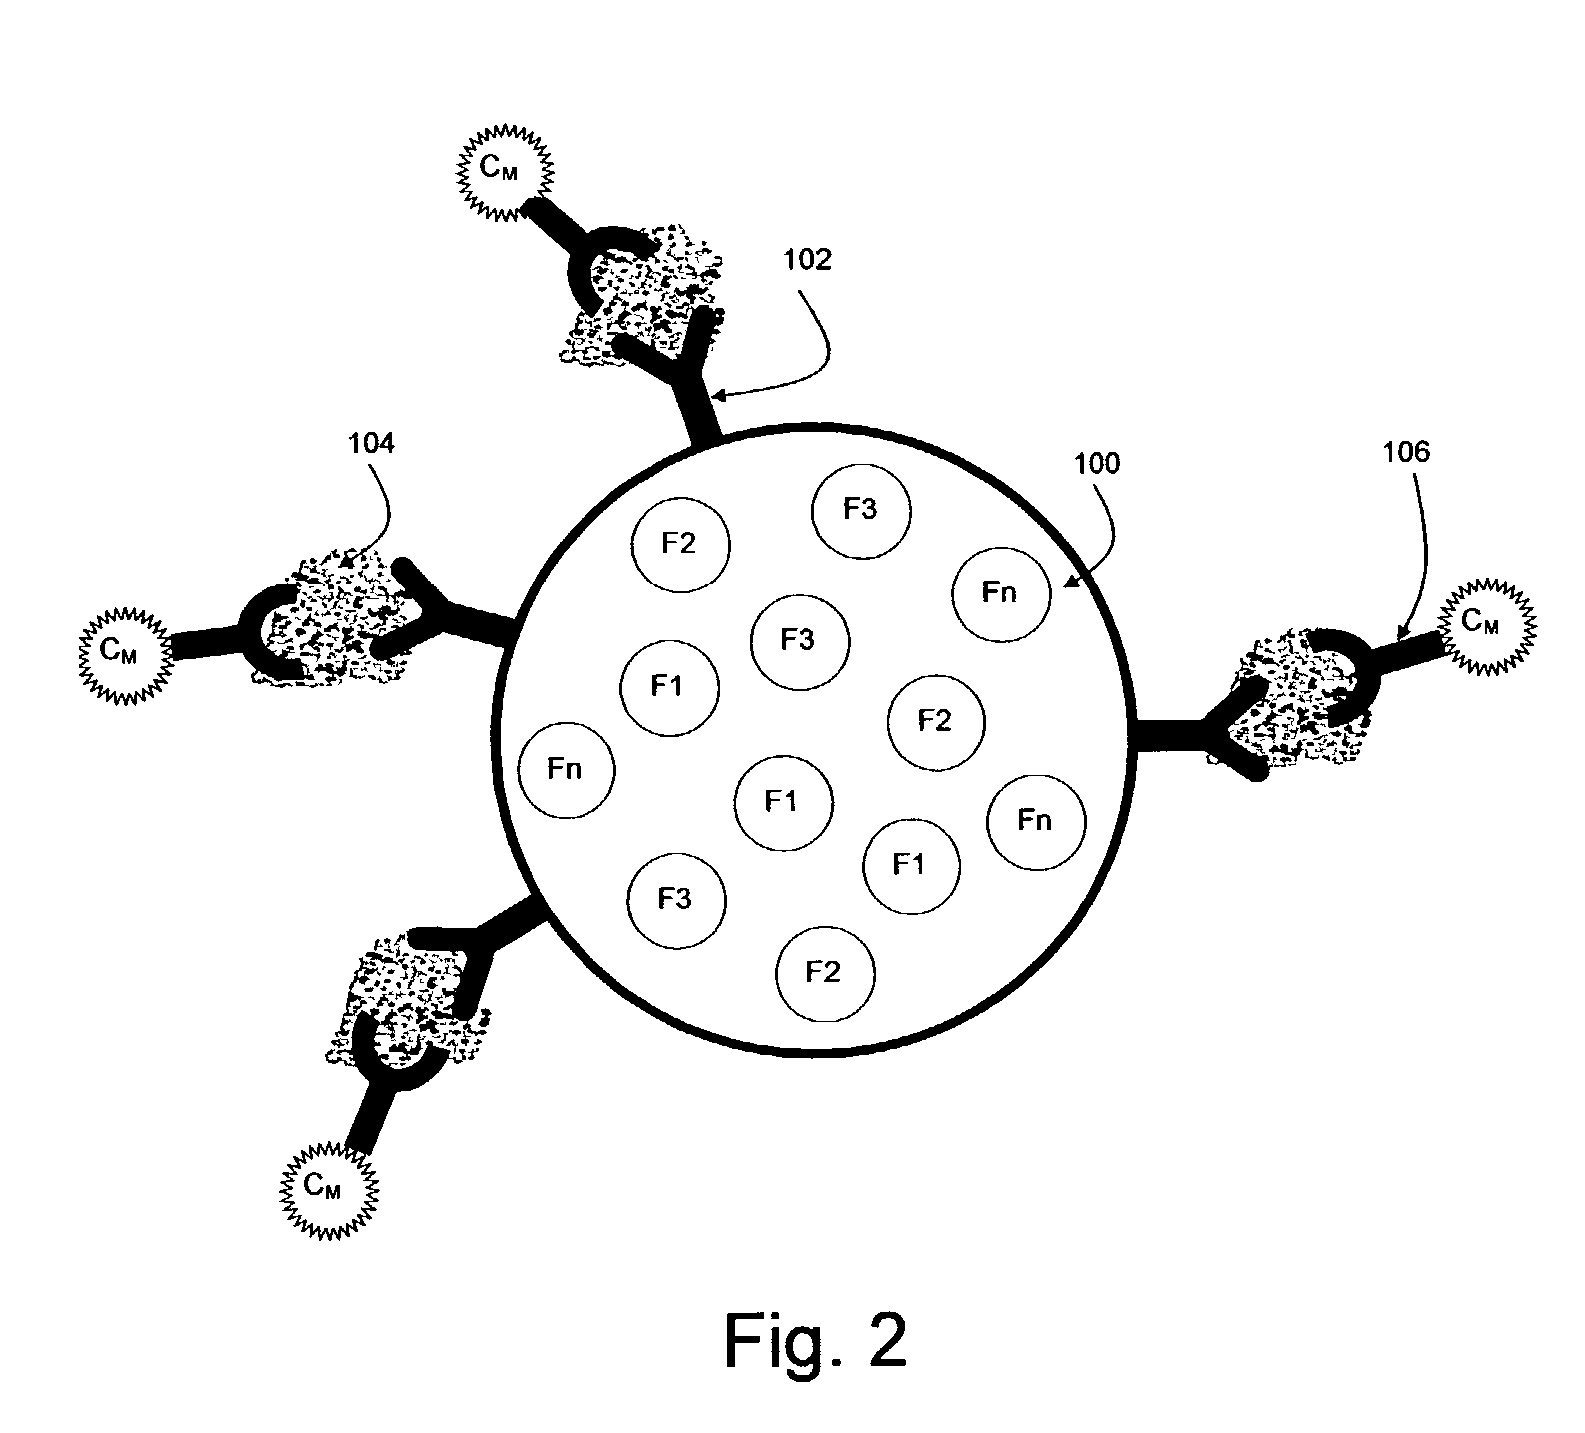
[0340] 1. Anti-cytokine conjugated beads: a mix of 8 bead classes, each having its own color and intensity and a different antibody for a different cytokine. This vial is further referred to as vial 1.
[0341] 2. Cytokine detection antibody diluted in buffer A (see below). This antibody is cross-reactive with all cytokines. This vial is further referred to below as vial 2.
[0342] 3. Reporter: Streptvidin-Phycoerythrin diluted in distilled water. This vial is further referred to below as vial 3.
[0343] The following buffers were prepared:
[0344] 1. Buffer A: 4.times.SSC.
[0345] 2. Wash Buffer: 4.times.SSC / 0.1% TWEEN 20.
[0346] In addition, a titer plate specially design for vacuum filtration through a low fluorescent membrane was used.
[0347] The reaction steps:
[0348] 1. A multiple-beads stock was prepare...
example 2
[0355] This example demonstrates a spectral image for multi-spectrally labeled beads. The spectral image was measured with an interferometer-based spectral imaging system. The beads were manufactured and stained by Sperotech Inc. (Libertyville Ill, USA). About 5500 beads of 5 .mu.m in diameter were simultaneously imaged. The beads were classified into 4 different populations each population was spectrally labeled with a different fluorochrome: SKY Blue, Flash Red, Sun Coast and Nile Blue.
[0356] The spectral resolution of the measurement was a full width at half maximum (FWHM) of 15 nm at 500 nm (the FWHM varies with wavelength because with a Fourier-based spectrometer the spectral resolution is constant in the energy or wavenumber domain and it varies in the wavelength domain).
[0357] The CCD had 1280.times.1024 pixels, each one having an effective size of 6.7 .mu.m.times.6.7 .mu.m, and the system was used with a fore-optics that provides an effective magnification of 10 folds. The s...
example 3
[0363] FIG. 10 shows spectra of 10 different beads which were labeled using a combinatorial labeling approach, and were analyzed using spectral imaging similar to as described under Example 2 above.
[0364] As in the previous example the spectra shown in FIG. 10 are indistinguishable to the naked eye. Although the spectra are complex, the spectral analysis of it provides a well-defined identification of each one of the spectral-coded beads.
PUM
| Property | Measurement | Unit |
|---|---|---|
| OD | aaaaa | aaaaa |
| emission wavelengths | aaaaa | aaaaa |
| emission wavelengths | aaaaa | aaaaa |
Abstract
Description
Claims
Application Information
 - R&D
- Intellectual Property
- Life Sciences
- Materials
- Tech Scout
- Unparalleled Data Quality
- Higher Quality Content
- 60% Fewer Hallucinations
Browse by: Latest US Patents, China's latest patents, Technical Efficacy Thesaurus, Application Domain, Technology Topic, Popular Technical Reports.
© 2025 PatSnap. All rights reserved.Legal|Privacy policy|Modern Slavery Act Transparency Statement|Sitemap|About US| Contact US: help@patsnap.com


