
Method and apparatus for monitoring particles in a flowing gas

a technology of airborne particles and flow gas, which is applied in the direction of particle and sedimentation analysis, measurement devices, instruments, etc., can solve the problems of reducing visibility, creating haze and smog, and soiling of textiles and building materials, and achieves simple design and low construction cost.

Inactive Publication Date: 2005-03-10
MRIGLOBAL
View PDF19 Cites 17 Cited by
  • Summary
  • Abstract
  • Description
  • Claims
  • Application Information

AI Technical Summary

Benefits of technology

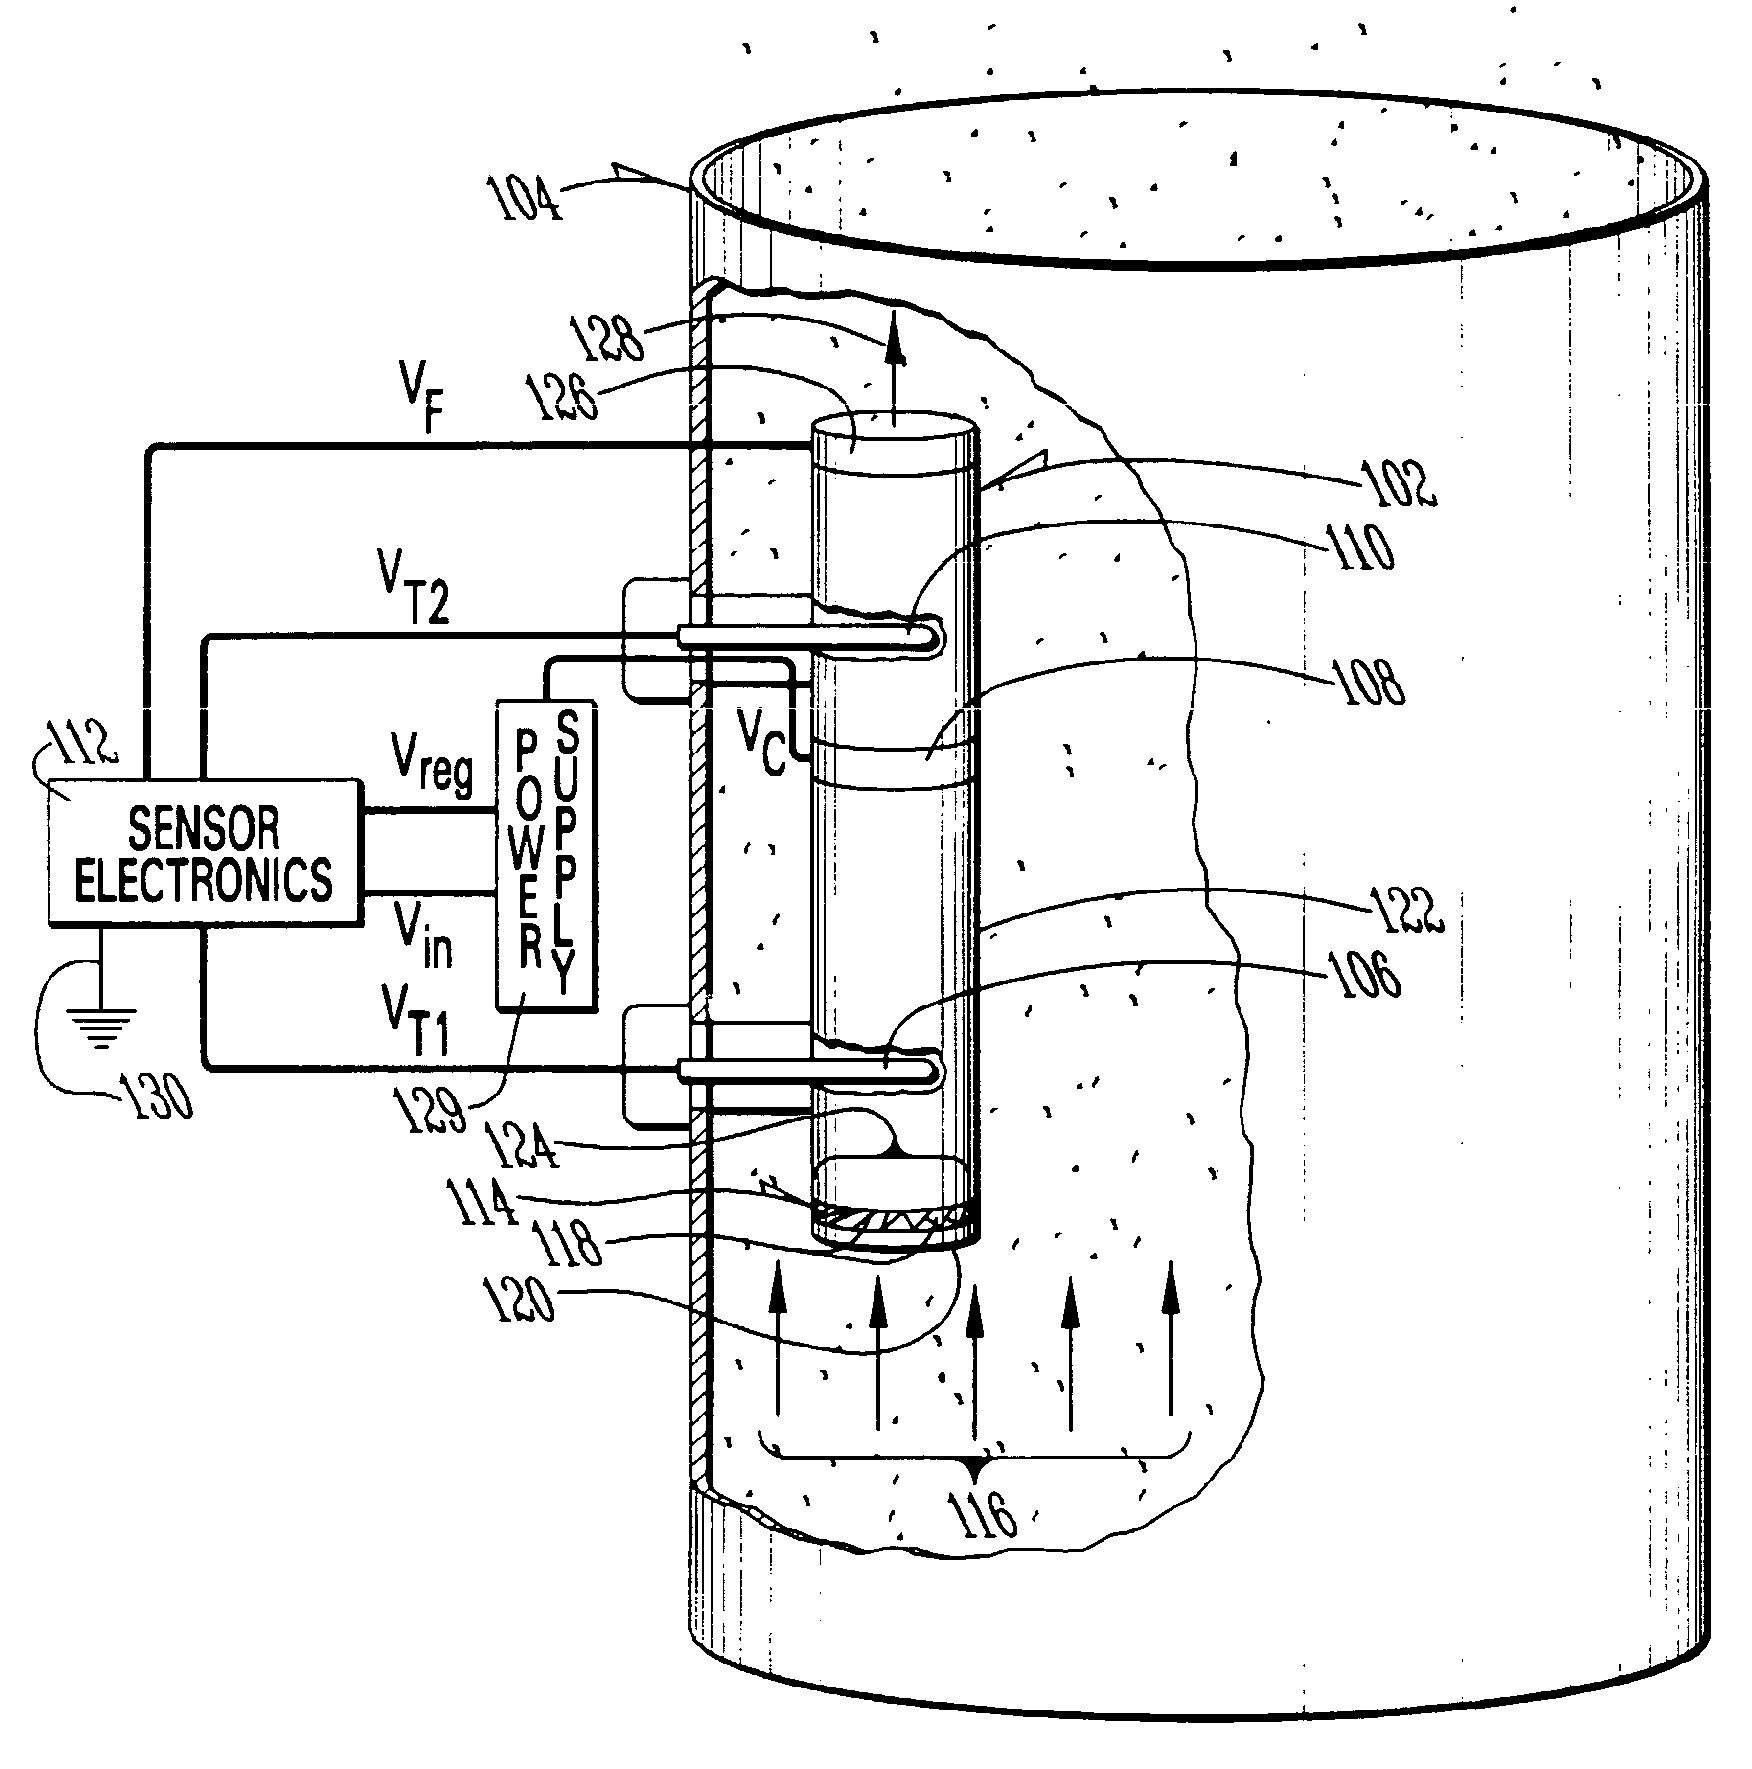
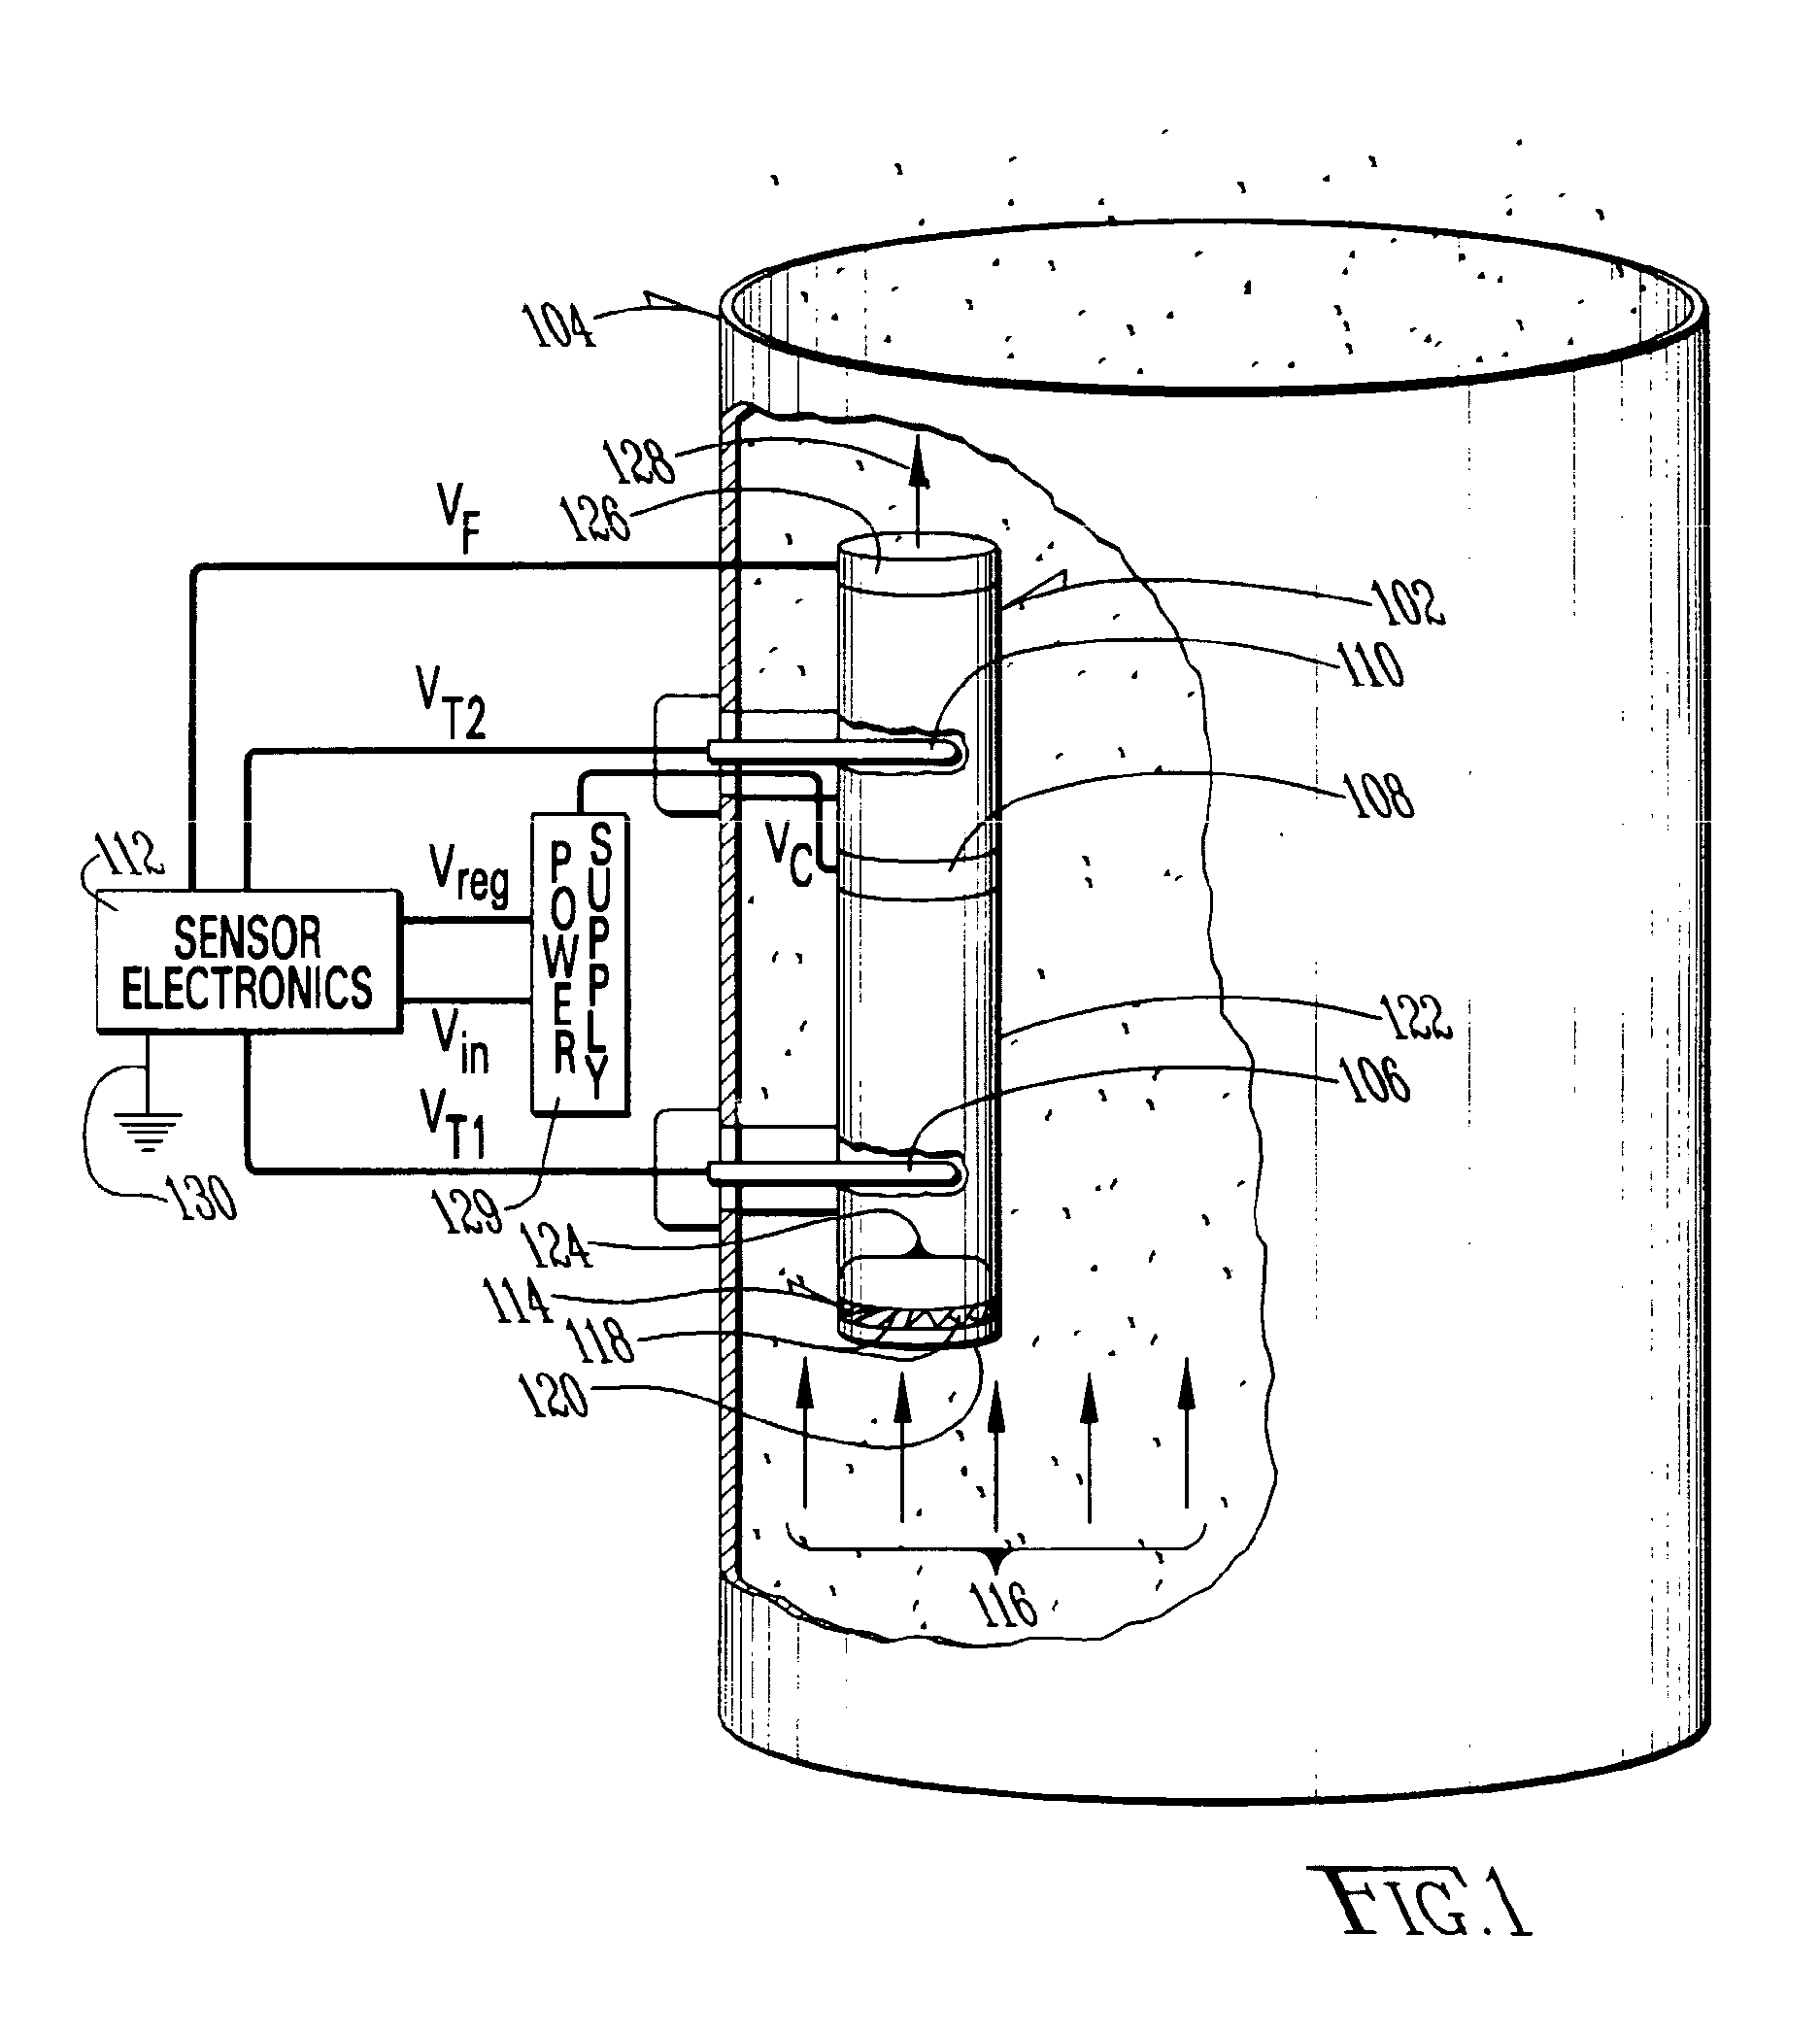
A monitoring system overcomes the problems outlined above and advances the art by providing method and apparatus for monitoring specified size fractions of particulate matter in a gas, for example the mass of particles smaller than 2.5 microns. The monitoring system is relatively inexpensive to build and maintain, has a simple design with no moving parts, and can provide measurements in ducts or stacks with flowing gas.

Problems solved by technology

When these particles combine with water vapor at high humidity they may, for example, create haze and smog.
In addition to reducing visibility and causing respiratory problems, cancer, and heart attacks, airborne particulates can cause corrosion of metals and electrical equipment, as well as soiling of textiles and building materials.
To date, there is limited knowledge about the physical or chemical property of particulate matter that is responsible for these health effects.
However, gravimetric methods are not sensitive enough to measure samples collected in short periods needed to provide a continuous measurement.
Although this method is highly sensitive, measurements are subject to a number of interferences.
This problem is more pronounced for PM2.5, which includes unstable compounds such as ammonium nitrate and carbonaceous aerosols.
For areas such as California and large urban environments, this method may significantly underestimate particle mass concentrations.
Due to the sensitivity of the method, these phenomena can cause either negative or positive artifacts.
The gains and losses of mass on the filter are a serious problem, not just of the TEOM, but of any method that collects particles on a filter over a prolonged period of time, for example, over a period of days.
Finally, this method presents oscillations or noise in its response.
The noise cancels out if a large number of measurements are added to determine a multi-hour concentration estimate; however, over shorter time intervals the measurement errors due to this oscillation can exceed 20-30%.
To date, there is no adequate monitoring technique that determines the size distribution of particles based on mass on a continuous basis.
First, the relationship between frequency and mass becomes non-linear for high particulate loadings.
Second, since the quartz disk collects particles by impaction, the instrument response depends upon the sharpness of collection efficiency, for example, as affected by the extent of particle bounce and internal particle losses.
Finally, carbonaceous aerosol particles, which are composed of long stable chains of very small primary particles, cannot be determined with piezobalances.
One limitation is the dependence of the instrument's response on the particle refractive index.
In addition, the art confronts instrument sensitivity problems requiring complex solutions when ambient air contains particles that are larger and smaller than about 0.2 to 0.3 microns, for example, as reported in U.S. Pat. No. 5,835,211 issued to Wells et al.
This technology is limited to measuring aerosols in the size range 0.01-0.5 microns.
Since the density of particles varies significantly (in the range of + / −30% of the mean value), and since mass concentration is directly proportional to the density, large uncertainties can result from using these methods to determine particle mass concentrations as a function of size.
Second, these techniques require conversion of the size distribution, by number, to a corresponding volume size distribution.
Counting errors are substantial for large particles, due to their relatively low number concentrations combined with electronic noise in the instrumentation.
There are significant uncertainties in volume and, consequently, mass as a function of particle size.
Finally, these instruments are very expensive, costing for example up to $100,000 for the combined optical / electrical counter.
There are also relatively high maintenance costs, so these devices are generally unsuited for large-scale field studies.
However, this method is limited to the measurement of the mass of ambient fine particles, generally, less than about 2.5 microns in diameter.
Other particle counters are known, but generally fail to overcome the aforementioned problems of high cost, accuracy and sensitivity.
These devices have, with varying degrees of success, continuously monitored total particulate, but have not been used to measure specific size fractions.

Method used


Image

  • Method and apparatus for monitoring particles in a flowing gas
  • Method and apparatus for monitoring particles in a flowing gas
  • Method and apparatus for monitoring particles in a flowing gas

Examples


example 1

Calibration for Leak Emission Rate Apparatus

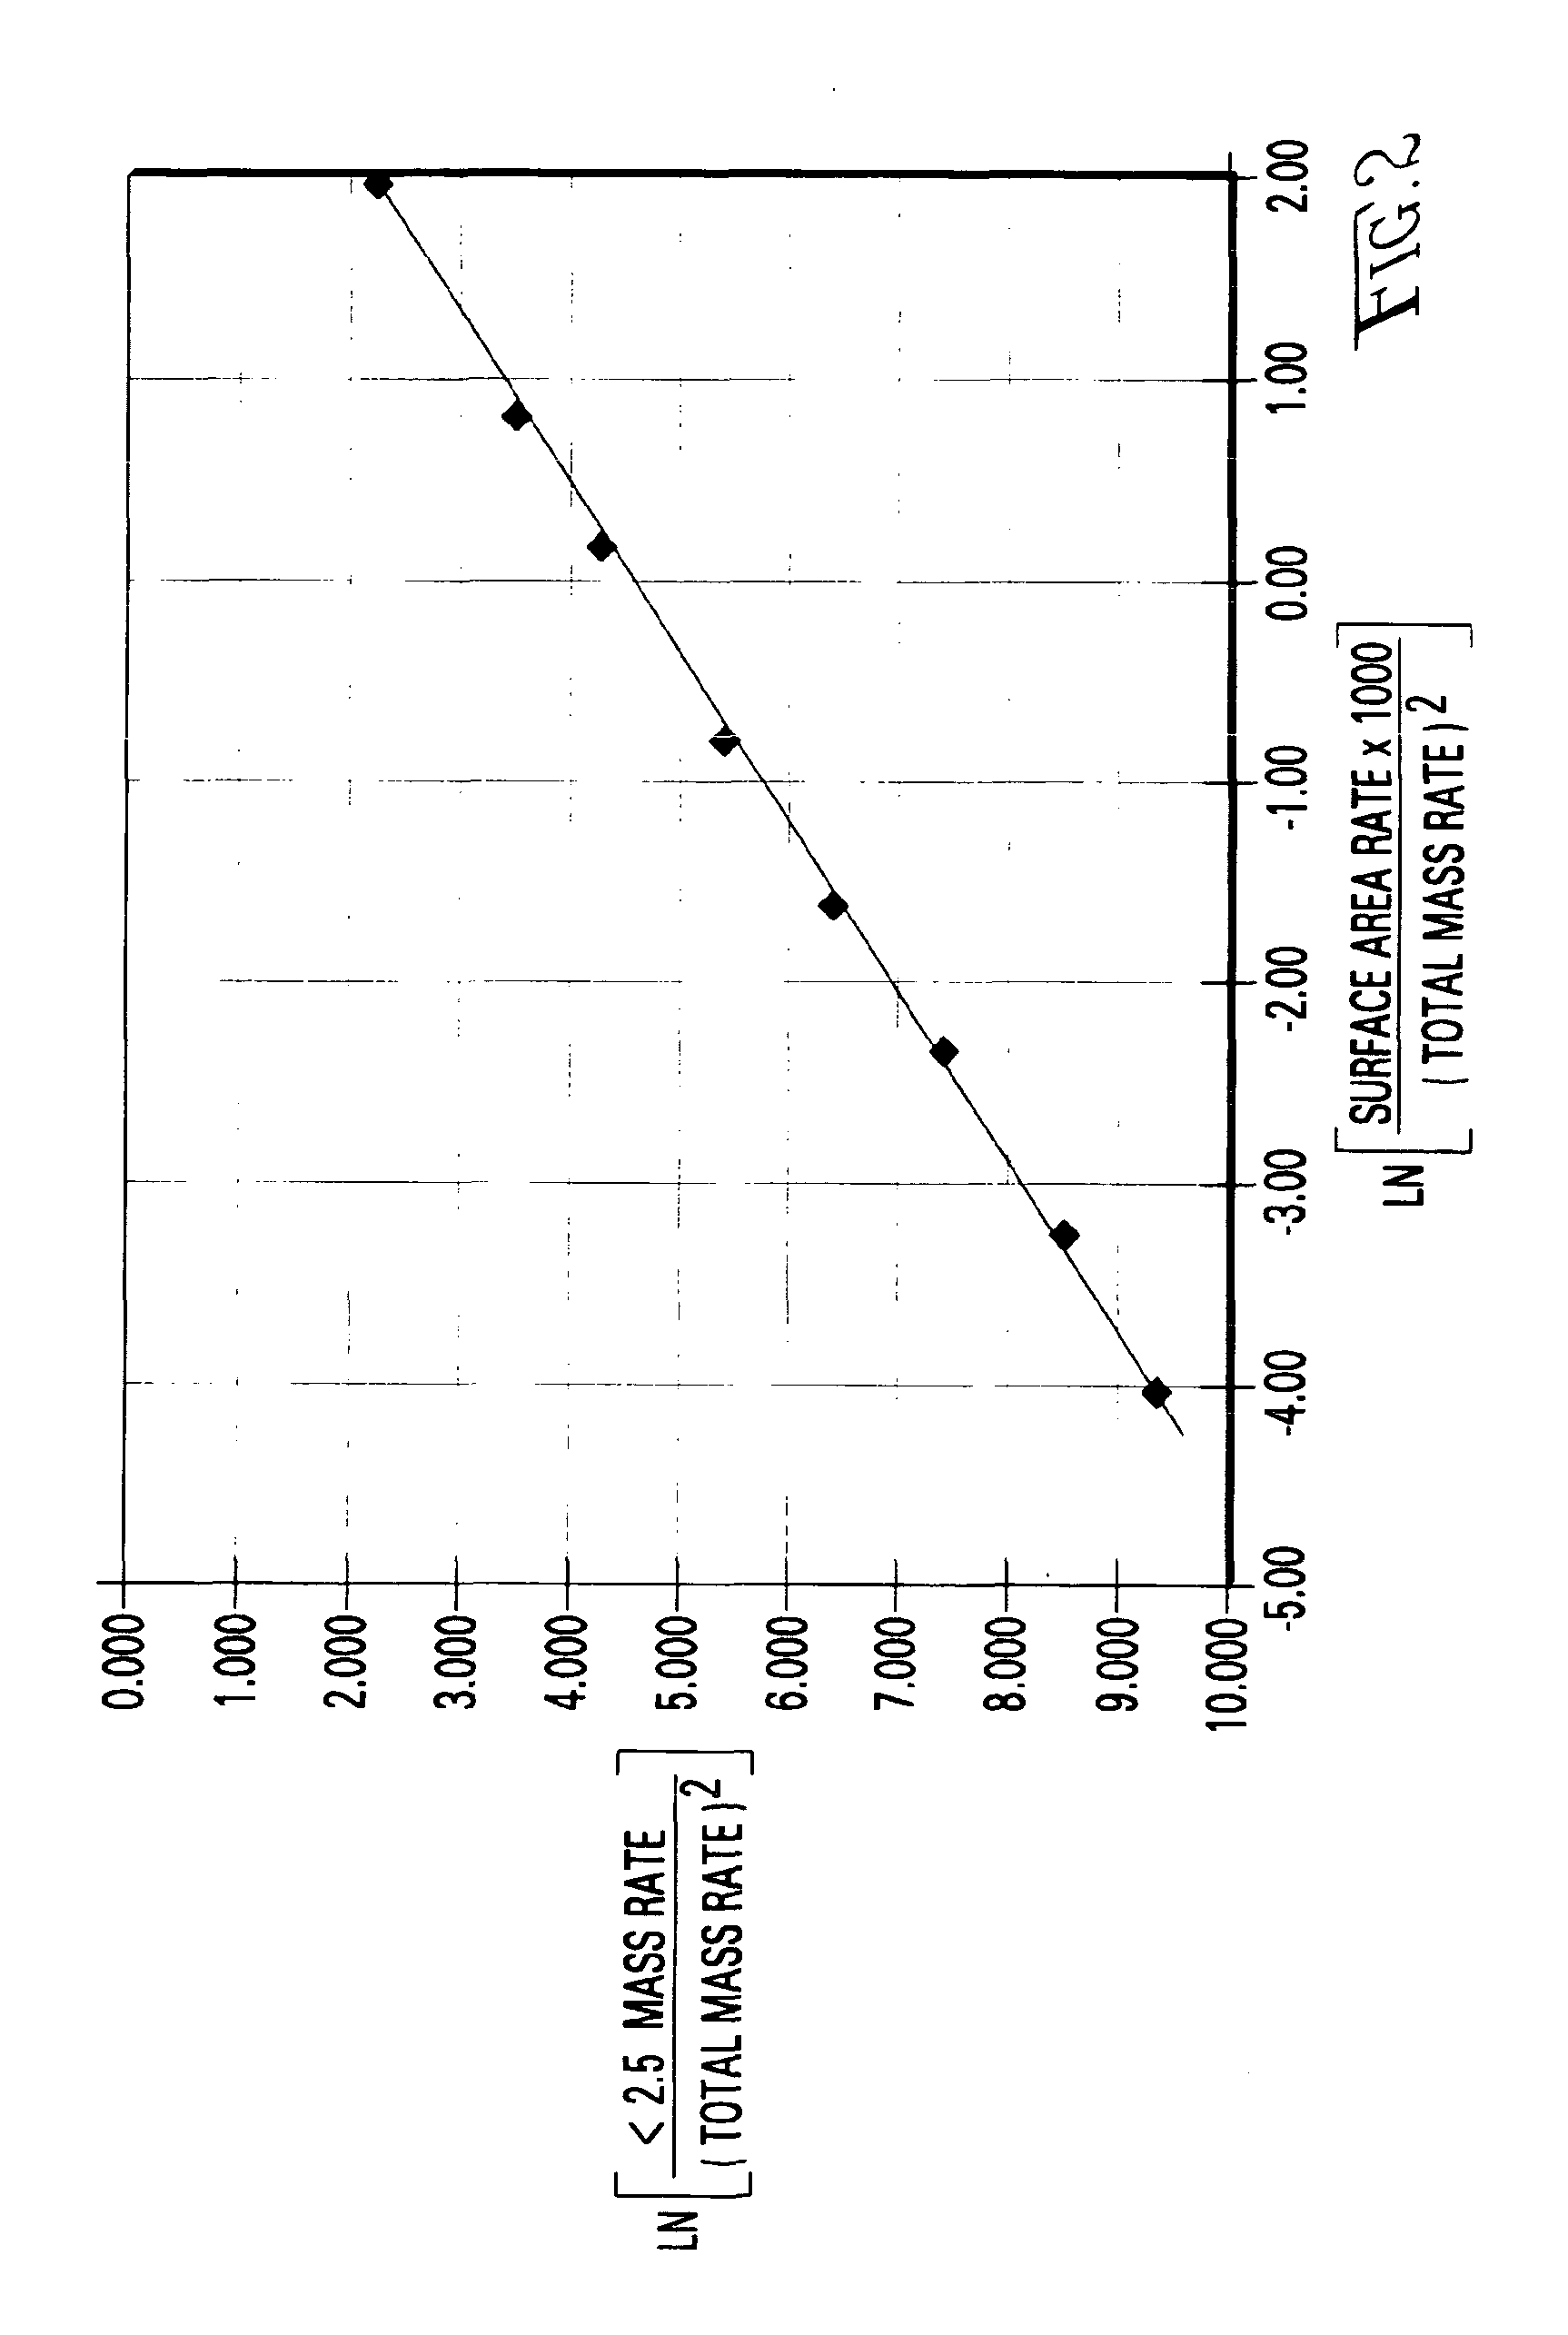
Particle size distribution data were collected from twelve inlets and three outlets of a fabric filter on a rotary dryer used to process bentonite. Particles were obtained by trapping, and the size distribution data were obtained by cascade impactor measurements. These data are shown in FIG. 2. On average, the twelve inlets each had a concentration of 0.259 grams of bentonite particles per cubic meter of air at standard conditions of 60° F. and 14.73 psia. The three outlets had an average concentration of 0.047 g bentonite per standard cubic meter of air. Particle size distributions for the inlets averaged about 0.7% of particles having a nominal diameter of less than 2.5 microns, whereas the outlets averaged about 10% of particles having a nominal diameter less than about 2.5 microns. The measured outlet distribution for the fabric filter represents baseline emissions for a well-operated fabric filter. The measured inlet distribution re...

example 2

Calibration for Passive Atmospheric Sampler

Baseline calculations may be obtained using, for example, the aerodynamic particle sizer (APS) Model 3310 sold by TSI Inc. of St. Paul, Minn., which is described by Wilson, J. C. and Liu, B. Y. H., J. Aersol. Sci. 11:139-150 (1980); and Baron, P., Aerosol Sci. and Technol. 5:56-67, (1985). These measurements may be performed in parallel or series flow configuration with monitoring device 102. The baseline functions are mapped to the signal output of triboelectric probes 106, 110, relating the signal outputs from triboelectric probes 106, 110 to actual mass and particle size distributions in ambient air. The mapping may be, for example, by a least squares fit of any order using Equations (3) and (4), or an adaptive artificial intelligence algorithm including a neural network. The mapping function may take into account additional factors, such as measurements from a variety of sources. For example, conventional pollen counts and dust counts...

example 3

Calibration for Other Environments of Use

Calibration for other environments of use may be done in whatever specific application is selected. By way of example, example, monitoring device may be provided for use as an ambient air monitor in a flue stack, a clean room, or a biological or chemical laboratory. The monitoring device is installed with various options described above, as may be useful in the environment of use. Calibration commences by measuring particle sizes through other suitable instrumentation, for example, instruments that may be more difficult to maintain or expensive to produce or using a combination of instruments capable of measuring a wide range of particle sizes. For example, a cascade impactor or another instrument may provide a basis for calibration.

Calibration techniques may vary with the environment of use. For example, different environments may contain particles having different shapes, sensitivities, and origins, such as biological, organic and inorg...


PUM


Abstract

A method and apparatus for monitoring particulate matter in a gas sample and the air quality associated therewith is provided.

Description

FIELD OF THE INVENTION This invention relates generally to a method and apparatus for monitoring airborne particles in a flowing gas. BACKGROUND Particulate matter (particulates) is the generic name used to describe small particles of solid or semi-solid materials, liquid droplets, aerosols and combinations thereof that are present in the ambient air. Total suspended particulates (TSP) refer to those airborne particulates that are less than 100 microns in diameter, which is the approximate thickness of a typical human hair. Particulates less than 10 microns in diameter are designated as PM10. Particulates originate from many sources, including combustion; poor industrial dust containment of such materials as coal dust, fly ash, and carbon black; automotive exhaust, especially diesel; and windblown or fugitive dust from roadways, fields, construction sites, and soil erosion. Photochemical reactions of certain gaseous pollutants in the presence of ultraviolet light also produce airb...

Claims


Application Information

Patent Timeline
IPC IPC(8): G01N15/02
CPCG01N15/02
Inventor TRENHOLM, ANDREW R.
Owner MRIGLOBAL
Learn More