Mass spectrometic quantification of chemical mixture components

a mass spectrometic and chemical mixture technology, applied in the direction of dispersed particle separation, particle separator tube details, separation processes, etc., can solve the problems of inability inability to provide comprehensive characterization of the biochemical and cellular functioning of complex biological systems, and inability to use gene information to identify certain classes of proteins

Inactive Publication Date: 2005-06-02
CAPRION PROTEOMICS INC
View PDF26 Cites 14 Cited by
  • Summary
  • Abstract
  • Description
  • Claims
  • Application Information

AI Technical Summary

Problems solved by technology

With the completion of the sequencing of the human genome, it has become apparent that genetic information is incapable of providing a comprehensive characterization of the biochemical and cellular functioning of complex biological systems.
While 2D gels combined with mass spectrometry (MS) has been the predominant tool of proteomics research, 2D gels have a number of key drawbacks that have led to the development of alternative methods.
Most importantly, they cannot be used to identify certain classes of proteins.
These deficiencies are detrimental for quantitative proteomics, which aims to detect any protein whose expression level changes.
Such approaches are suitable only for known proteins with available antibodies, a fraction of the total number of proteins, and are not typically used for high-throughput applications.
In addition, unlike mass spectrometric analysis, antibody-protein interactions are not fully molecularly specific and can yield inaccurate counts that include similarly structured and post-translationally modified proteins.
These studies are not quantitative, however.
Using internal standards for complex biological mixtures is problematic.
In many cases, the compounds of interest are unknown a priori, preventing appropriate internal standards from being devised.
The problem is more difficult when there are many compounds of interest.
In addition, biological samples ar

Method used


Image

  • Mass spectrometic quantification of chemical mixture components
  • Mass spectrometic quantification of chemical mixture components
  • Mass spectrometic quantification of chemical mixture components

Examples


working examples

Working Example 1

5-Component Protein Mixtures

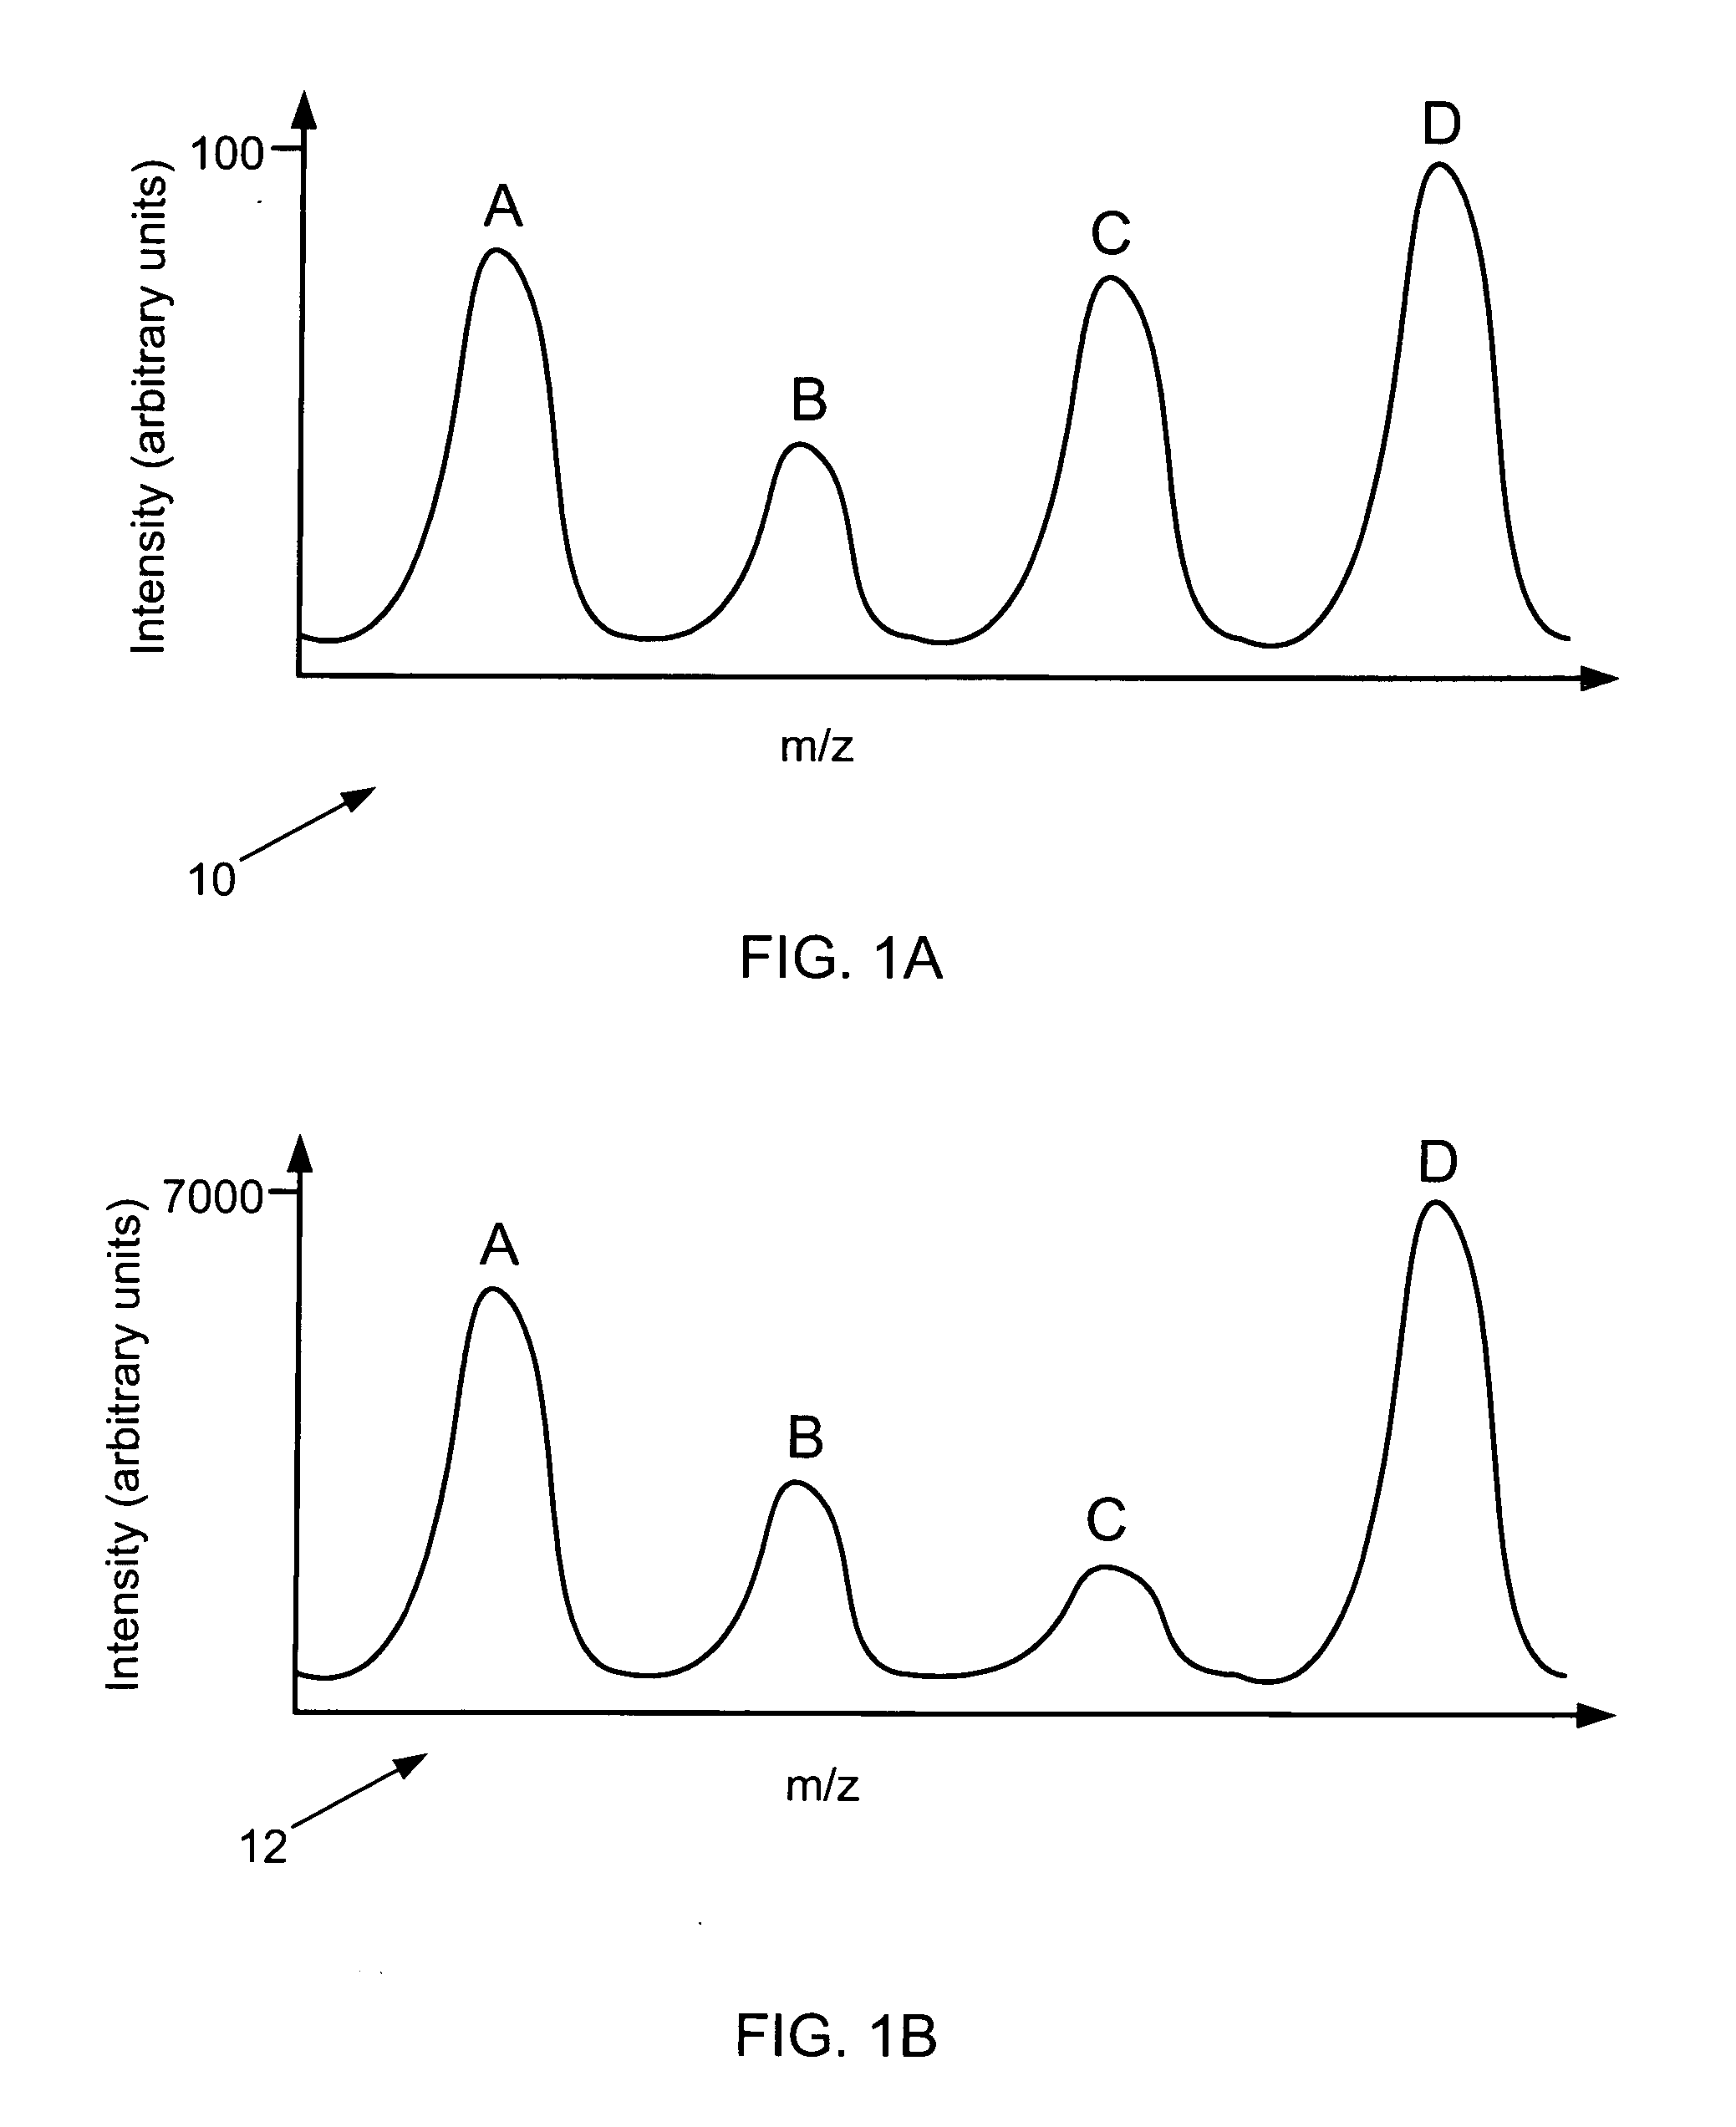
[0054] A method of one embodiment of the invention was implemented using three five-component protein mixtures in which two of the components varied in concentration,

[0055] while the remaining three were constant. Relative mass concentrations within the samples were as follows:

BovineBovineBovineSampleHorseribonucleaseserumcytochromeHumannumbermyoglobinAalbuminChemoglobin111111211150.231110.25

All three samples were denatured by 6 M guanidine hydrochloride, reduced by 10 mM dithiothreitol at 37° C. for 4 hours, and alkylated with 25 mM iodoacetic acid / NaOH at room temperature for 30 minutes in the dark. The denaturant and reduction-alkylation reagents were removed from the mixtures by buffer exchange against 50 mM (NH4)2CO3 at pH 8.3 three times using 5-kDa molecular weight cut-off spin filters. Modified trypsin at 1% weight equivalence of the proteins was added to the mixtures for incubation at 37° C. for 14 hours. The same amount o...

working example 2

Normalized Peak Intensities of Human Serum Sample Spectra

[0059] Human serum samples were analyzed to determine measurement variability after normalization using one embodiment of the present invention. Pooled human serum was purchased from Sigma-Aldrich (for proteome studies) and obtained from four anonymous healthy donors at the Stanford Blood Center (for metabolome studies). The serum was fractionated into serum proteome and serum metabolome using a 5-kDa molecular weight cut-off spin filter. Twenty-five μL of the serum proteome was diluted with 475 μL of 25 mM PBS buffer (pH 6.0) before being applied to affinity beads from ProMetic Life Sciences for removal of human serum albumin and IgG. The albumin- and IgG-depleted serum proteome was denatured, reduced, alkylated, and trypsin digested following the procedures described in Working Example 1 to yield 200 μg proteome. The serum metabolome was desalted using a C18 solid-phase extraction cartridge. The proteome fraction was divid...

working example 3

Human Serum Spiked With Non-Human Proteins and Small Molecules

[0061] Human blood serum proteome spiked with horse myoglobin and bovine carbonic anhydrase II, as well as human blood serum metabolome spiked with low-molecular weight species, were analyzed using methods of embodiments of the invention. The spiking is not part of the quantification method, but was rather used to test the method.

[0062] Human serum was obtained and fractionated into serum proteome and serum metabolome as described in Working Example 2. The two non-human proteins were spiked into 20μg of unprocessed human serum proteome at amounts ranging from 100 fmol to 100 pmol. The spiked proteome samples were denatured, reduced, alkylated, and trypsin digested following the procedures described in Working Example 1. Varying amounts of an equimolar test compound mixture were added to 100 μL of the metabolome prior to sample clean-up using the solid-phase extraction C18 cartridge. The components added were des-asp1-a...


PUM


Abstract

Relative quantitative information about components of chemical or biological samples can be obtained from mass spectra by normalizing the spectra to yield peak intensity values that accurately reflect concentrations of the responsible species. A normalization factor is computed from peak intensities of those inherent components whose concentration remains constant across a series of samples. Relative concentrations of a component occurring in different samples can be estimated from the normalized peak intensities. Unlike conventional methods, internal standards or additional reagents are not required. The methods are particularly useful for differential phenotyping in proteomics and metabolomics research, in which molecules varying in concentration across samples are identified. These identified species may serve as biological markers for disease or response to therapy.

Description

CROSS-REFERENCE TO RELATED APPLICATION [0001] This application is a continuation of U.S. application Ser. No. 10 / 272,425, “Mass Spectrometric Quantification of Chemical Mixture Components,” filed Oct. 15, 2002, now U.S. Pat. No. 6,835,927, which claims the benefit of U.S. Provisional Application No. 60 / 329,631, “Mass Spectrometric Quantification of Chemical Mixture Components,” filed Oct. 15, 2001, both incorporated herein by reference.FIELD OF THE INVENTION [0002] The present invention relates generally to spectroscopic analysis of chemical and biological mixtures. More particularly, it relates to a method for relative quantification of proteins or other components in mixtures analyzed by mass spectrometry without using an internal standard, isotope label, or other chemical calibrant. BACKGROUND OF THE INVENTION [0003] With the completion of the sequencing of the human genome, it has become apparent that genetic information is incapable of providing a comprehensive characterization...

Claims


Application Information

Patent Timeline
IPC IPC(8): H01J49/04
CPCH01J49/0036
Inventor BECKER, CHRISTOPHER H.HASTINGS, CURTIS A.NORTON, SCOTT M.ROY, SUSHMITA MIMIWANG, WEIXUNZHOU, HAIHONGSHALER, THOMAS ANDREWKUMAR, PRAVEENANDERLE, MARKUSLIN, HUA
Owner CAPRION PROTEOMICS INC
Why Eureka
Try Eureka