Method and system for determining a risk of ulcer onset
- Summary
- Abstract
- Description
- Claims
- Application Information
AI Technical Summary
Benefits of technology
Problems solved by technology
Method used
Image
Examples
example 1
A Prototype System
[0193] A prototype of a system for determining a risk of pressure ulcer onset according to the above description was constructed.
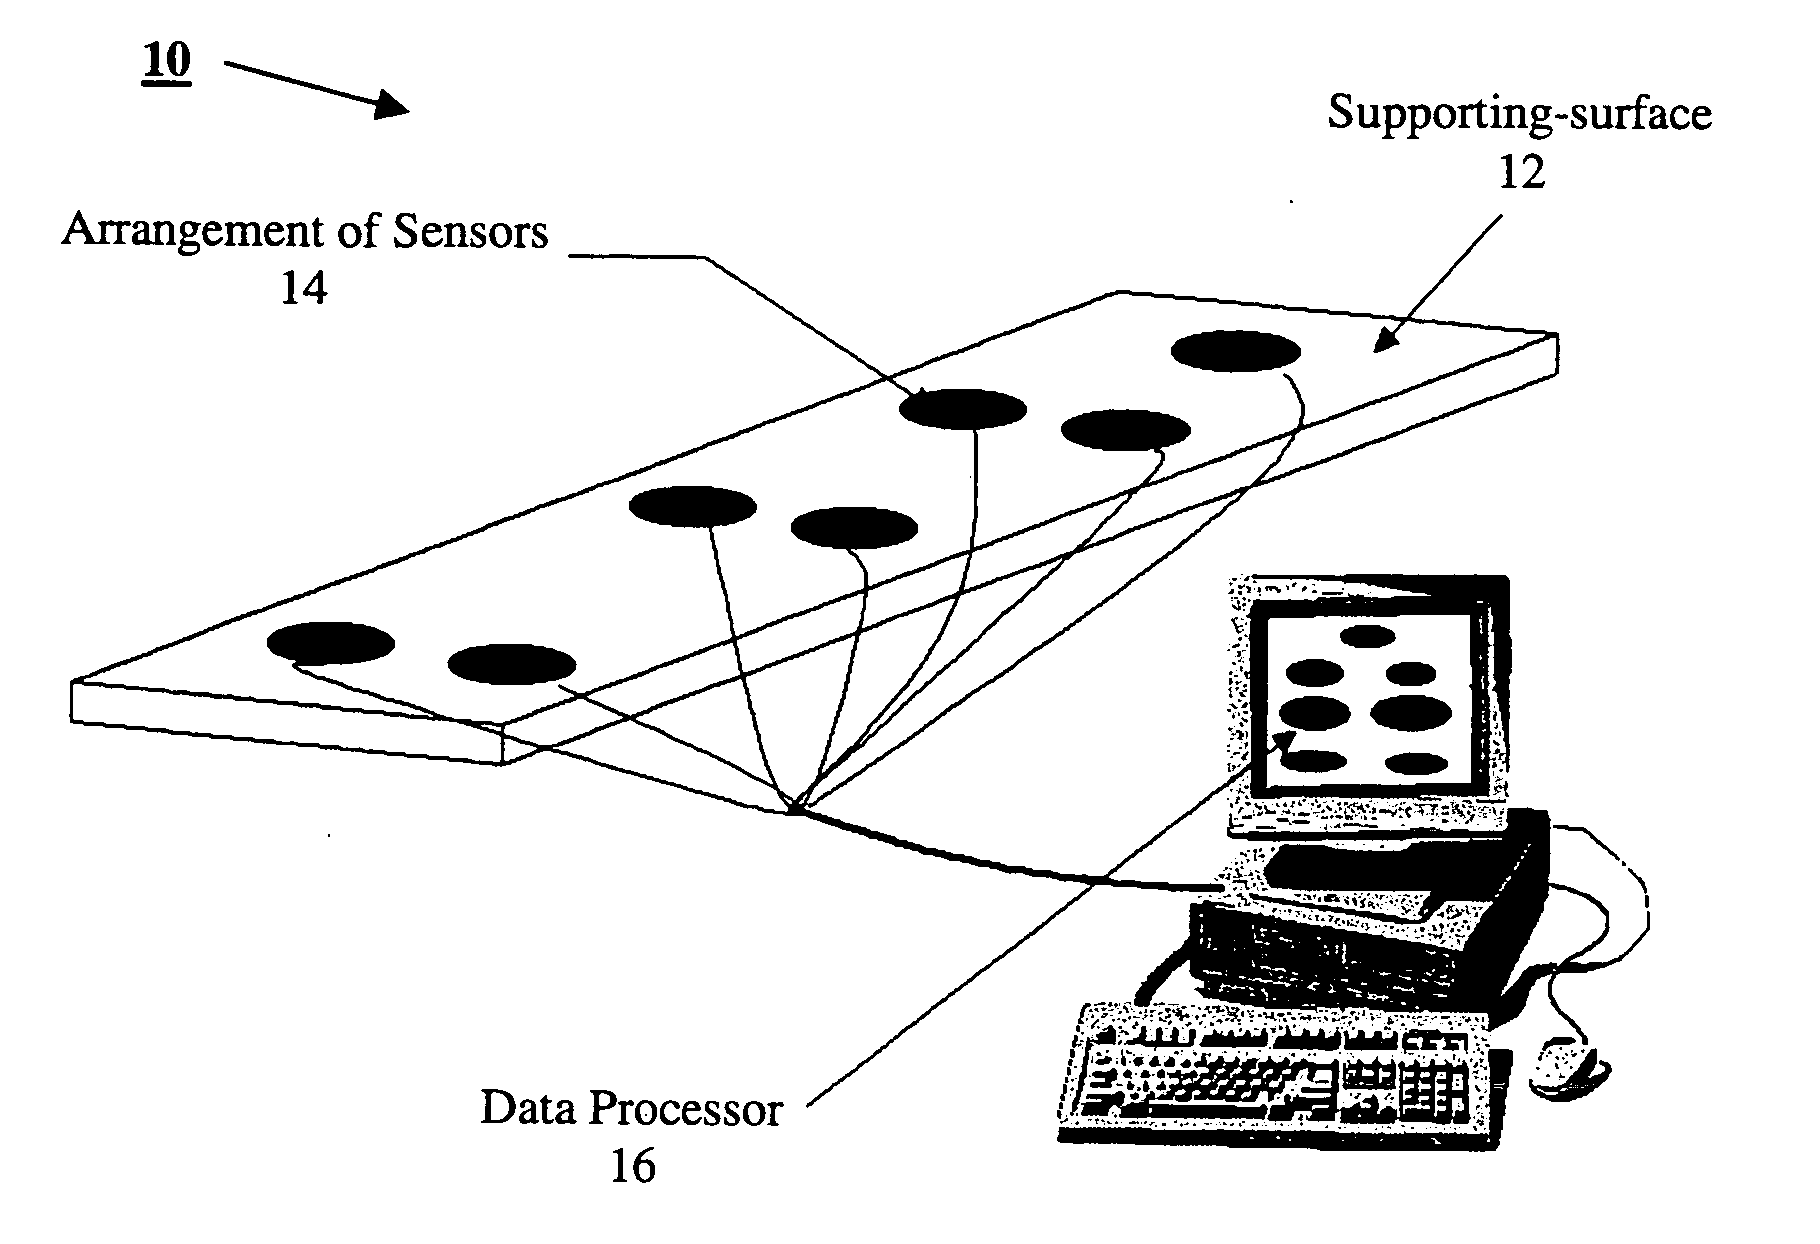
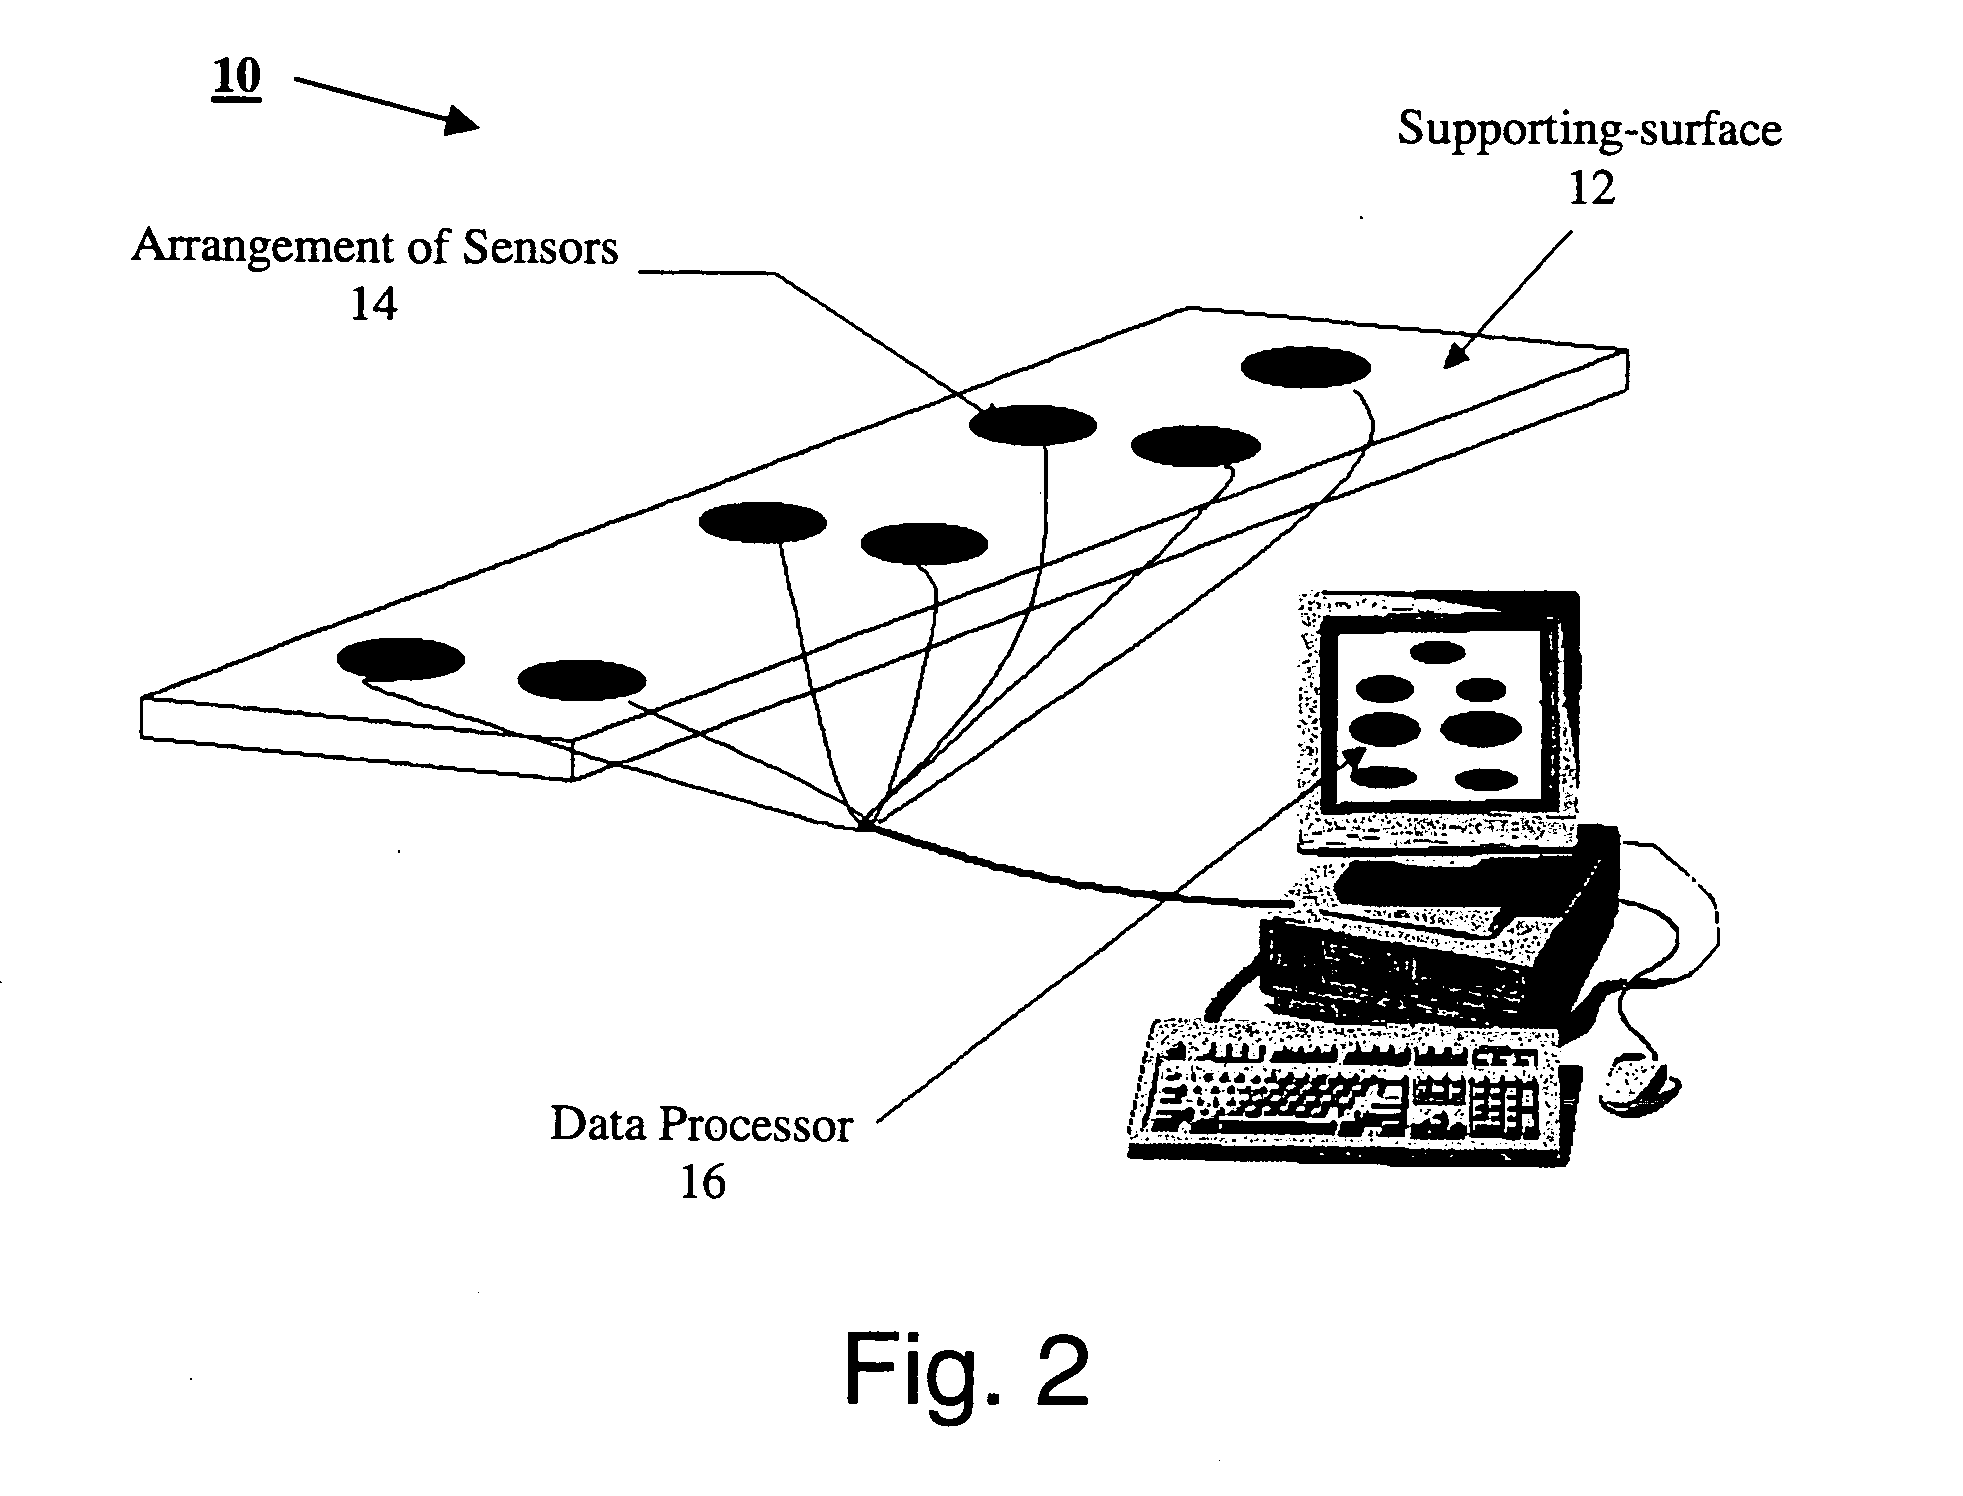
[0194] Reference is now made to FIG. 7a which is a photographed image of the prototype system, and to FIG. 7b which is a block diagram of the components of the prototype system. The prototype system includes: [0195] (a) a supporting bench; [0196] (b) a matrix of 20 flexible contact compressive stress sensors, of type Flexiforce, purchased from Tekscan Inc., the matrix is further detailed in FIG. 8; [0197] (c) a matrix of 8 skin temperature sensors of type T Thermocouple, purchased from Tekscan Inc., the matrix is further detailed in FIG. 9; and [0198] (d) a data processor having two 16-channeled A / D cards of type PCI-6023, purchased from National Instrument.
[0199] A complete summery of all the components used for the construction of the prototype system (sensors, connectors, cards, cables, resistors, etc.) is provided in Table 1.
TABL...
example 2
Simulations
[0209] Simulations of different pressure and temperature profiles were performed by producing synthetic voltage signals to simulate sensor outputs. Instruments used in this example and in Example 3 below, are listed in Table 2.
TABLE 2QuantityIdentificationManufacturerMulti-meter173-3FlukeOscilloscope1TDS210TektronixFunction Generator1CFG253TektronixAluminum Pressure Weight15Mercury Thermometer1
[0210] Four different profiles were tested: a 10 Hz square signal, a 10 Hz triangle signal, a 10 Hz sine signal and a 20 Hz sine signal, all of which having amplitudes of 4-5 Volts. The simulations were executed using a sample time of 0.01 seconds and a time frame of 1 second.
[0211] With reference to FIG. 13, a square signal of about 4.33 V (Duty Cycle=50%) was produced to simulate pressure readings. The voltage was converted to contact compressive stress of about 21.65 KPa (see Example 1) and then to internal stress of about 589.83 KPa. Since the pressure is accumulated gradual...
example 3
Direct Contact Tests
[0214] The sensors were stimulated in the laboratory in four different experiments. As in Example 2, the sample time was 0.1 sec and the time frame was 1 sec.
[0215] With reference to FIG. 17a, FIG. 17b and FIG. 18, in a first experiment two random pressure pulses were applied to the pressure sensors by a direct contact. The contact compressive stress, from 0 KPa to about 4.5 KPa, was converted to internal stress, ranging from 0 KPa to about 600 KPa. As discussed in Example 1, pressure under 0.4 KPa was filtered out, i.e., considered as internal stress of 0 KPa. FIG. 17a shows the applied random contact compressive stress in units of KPa and FIG. 17b shows the calculated internal stress in units of KPa. FIG. 18 shows the pressure and the pressure dose in units of KPa as a function of time for the calculated internal stresses of FIG. 17b. It is shown that the pressure dose trace follows the applied pressure signal over the duration of the two random pulses.
[0216...
PUM
 Abstract
Description
Claims
Application Information
 - R&D
- Intellectual Property
- Life Sciences
- Materials
- Tech Scout
- Unparalleled Data Quality
- Higher Quality Content
- 60% Fewer Hallucinations
Browse by: Latest US Patents, China's latest patents, Technical Efficacy Thesaurus, Application Domain, Technology Topic, Popular Technical Reports.
© 2025 PatSnap. All rights reserved.Legal|Privacy policy|Modern Slavery Act Transparency Statement|Sitemap|About US| Contact US: help@patsnap.com


