Cytological methods for detecting a disease condition such as malignancy by Raman spectroscopic imaging

a cytological method and raman technology, applied in the field of mammalian cellular evaluation and correlation of cellular physiological status and diagnosis of disease, can solve the problems of inability to detect other disease states (including many physiological states) by ordinary cytological methods, inability to perform vivo cytological methods, and inability to detect other disease states

Inactive Publication Date: 2006-12-14
CHEMIMAGE CORP
View PDF21 Cites 88 Cited by
  • Summary
  • Abstract
  • Description
  • Claims
  • Application Information

AI Technical Summary

Benefits of technology

[0121] As described herein, it has been discovered that wavelengths at least as low as about 500 nanometers (e.g., from 350 to 695 nanometers), and likely as low as 280 nanometers or even 220 nanometers, can be used without causing significant cell damage, especially if wide-field illumination techniques are employed and the intensity of the illuminating radiation is carefully controlled. Because the intensity of scattered light is known to be dependent on the fourth power of the frequency (i.e., inverse wavelength) of the irradiating light, and only proportional to the intensity of the irradiating light, lowering the wavelength of the irradiating light has the effect of increasing scattering signal output. Thus, a Raman scattering signal of equal intensity can be obtained by irradiating a sample with light having a higher wavelength and by irradiating the sample with a lower (irradiation) intensity of light having a shorter wavelength. Even under constant illumination, cells can survive irradiation with light having a wavelength as short as 500 nanometers if the intensity of the irradiating light is controlled. Irradiation using even shorter wavelengths can be performed without harming the illuminated cells if intermittent or very short duration irradiation methods are employed. Irradiating cells with sub-700 nanometer wavelength light significantly boosts the Raman scattering signal obtained from the cells, leading to greater intensity and resolution of the Raman spectra of the cells and permitting more sensitive assessment of the disease state of the cells than was possible using previous methods.
[0243] Additionally the disclosure embraces alternative data reduction approaches to parametering a Raman image in order to classify the spectrum at each pixel in terms of an established library of spectral features. A simple measure of spectral distance between a pixel spectrum and a library presented as an image. For example, a potential spectral library approach involves taking measurements of the Cosine Correlation between the spectrum at each pixel in an image and both the mean G3 and mean G0 spectrum from a data set. This mean value from the image provides for facile data reduction and this process may be repeated for a number of spectral library members yielding several parameters for a particular data set.

Problems solved by technology

In vivo cytological methods are often impractical owing, for example, to relative inaccessibility of the cells of interest and unsuitability of staining or labeling reagents for in vivo use.
However, other disease states (including many physiological states which precede or indicate a predisposition to develop a disease state) cannot be readily detected by ordinary cytological methods.
A further shortcoming of many cytological methods is that, even when cytological identification of a disease state is possible, the time, expense, and expertise necessary to perform the cytological analysis can make it impractical or impossible to perform that analysis.
Cancer is significant, not only in terms of mortality and morbidity, but also in terms of the cost of treating advanced cancers and the reduced productivity and quality of life achieved by advanced cancer patients.
Because cancers arise from cells of normal tissues, cancer cells usually initially closely resemble the cells of the original normal tissue, often making detection of cancer cells difficult until the cancer has progressed to a stage at which the differences between cancer cells and the corresponding original normal cells are more pronounced.
Communication of results from the pathologist to the physician and to the patient can further slow the diagnosis of the cancer and the onset of any indicated treatment.
Because of the tissue preparation required, this process is relatively slow.
Moreover, the differentiation made by the pathologist is based on subtle morphological and other differences among normal, malignant, and benign cells, and such subtle differences can be difficult or time-consuming to detect, even for highly experienced pathologists.
Such differences are even more difficult for relatively inexperienced pathologists to detect.
Sickle-shaped RBCs are not able to pass through narrow blood vessels as easily as normal RBCs.
As a result, sickle RBCs can obstruct blood flow, causing damage to blood vessels and tissues that depend on those vessels for oxygen and nourishment.
Children of two individuals, each of whom makes both normal and altered hemoglobin are at increased risk for sickle cell diseases such as sickle cell anemia, thalassemia, stroke, and damage to multiple organs.
However, once an individual has been diagnosed with sickle cell disease or as a carrier of the sickle cell trait, medical interventions are limited.
Because cardiac muscle tissue is not easily accessible, the effects of these disease states on cardiac muscle tissue cannot be easily observed.
For this reason, diagnostic methods which rely on observations of cardiac muscle tissue have not been widely used.
Performing single point measurements on a grid over a field of view will also introduce sampling errors which makes a high definition image difficult or impossible to construct.
Moreover, the serial nature of the spectral sampling (i.e., the first spectrum in a map is taken at a different time than the last spectrum in a map) decreases the internal consistency of a given dataset, making the powerful tools of chemometric analysis more difficult to apply.
Treado disclosed that Raman chemical imaging can be used to distinguish breast cancer tissue from normal breast tissue, but did not disclose how or whether any similar method might be applicable to diagnosis, grading, or staging of bladder cancers or other cancer diagnostic methods and protocols.

Method used


Image

  • Cytological methods for detecting a disease condition such as malignancy by Raman spectroscopic imaging
  • Cytological methods for detecting a disease condition such as malignancy by Raman spectroscopic imaging
  • Cytological methods for detecting a disease condition such as malignancy by Raman spectroscopic imaging

Examples


example 1

[0199] Raman Scattering Analysis of Bladder Cancer Cells.

[0200] Raman molecular imaging (RMI) was used to distinguish cancerous and non-cancerous bladder cancer cells to demonstrate that RMI is useful for detection of bladder cancer.

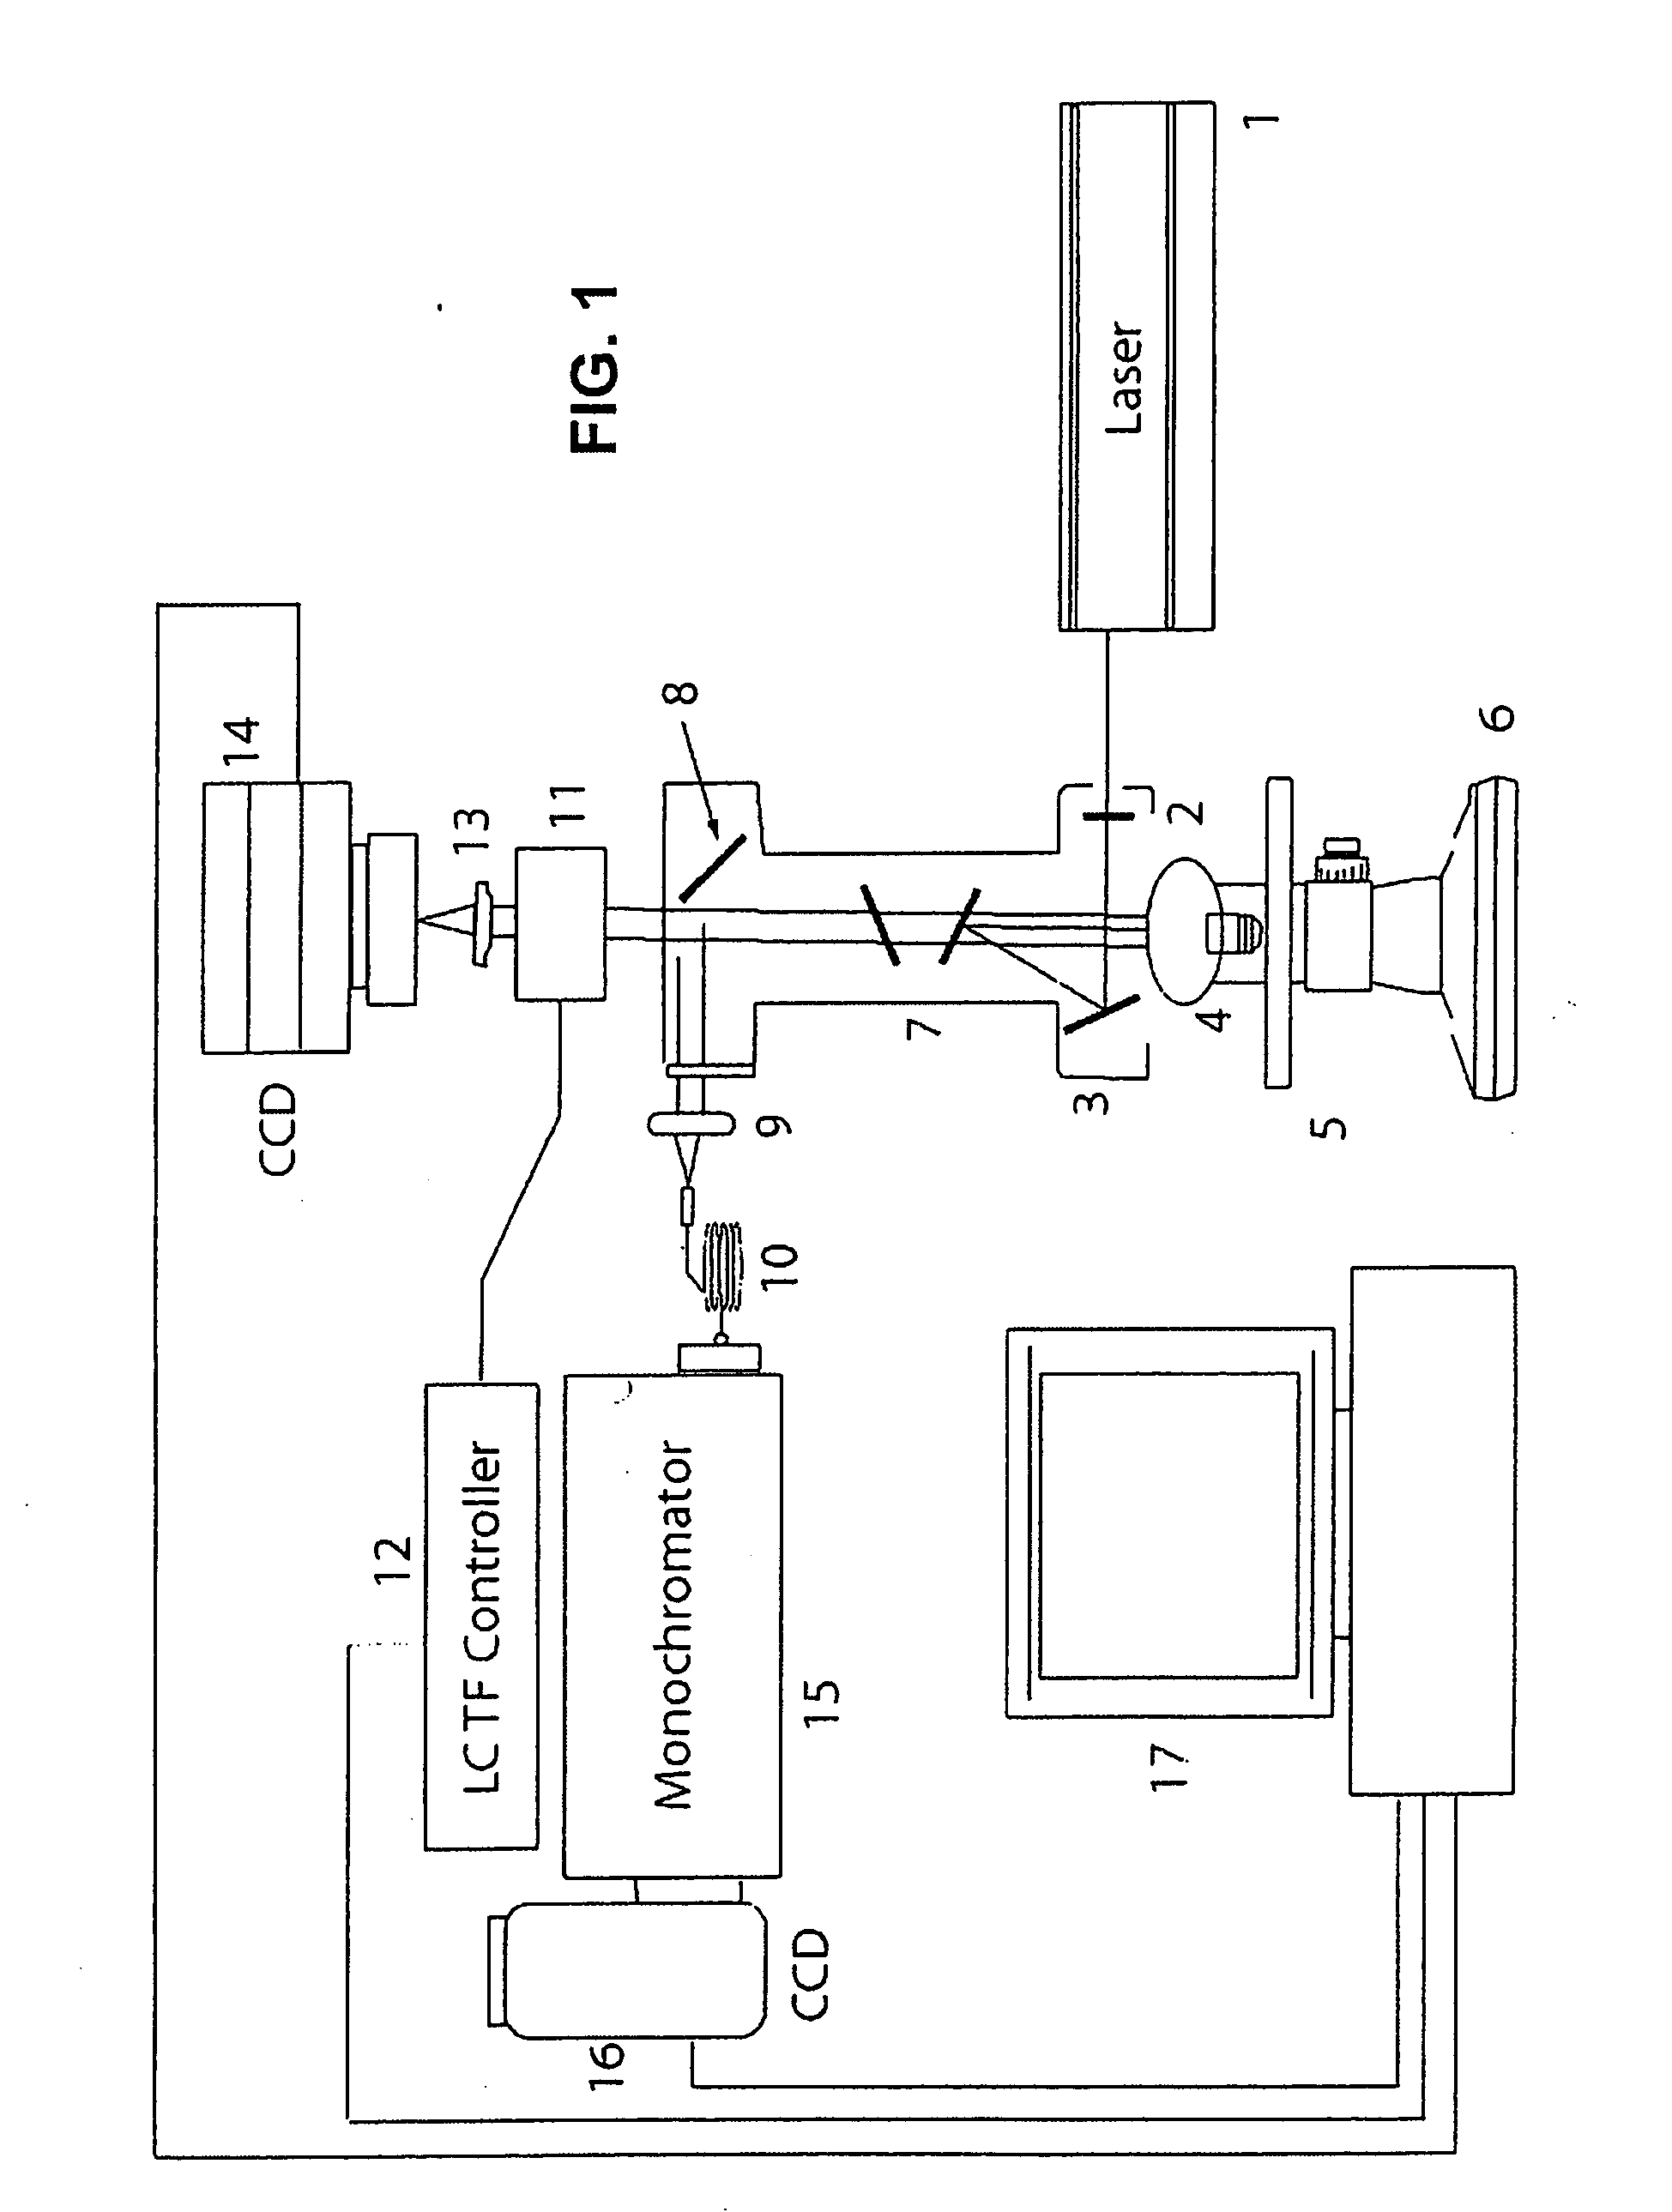
[0201] RMI is an innovative technology that combines the molecular chemical analysis capacity of Raman spectroscopy with the power of high definition digital image microscopic visualization. This platform enables physicians and their assistants to identify both the physical architecture and molecular environment of cells in a urine sample and can complement or be used in place of current histopathological methods.

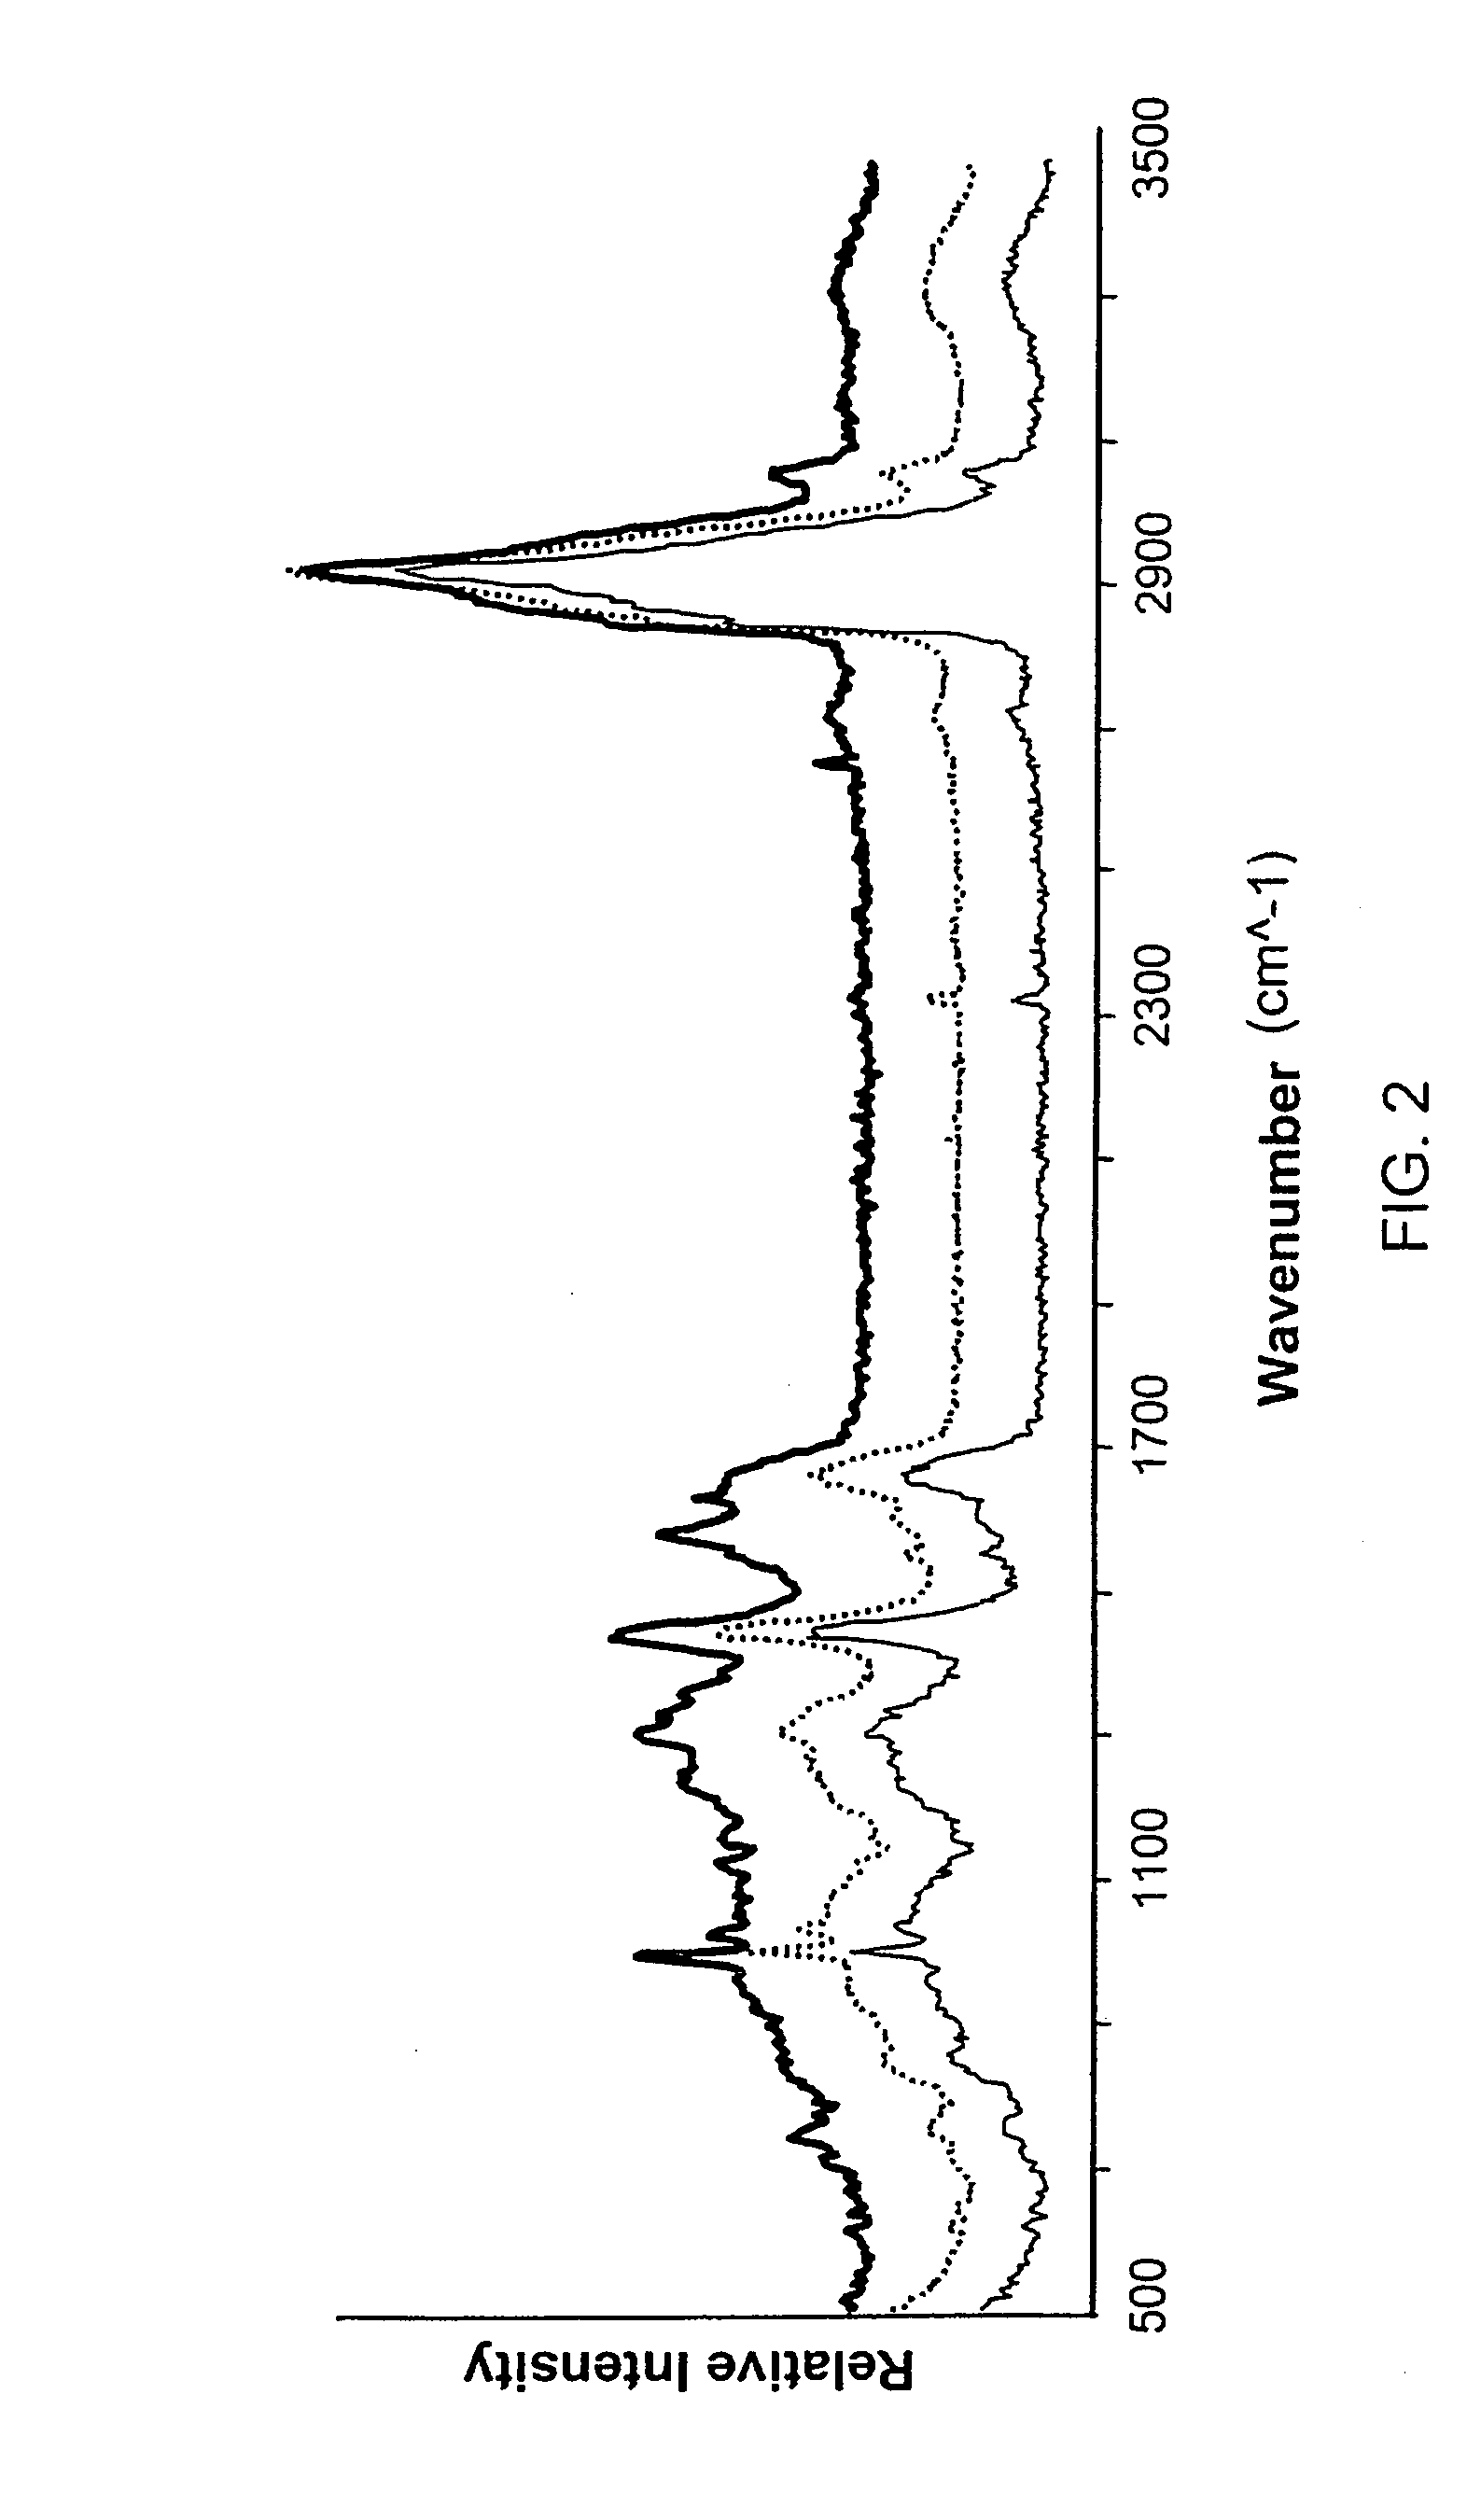
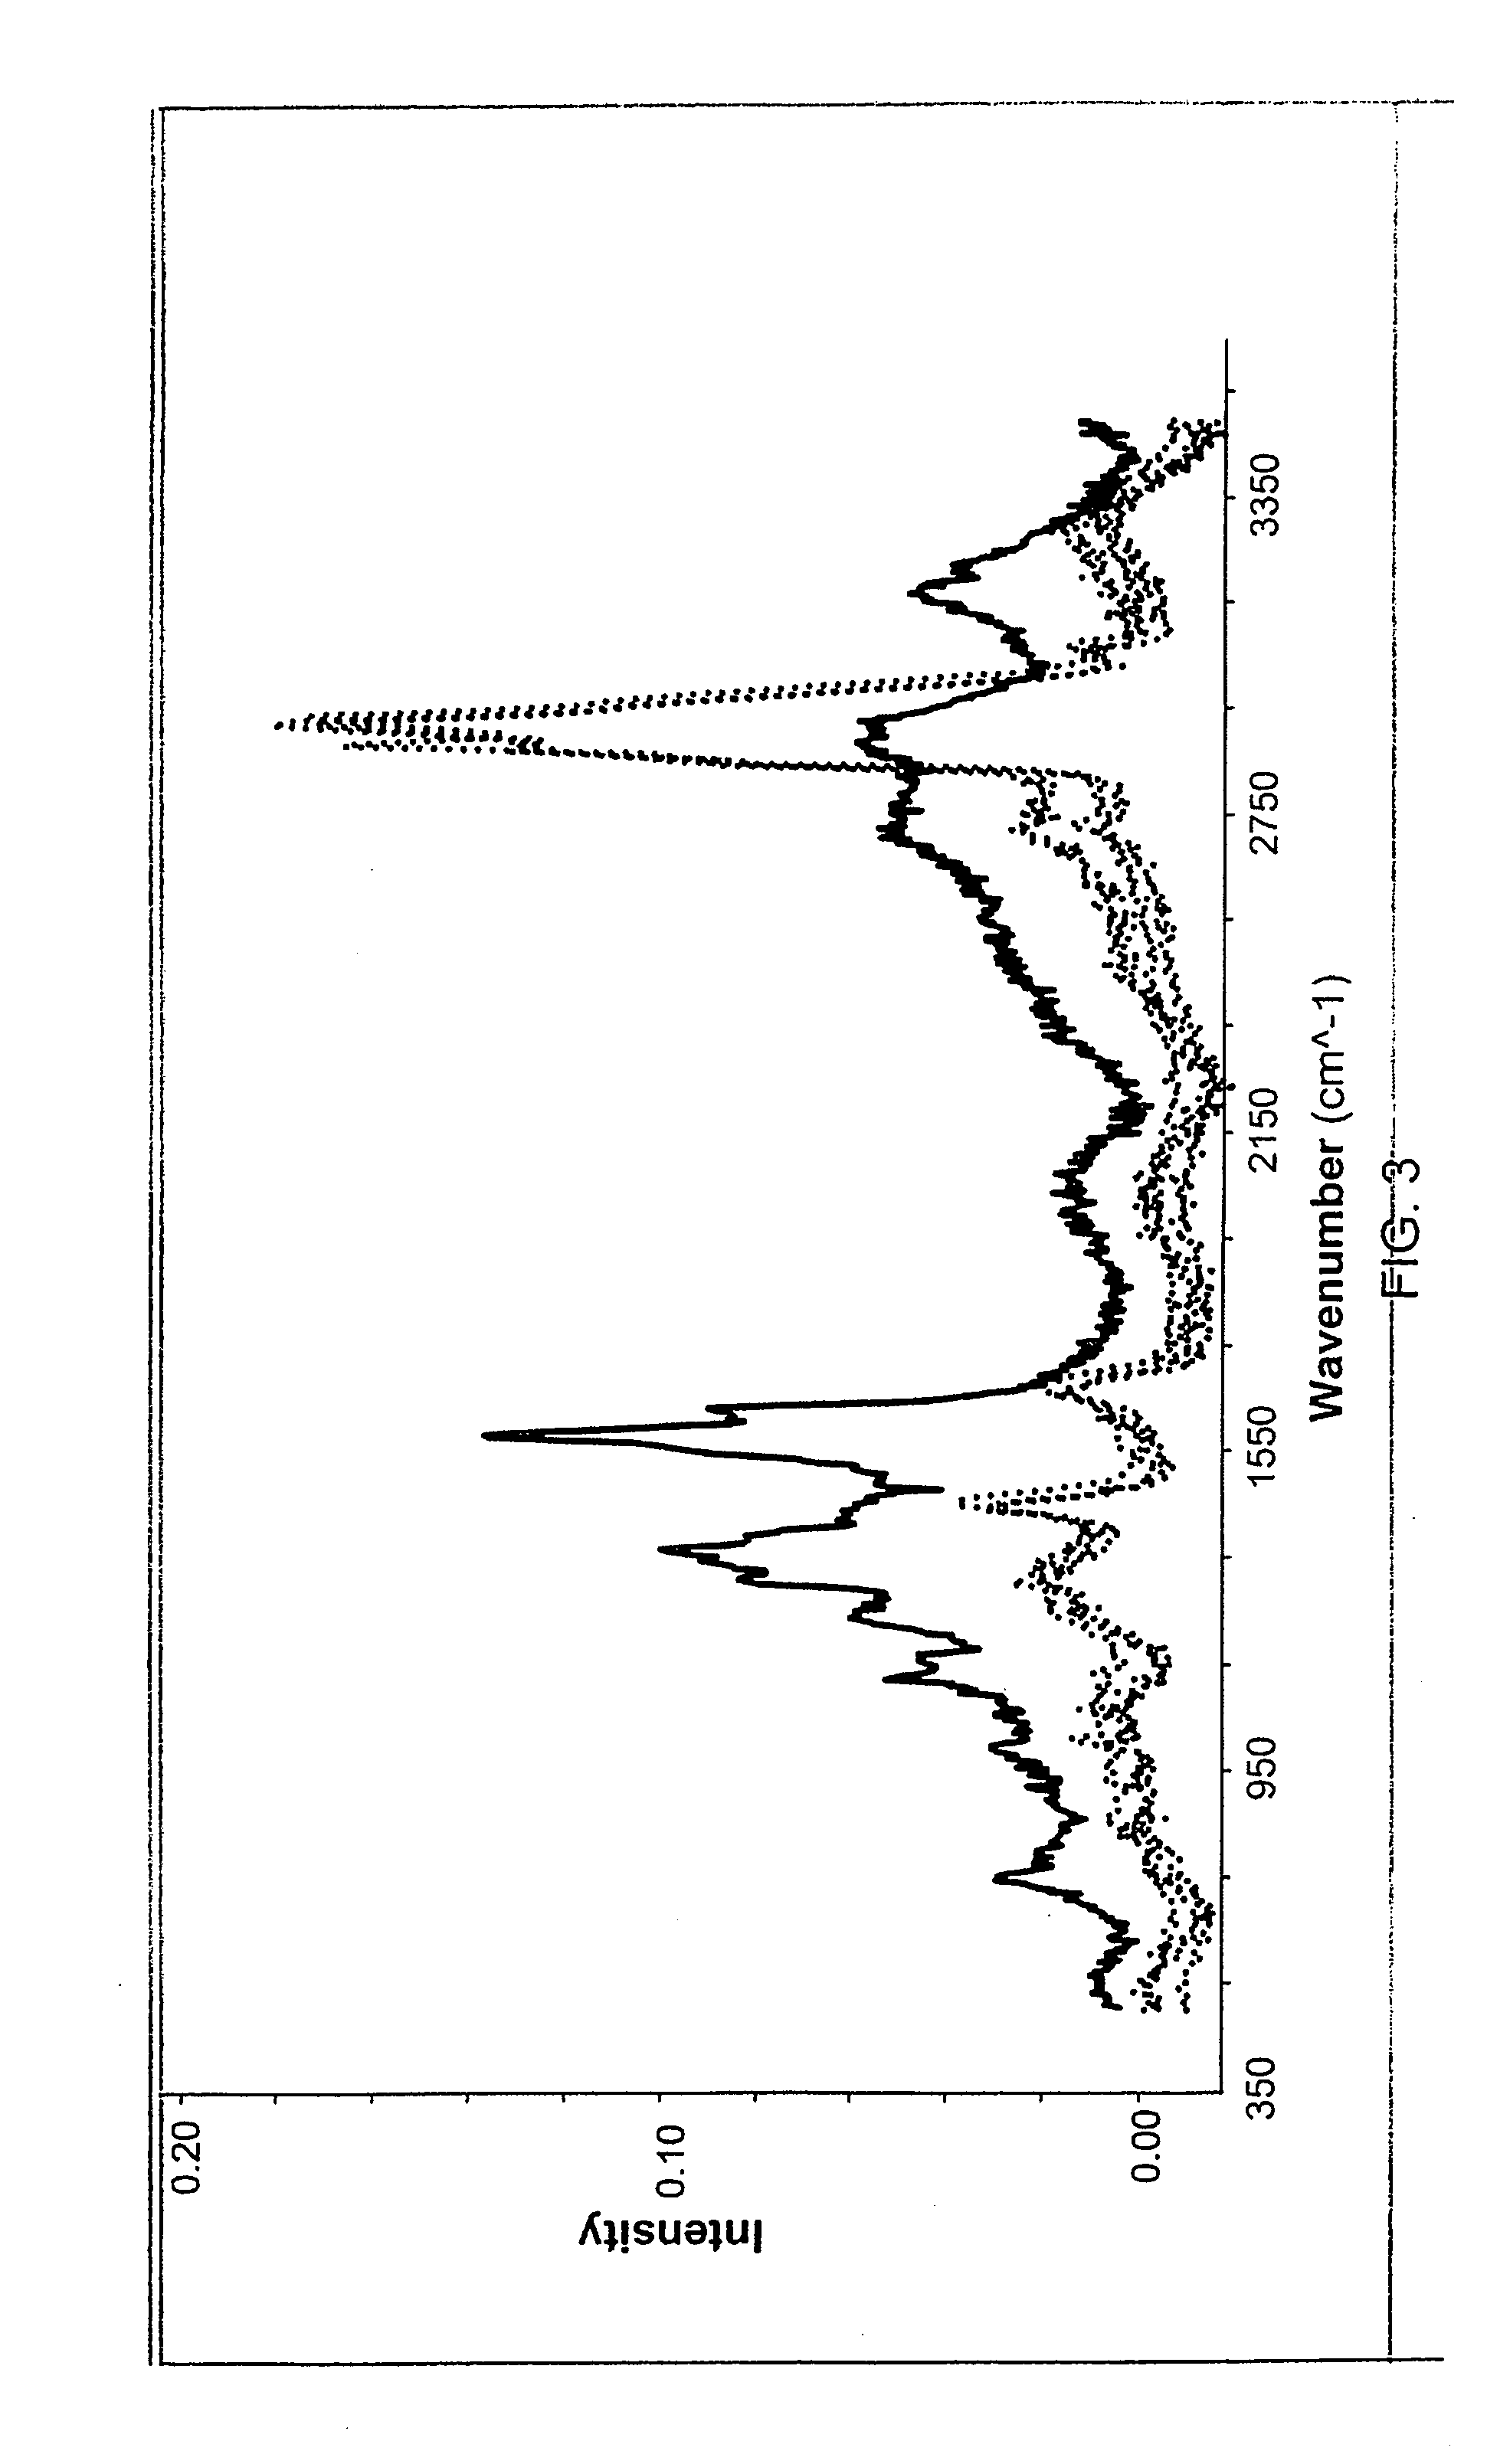
[0202] The data presented in this example demonstrate that the Raman scattering signal from bladder cancer tissue and cells voided in the urine can be identified and be distinguished from normal bladder tissue and cells. Detectable differences between high and low grade tumor cells were observed. These data establish that RMI signatures of bl...

example 2

[0246] Raman Scattering Analysis of Red Blood Cells.

[0247] Raman molecular imaging (RMI) was used to distinguish normal and sickled human red blood cells (RBCs).

[0248] Individual RBCs were obtained from two patients, one of whom was known to be afflicted with sickle cell disease (i.e., homozygous for the sickle cell trait gene) and the other of whom was known not to harbor an allele of the gene for the sickle cell trait. Prior to analysis, RBCs were treated by smearing onto an aluminum-coated glass slide and air dried.

[0249] For each RBC, a visual microscopic determination was made of whether the cell was normal (i.e., normally-shaped) or sickled (i.e., sickle-shaped) using a FALCON™ Raman imaging microscope obtained from ChemImage Corp. (Pittsburgh, Pa.). A single Raman spectrum was obtained from a field of view that included 3-5 RBCs using the Raman scattering channel of the FALCON instrument. For samples of sickled RBCs, each field included at least one RBC that exhibited the ...

example 3

[0252] Raman Scattering Analysis of Cardiac Tissue.

[0253] Raman molecular imaging (RMI) was used to assess cardiac muscle tissue and connective tissue in cardiac tissue samples obtained from patients afflicted with either idiopathic heart failure or ischemic heart failure.

[0254] Human cardiac tissue samples were obtained from five patients afflicted with ischemic heart failure and from five other patients afflicted with idiopathic heart failure. The tissue samples were obtained in the form of small tissue fragments fractured from explanted hearts which were frozen immediately after removal. Approximately 5 millimeter square tissue fragments were embedded in OCT and sliced into 5-10 micron sections. Tissue slices were placed on an aluminum coated slide. Excess OCT was removed with distilled water. Samples were air-dried and evaluated using a FALCON™, ChemImage Inc., Pittsburg, Pa.) Raman microscope.

[0255] Each tissue sample was sighted by visible light microscopy a Raman spectrum ...


PUM

PropertyMeasurementUnit
wavelengthaaaaaaaaaa
Raman shiftaaaaaaaaaa

Abstract

Raman molecular imaging (RMI) is used to detect mammalian cells of a particular phenotype. For example the disclosure includes the use of RMI to differentiate between normal and diseased cells or tissues, e.g., cancer cells as well as in determining the grade of said cancer cells. In a preferred embodiment benign and malignant lesions of bladder and other tissues can be distinguished, including epithelial tissues such as lung, prostate, kidney, breast, and colon, and non-epithelial tissues, such as bone marrow and brain. Raman scattering data relevant to the disease state of cells or tissue can be combined with visual image data to produce hybrid images which depict both a magnified view of the cellular structures and information relating to the disease state of the individual cells in the field of view. Also, RMI techniques may be combined with visual image data and validated with other detection methods to produce confirm the matter obtained by RMI.

Description

CROSS-REFERENCES TO RELATED APPLICATIONS [0001] This application claims priority to provisional application U.S. Ser. No. 60 / 688,801 filed on Jun. 9, 2005. Additionally, this application is a continuation-in-part of U.S. Ser. No. ______ (E2079-0071 case) which claims priority pursuant to 35 U.S.C. §119(e) to U.S. provisional patent application 60 / 568,357, which was filed on 5 May 2004. All of these provisional and non-provisional patent applications are incorporated by reference in their entireties herein.BACKGROUND OF THE DISCLOSURE [0002] The disclosure relates generally to the field of mammalian cellular evaluation and to correlation of cellular physiological status and diagnosis of disease based on such evaluation. In one embodiment the disclosure relates to methods for facilitating the detection of disease conditions by detection methods that use Raman molecular imaging (RMI). In an exemplary embodiment the disclosure provides Raman spectroscopic methods of detecting malignant ...

Claims


Application Information

Patent Timeline
Patent Type & Authority Applications(United States)
IPC IPC(8): C12Q1/00C12Q1/70C12Q1/68G06F19/00G01J3/44
CPCG01N2021/656G01N21/65
Inventor MAIER, JOHN S.STEWART, SHONA D.TREADO, PATRICK J.
Owner CHEMIMAGE CORP
Why Eureka
Try Eureka