Chemical indicator test strip
a technology of chemical indicators and test strips, applied in the direction of chemical indicators, chemical methods analysis, instruments, etc., can solve the problems of requiring a long delay between sample collection, and affecting the quality of groundwater
- Summary
- Abstract
- Description
- Claims
- Application Information
AI Technical Summary
Benefits of technology
Problems solved by technology
Method used
Image
Examples
example 1
Construction of an Indicator Strip with a Substantially Water-Insoluble Quinoid Dye Complex
[0125]Twenty milligrams of Pergascript Blue I-2RN obtained from Ciba-Geigy Specialty Chemicals, NC was dissolved in 5 grams of methyl isobutyl ketone (MIBK) obtained from Aldrich Chemicals. Separately, 200 milligrams of poly(4-vinyl phenol), M.W.=8000 Da as developing agent and 20 milligrams sodium dioctylsulfosuccinate surfactant (both obtained from Aldrich Chemicals) were dissolved in 5 grams MIBK. The two solutions were mixed together to obtain a clear homogenous solution. Blank indicator strips were prepared by heat bonding a 0.3″ by 0.3″ swatch of Whatman 114 filter paper (obtained from Whatman International, England) to one end of a 4″ by 0.3″ polyester strip (5 mils thick) using a supported double-sided PSA. Five microliters of the solution were spotted on the paper. The initially colorless spot turned deep blue on evaporation of the MIBK. The chemical indicator test strip was dried at ...
example 2
Use of the Indicator in Example 1
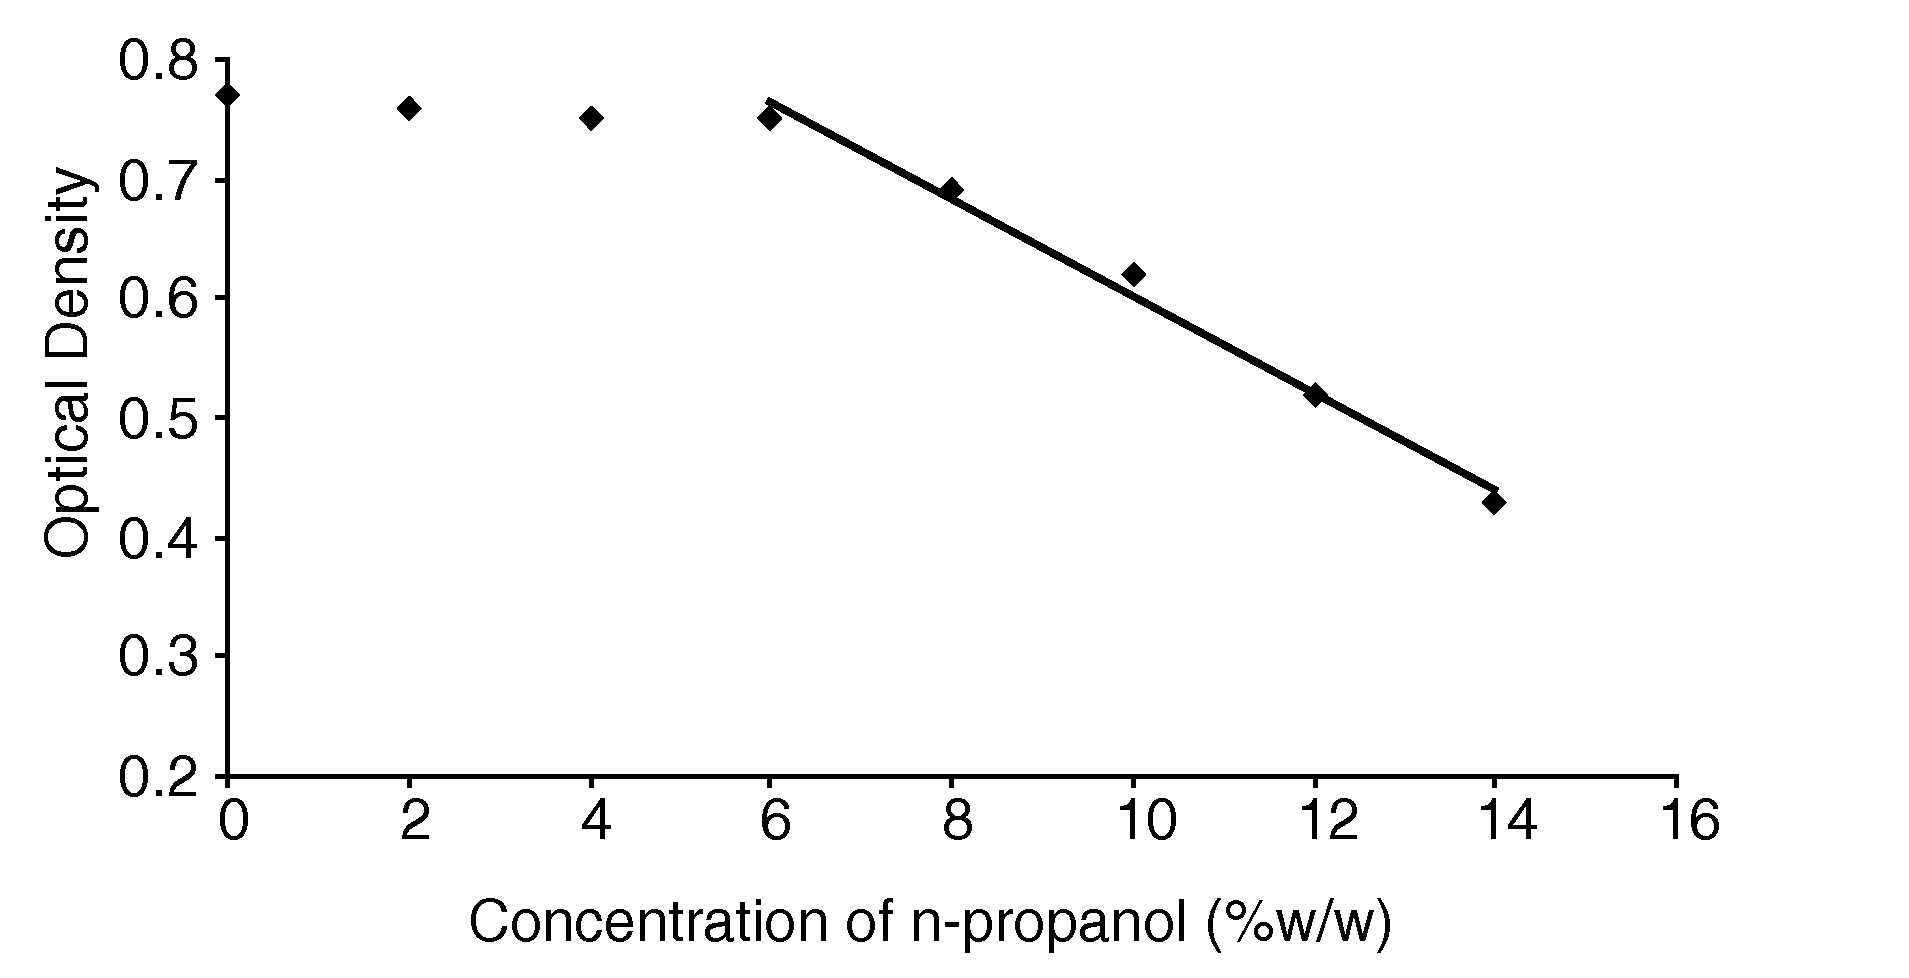
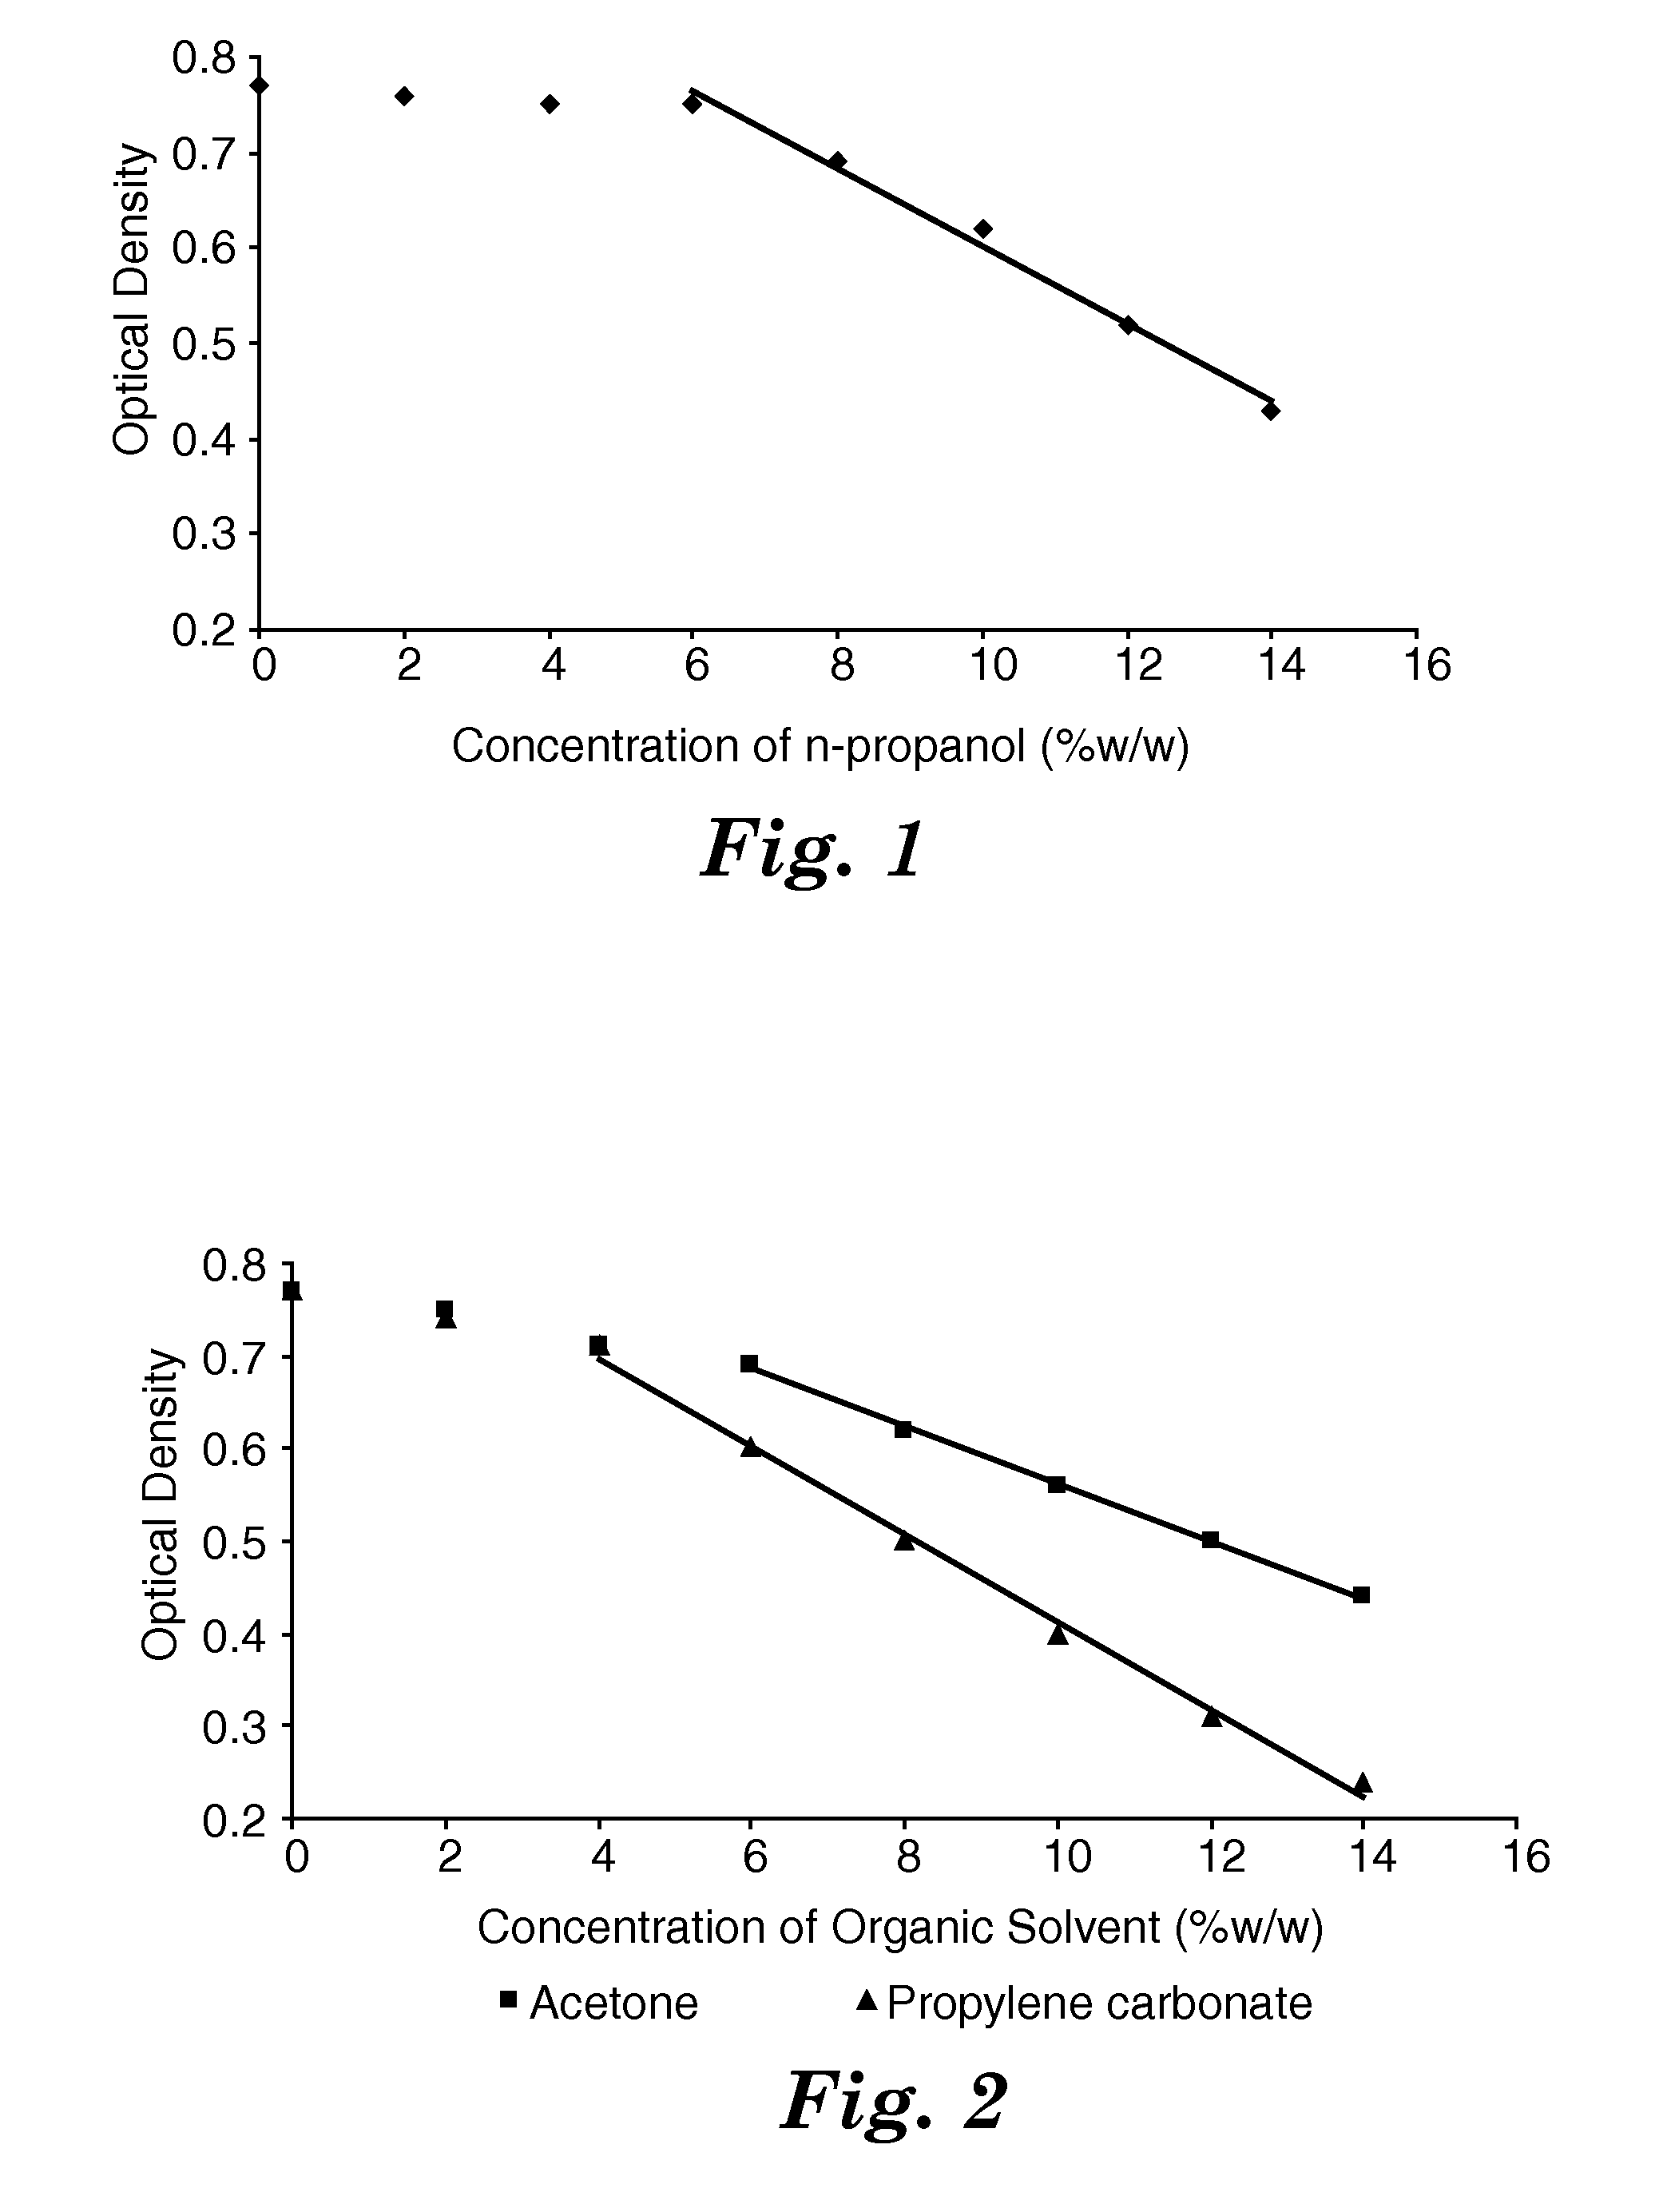
[0127]Aqueous solutions of n-propanol (obtained from Aldrich Chemicals) were prepared in a range of concentrations from 0% w / w to 14% w / w. Chemical indicator test strips of the type described in Example 1 were prepared and immersed with mild agitation in these solutions for 15 seconds each. Each strip was then removed from solution, quickly blotted using gentle pressure on an absorbent paper towel, and the optical density immediately measured on a MacBeth RD917 densitometer using the green filter setting. A gradual decrease in color intensity could be visually distinguished with an increase in propanol concentration.
[0128]The results are graphically represented in FIG. 1 illustrating that the optical density of the indicator is linearly related to the aqueous concentration of indicator above a concentration of about 6%.
example 3
Use of the Indicator in Example 1 for Low Vapor Pressure and High Vapor Pressure Solvents
[0129]Aqueous solutions of acetone and propylene carbonate (both obtained from Aldrich Chemicals) were prepared in a range of concentrations from 0% w / w / to 14% w / w. Chemical indicator test strips of the type described in Example 1 were prepared and immersed with mild agitation in these solutions for 15 seconds each. Each strip was then removed from solution, quickly blotted using gentle pressure on an absorbent paper towel, and the optical density immediately measured on a MacBeth RD917 densitometer using the green filter setting. A gradual decrease in color intensity could be visually distinguished with an increase in solvent concentration.
[0130]The results are graphically represented in FIG. 2, showing that even though propylene carbonate has a much lower vapor pressure (0.03 mm Hg at 20° C.) than acetone (185 mm Hg at 20° C.), it exhibits a higher change in optical density per unit concentrat...
PUM
| Property | Measurement | Unit |
|---|---|---|
| vapor pressure | aaaaa | aaaaa |
| temperature | aaaaa | aaaaa |
| temperature | aaaaa | aaaaa |
Abstract
Description
Claims
Application Information
 - R&D
- Intellectual Property
- Life Sciences
- Materials
- Tech Scout
- Unparalleled Data Quality
- Higher Quality Content
- 60% Fewer Hallucinations
Browse by: Latest US Patents, China's latest patents, Technical Efficacy Thesaurus, Application Domain, Technology Topic, Popular Technical Reports.
© 2025 PatSnap. All rights reserved.Legal|Privacy policy|Modern Slavery Act Transparency Statement|Sitemap|About US| Contact US: help@patsnap.com


