
System of analyzing protein modification with its band position of one-dimensional gel by the mass spectral data analysis and the method of analyzing protein modification using thereof

a technology of mass spectral data and protein modification, which is applied in the field of system of analyzing protein modification with its band position of one-dimensional gel by the mass spectral data analysis and the method of analyzing protein modification using thereof, can solve the problems of not being able to distinguish between the three possible cases, and not being able to analyze the mass of a protein that exists in different status in the same sample, so as to facilitate quantitative analysis of modified proteins, simplify the complex one-dimensional gel protein pattern

Inactive Publication Date: 2009-05-28
KOREA BASIC SCI INST
View PDF4 Cites 0 Cited by
  • Summary
  • Abstract
  • Description
  • Claims
  • Application Information

AI Technical Summary

Benefits of technology

[0022]d) A filtering means that eliminates the bands exhibiting smaller numbers of peptides compared with the highest numbers of peptides detected on one band by regarding the bands as noise;
[0039]In this analysis system, the protein sequence database of b) is preferably IPI_Human protein sequence database, UniprotKB / Swissprot database or NCBl_nr database, but not always limited thereto and each database can be downloaded at the following internet addresses. It is important to sort out wrong spectrums of peptides for the efficient protein identification. Thus, to increase the reliability, reverse sequence database can also be used together.
[0049]In the method of analyzing protein modification, the tandem mass spectrums obtained in step 1) are preferably analyzed by human protein database IPI_Human protein sequence database, UniprotKB / Swissprot database or NCBI_nr database, but not always limited thereto and those databases can be downloaded at the above addresses. To increase the reliability, reverse sequence database can be used together.
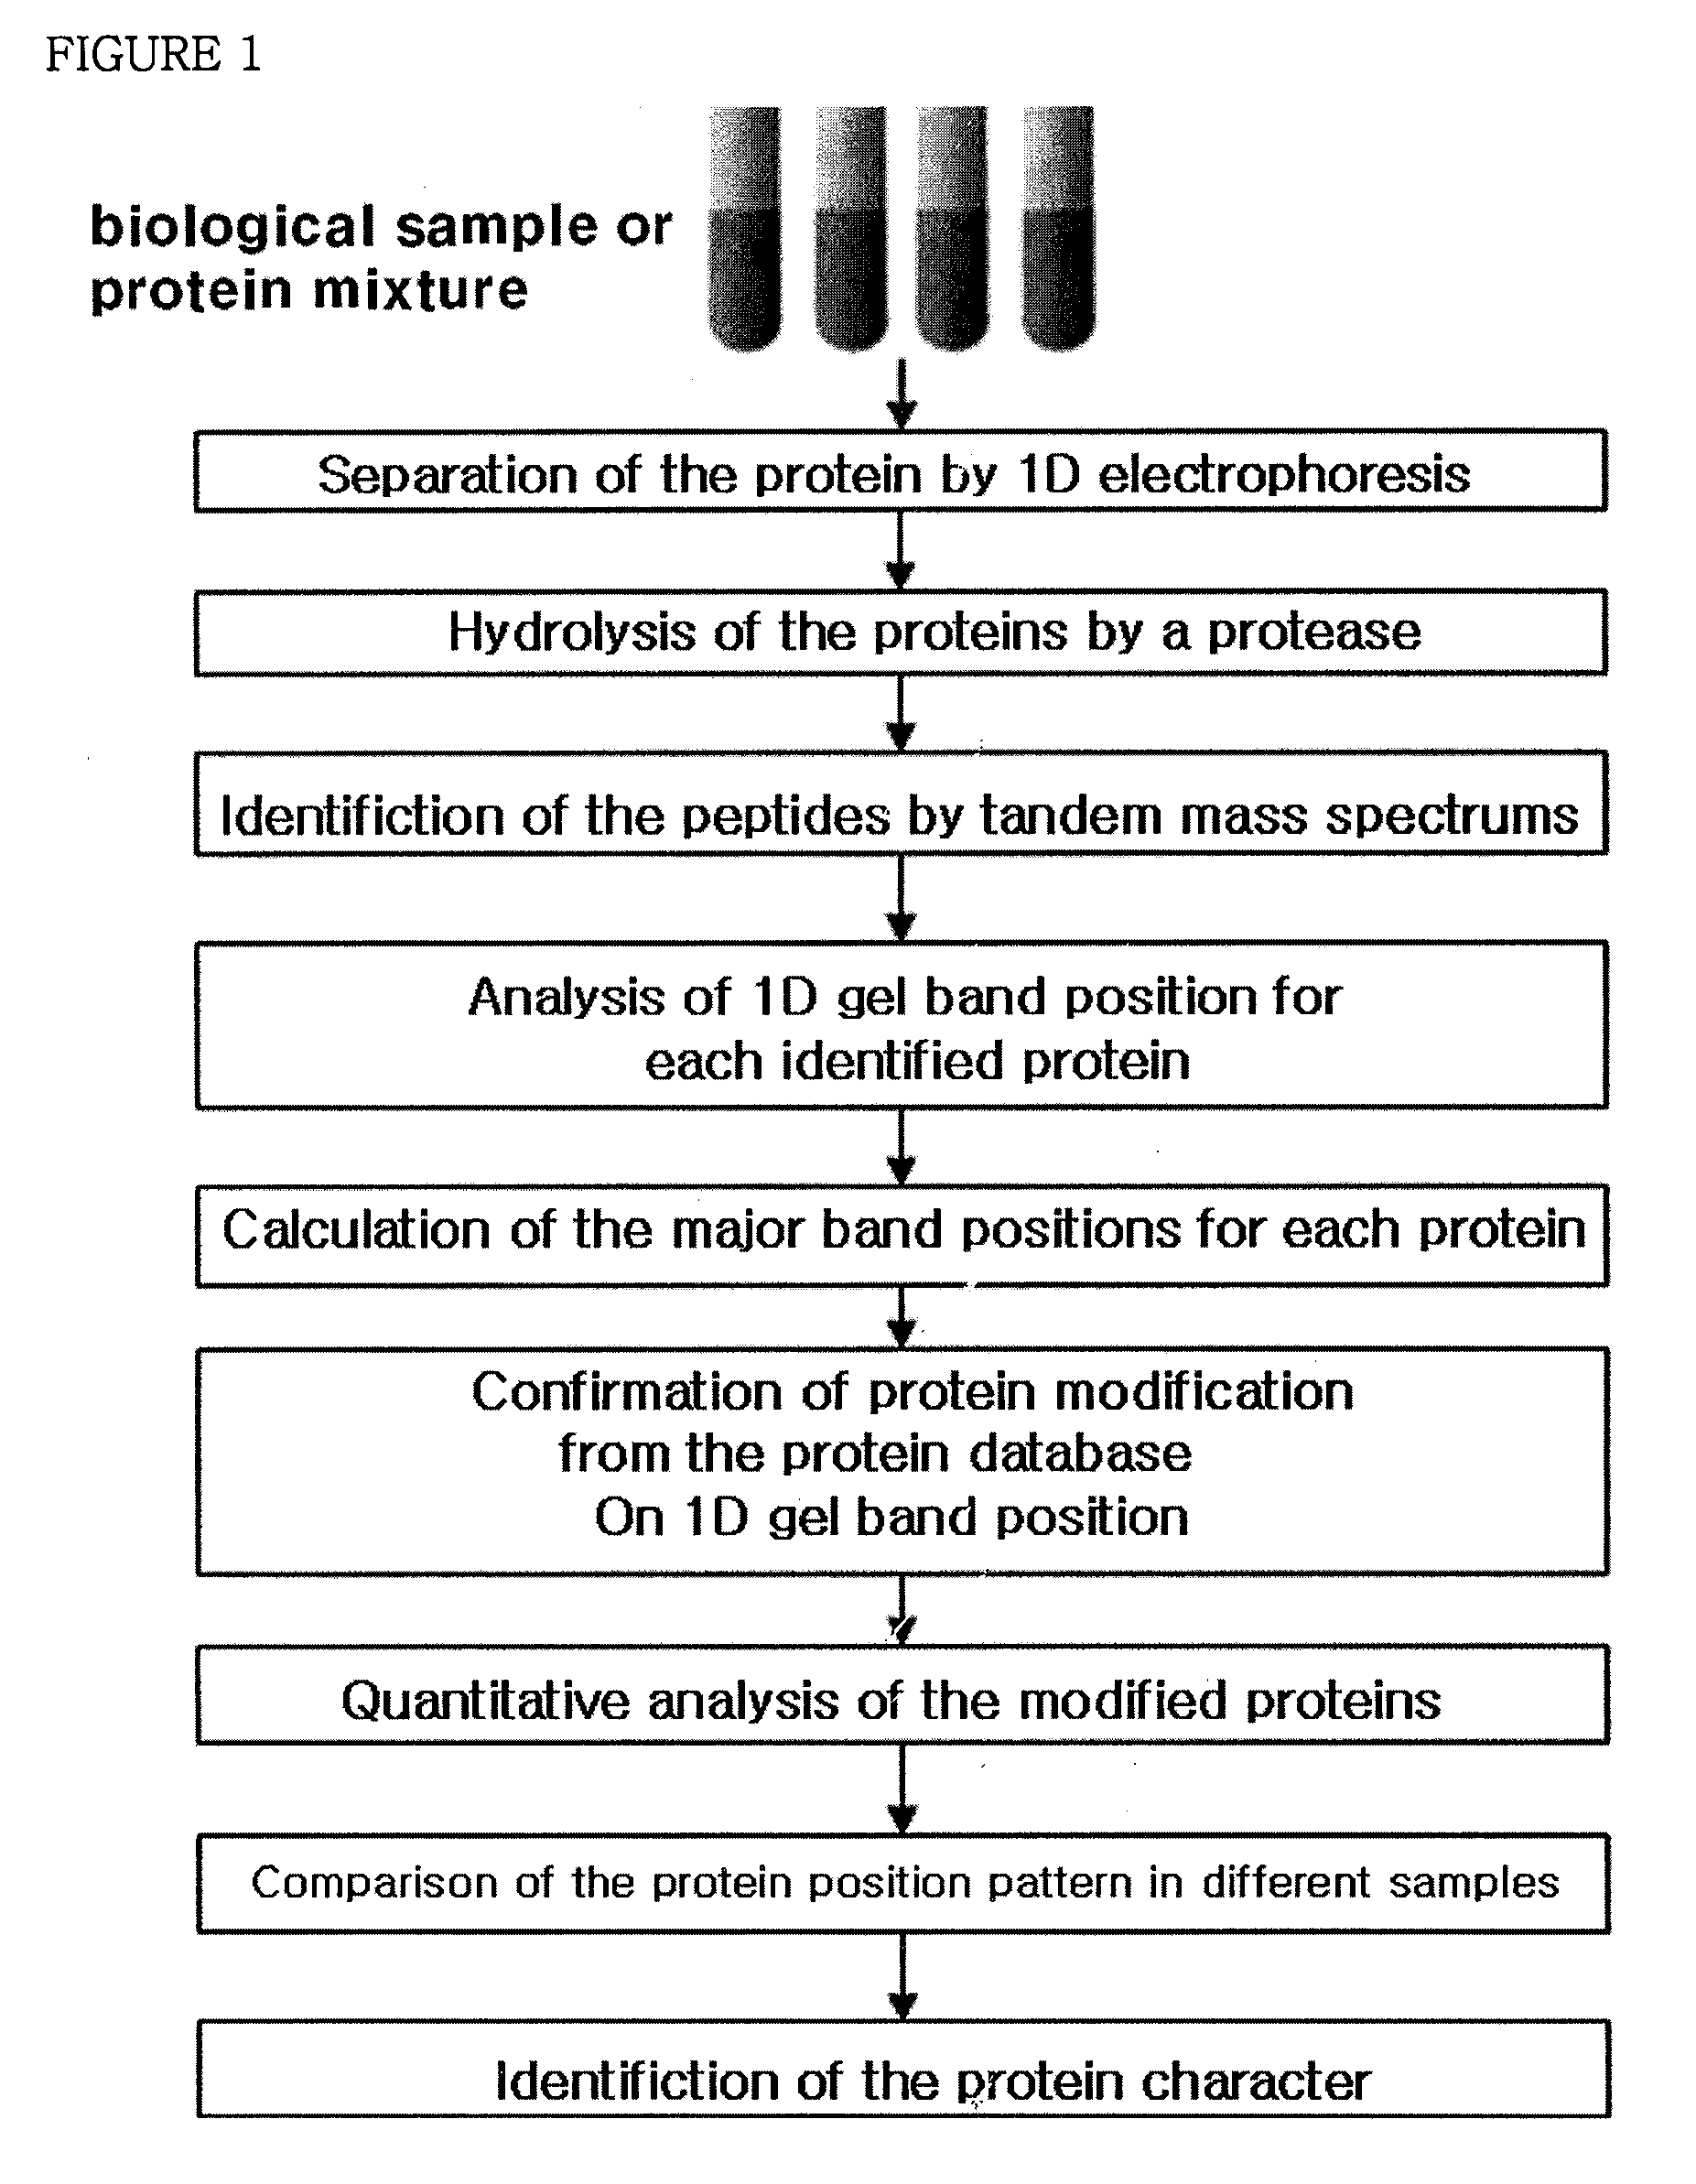
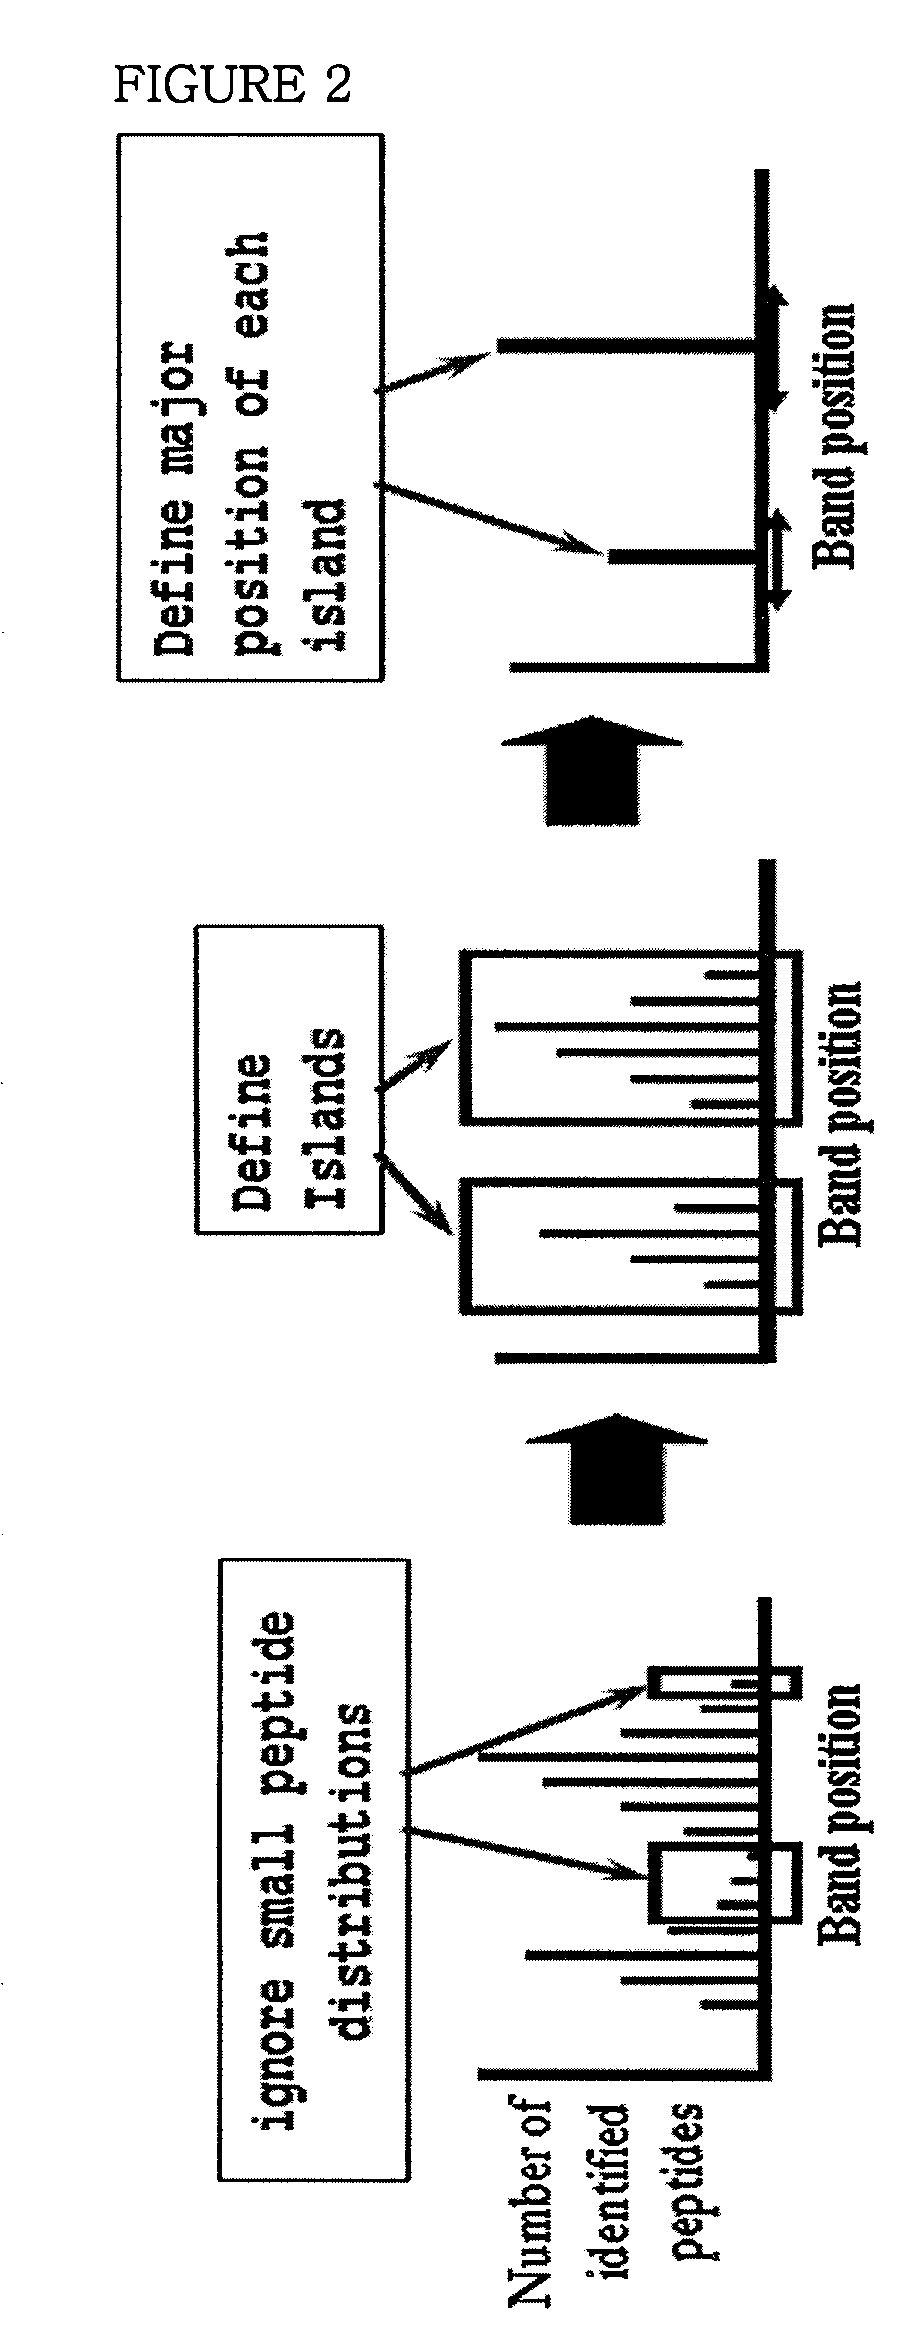
[0052]In the method of analyzing protein modification, the distribution map of step 3) is made as follows; among identified bands, the band with highest identified peptide population is selected and any band determined to contain less than 10% peptides compared with the highest peptide band is considered as noise and thus eliminated (step 4). Peptide identification rate is calculated by dividing the number of peptides identified in each band by the total number of peptides (step 5) and if peptides are identified in consecutive bands, they are grouped in one and named as cluster. The band exhibiting the highest peptide rate in each cluster is determined to be the representative band position and each cluster is indicated as ‘island’ (step 6). The islands can simplify the complicated protein patterns of one-dimensional gel (see FIG. 2).
[0053]The dispersion degree of step 8) represents protein dispersion based on the representative band positions of islands originated from same protein and peptide rate, which is calculated by I-score (IScore; see FIG. 3) of the above mathematical formula 1. This dispersion degree facilitates quantitative analysis of modified proteins. If a protein has only one island, I-score will be 0. However, proteins digested or modified by any enzyme before proceeding to one-dimensional gel electrophoresis have multiple numbers of islands and thus the value of I-score increases. Thus, if I-score of a protein is low but the size of an island is big, this protein is expected to be highly abundant. I-score increases when a protein is dispersed in several bands far from each other, while I-score is 0 when a protein is crowded in one place. Therefore, I-score can be effectively used for quantitative analysis of protein dispersion. In general most proteins have low I-scores and smaller islands, indicating that they are well-localized in the 1D-SDS gel.
[0065]The islands and I-score can be efficient to give simple explanations on the complicated protein modifications. Therefore, along with MWcorr, the maps of identified proteins (see FIG. 4-FIG. 7) from various samples can contribute to many interesting biological studies including alternative splicing, endoproteolytic process or posttranslational modification (PTM).MWcorr=logMWexplogMWcal[MathematicalFormula2]

Problems solved by technology

However, there has been no method to distinguish these three possible cases by analyzing the experimental result.
However, the method for mass analysis by isotope treatment was basically designed to analyze the mass of a protein which was equally modified but found in different samples, so it cannot be used for mass analysis of a protein that exists in different status in the same sample.
The mass analysis with mass spectrums using a specific marker for a protein in a standard sample (US 2006 / 0078960) is also limited to the analysis of proteins especially when the amounts of proteins in a sample are similar to that of the standard sample, suggesting that this method is not preferred for the analysis of a protein in different status either.

Method used


Image

  • System of analyzing protein modification with its band position of one-dimensional gel by the mass spectral data analysis and the method of analyzing protein modification using thereof
  • System of analyzing protein modification with its band position of one-dimensional gel by the mass spectral data analysis and the method of analyzing protein modification using thereof
  • System of analyzing protein modification with its band position of one-dimensional gel by the mass spectral data analysis and the method of analyzing protein modification using thereof

Examples


example 2

Analysis of Protein Modifications in Different Species

[0093]Protein identification and island analysis were performed with human brain tissues and Pseudomonas putida KT2440 bacteria by the same manner as described in Example 1, the experiment with human serum samples. But in this example, human brain tissue samples proceeded to one-dimensional electrophoresis and 40 bands were separated from one-dimensional gel. Each band was treated with trypsin and then peptide identification was performed by using fused-silica tubing (Phenomenex, USA) filled with 10 cm of Aqua 5μ C18 with a mass spectrometer (LT LTQ / MS, Linear Ion Trap Mass Spectrometer, Thermo Electron Corp., USA). 42 bands were extracted from the bacteria samples and the peptide mixture hydrolyzed with trypsin was inputted in 250 μm tubing (UK) filled with 2-3 cm of SCX cation exchange materials (Whatman column, UK) and then tandem mass spectrums were obtained by a mass spectrometer (LT LTQ / MS, Linear Ion Trap Mass Spectrometer...


PUM


Abstract

The present invention relates to a method of analyzing protein modification. The method of invention for analyzing protein distribution and characteristics on one-dimensional gel provides the way to analyze proteins of samples on one-dimensional gel quantitatively and provides information on interactions among proteins and further can be effectively used for the development of a novel diagnostic and therapeutic method for a disease by screening a disease marker protein.

Description

TECHNICAL FIELD[0001]The present invention relates to a method of analyzing protein modification which provides more specific information on proteome, in the proteomics research identifying proteins based on tandem mass spectrometry.BACKGROUND ART[0002]Biological samples are largely composed of a variety of proteins. The series of separation methods such as one-dimensional SDS-PAGE or liquid chromatography separates proteins or peptides resulted from hydrolysis of the proteins included in those samples. And then the isolated proteins or peptides proceed to tandem mass spectrometry to give tandem mass spectra of peptides. Each amino acid sequence corresponding to each tandem mass spectrum can be screened from protein sequence database and further be identified by integrated analysis. For the screening of such protein or peptide sequences, softwares such as SEQUEST® (Eng et al., J. Am. Soc. Mass Spectrum. 5:976-989, 1994; Thermo Electron Corp., USA), Mascot (Perkins et al., Electropho...

Claims


Application Information

Patent Timeline
IPC IPC(8): G06F19/00G01N33/68
CPCH01J49/004G01N33/6848G01N33/68G01N33/53G01N33/48
Inventor PARK, GUN WOOKKWON, KYUNG-HOONKIM, JIN YOUNGYOO, JONG SHINPARK, YOUNG MOKKIM, SEUNG IL
Owner KOREA BASIC SCI INST
Learn More