

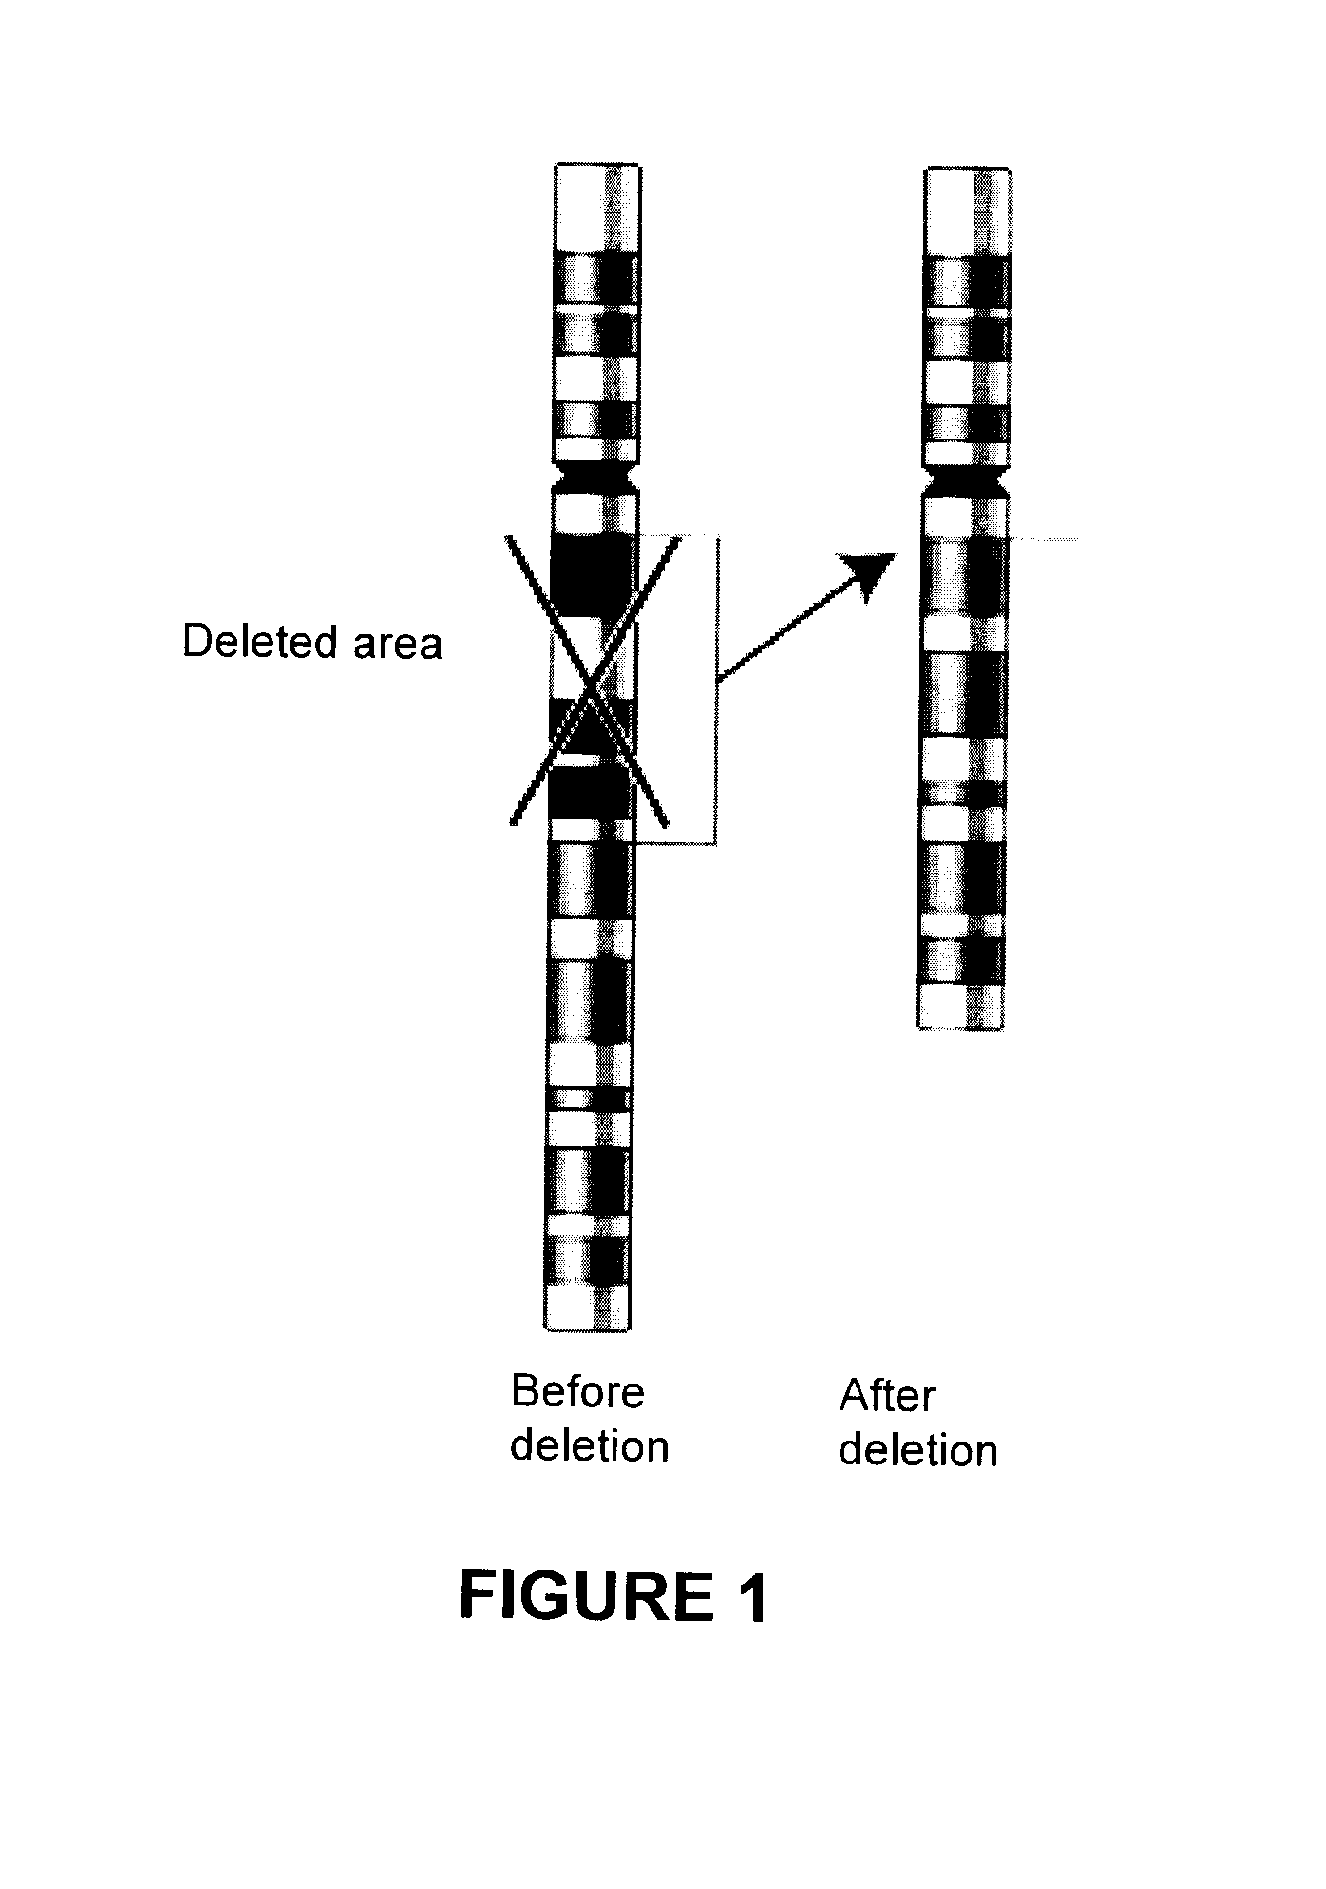
Methods, probe sets, and kits for detection of deletion of tumor suppressor genes by fluorescence in situ hybridization
a tumor suppressor gene and fluorescence in situ hybridization technology, applied in the field of methods, probe sets, kits for detection of tumor suppressor gene deletion by fluorescence in situ hybridization, can solve the problems of difficult or impossible to obtain representative samples of metaphase cells from samples used for retrospective analysis, affecting the performance of fish-based tumor suppressor gene deletion assays, and difficult or impossible to call deletions
- Summary
- Abstract
- Description
- Claims
- Application Information
AI Technical Summary
Benefits of technology
Problems solved by technology
Method used
Image

Examples
example 1
Analysis of Copy Number Variation, Segmental Duplication, and Comparative Genomic Hybridization Data for Chromosome 10; Probe Site Selection
[0285]CGH data from Liu et al., Nat. Med. 2009; 15:559-65 were analyzed in silico. In silico copy number analysis of the chromosome 10q region in 58 metastatic CaP samples from 14 patients (Liu W et al. Copy number analysis indicates monoclonal origin of lethal metastatic prostate cancer, Nat. Med. 2009; 15:559-65) was performed applying rank segmentation, with a significance threshold of 1.0×10⁻⁶ and a minimum of 5 probes per segment (Nexus Copy Number v.4; BioDiscovery, El Segundo, Calif.). Genomic imbalances were assigned as either gain [log( 3 / 2) or threshold of 0.2] or loss [log(½) or threshold of −0.3], each determined by two Copy Number Transitions (CNTs), as defined by Ferreira B I et al., Array CGH and gene-expression profiling reveals distinct genomic instability patterns associated with DNA repair and cell-cycle checkpoint pathways in...
example 2
Three-Color FISH with a Sample Having a Homozygous PTEN Deletion
[0292]Metaphase chromosomes from cells of the PC3 cell line (Beheshti B et al., Evidence of chromosomal instability in prostate cancer determined by spectral karyotyping (SKY) and interphase fish analysis, Neoplasia 2001; 3:62-9) were fixed and hybridized with three distinguishably labeled probes prepared using the RP11-420K10 BAC, with a hybridization site at 10q23.2 (labeled green); the RP11-246B13 BAC, with a hybridization site at 10q25.1 (labeled red); and RP11-846G17, with a hybridization site at PTEN (labeled aqua). The chromosomes were also counterstained with DAPI (blue). Images in the red, green, aqua, and blue channels were obtained by fluorescence microscopy. Images from a representative set of chromosomes are shown in FIG. 8, in which four FISH signals were visible in the green and red channels (panels A and B). There were 4 FISH signals since the diploid genome has been replicated but not yet segregated at ...
example 3
Deletion Mapping by Four-Color Interphase FISH
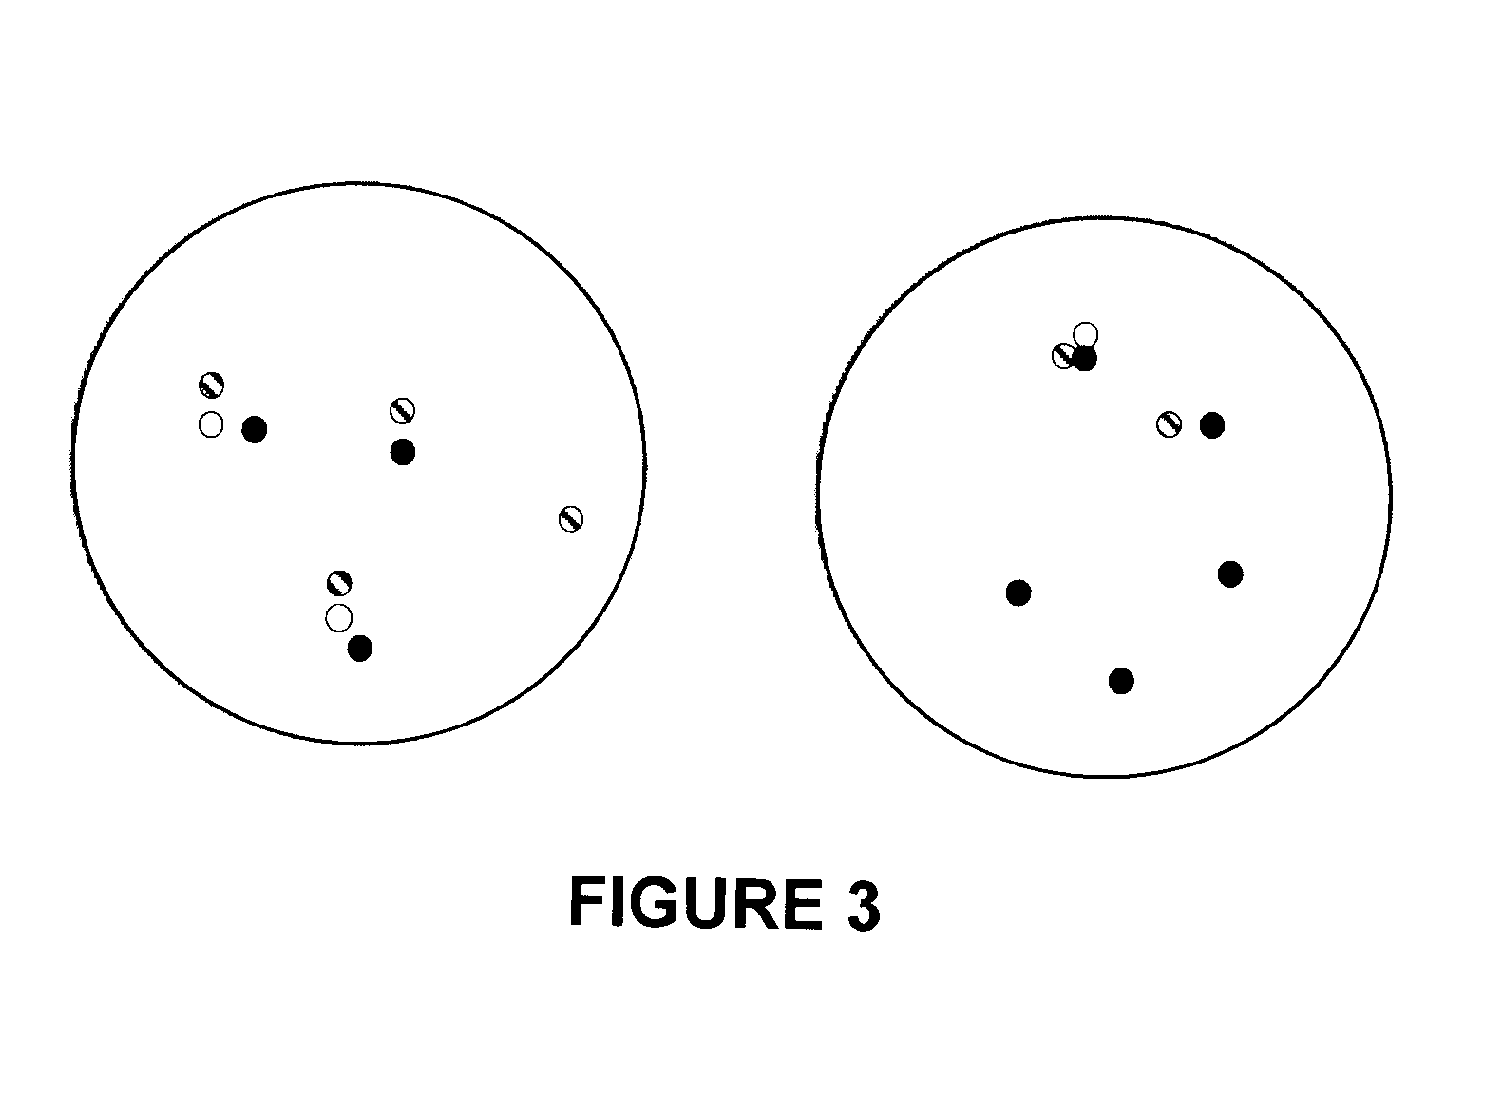
[0293]Four color interphase FISH was performed on 132 samples of cancerous prostate tissue deleted for at least one copy of PTEN. The 132 samples were a subset of 330 cancerous prostate clinical tissue samples taken at McGill University and the University of Toronto. Details about these samples appear in the tables below.
[0294]Breakdown of the Total 330 Patients
Radical Prostatectomies134 (41%)Hormone refractory / Metastatic tumors196 (59%)Total330
[0295]Breakdown of the 132 Samples with a Hemi- or Homozygous PTEN Deletion
Radical Prostatectomies86Hormone refractory / Metastatic tumors46Total132
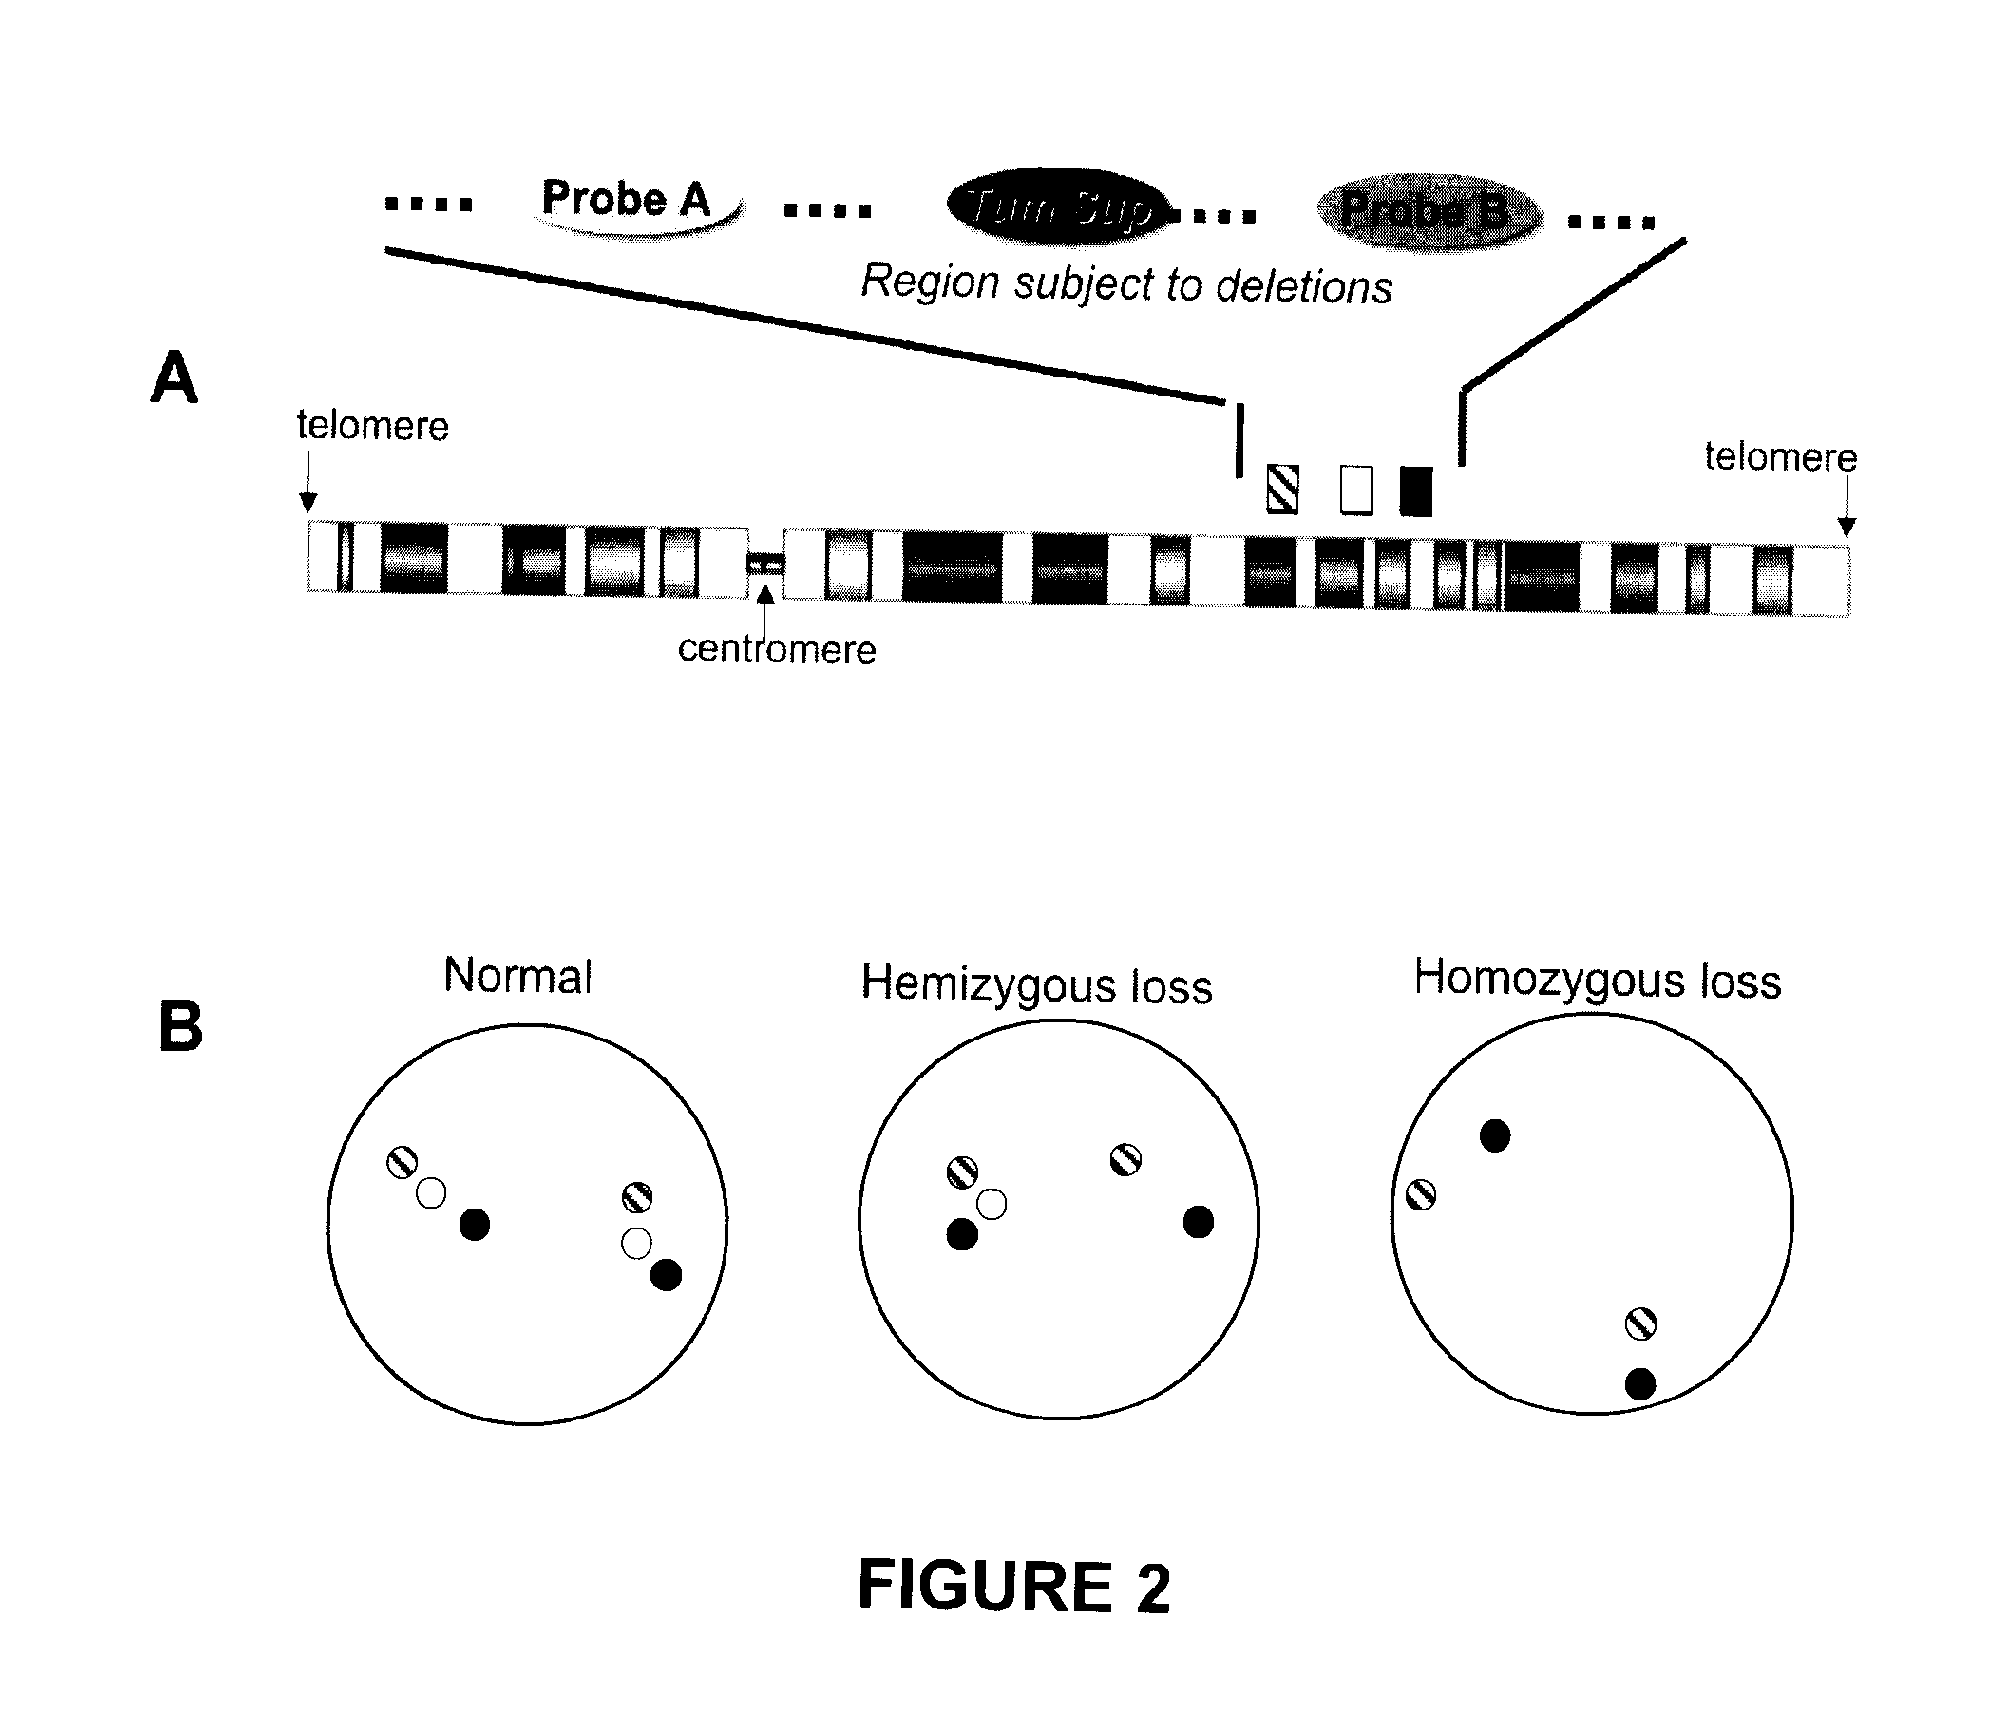
[0296]The probes used were a probe derived from the BACs RP11-141D8 and RP11-52G13 (“probe A”; hybridization site centromeric to PTEN); a PTEN probe derived from the BAC RP11-846G17; and a probe derived from the BACs RP11-399O19 and RP11-360H20 (“probe B”; hybridization site telomeric to PTEN). The probes were labeled with distinguishable fluorophores by...
PUM
| Property | Measurement | Unit |
|---|---|---|
| diameter | aaaaa | aaaaa |
| thickness | aaaaa | aaaaa |
| pH | aaaaa | aaaaa |
Abstract
Description
Claims
Application Information