Spectral imaging system for remote and noninvasive detection of target substances using spectral filter arrays and image capture arrays
- Summary
- Abstract
- Description
- Claims
- Application Information
AI Technical Summary
Benefits of technology
Problems solved by technology
Method used
Image
Examples
example 1
Detection of Water
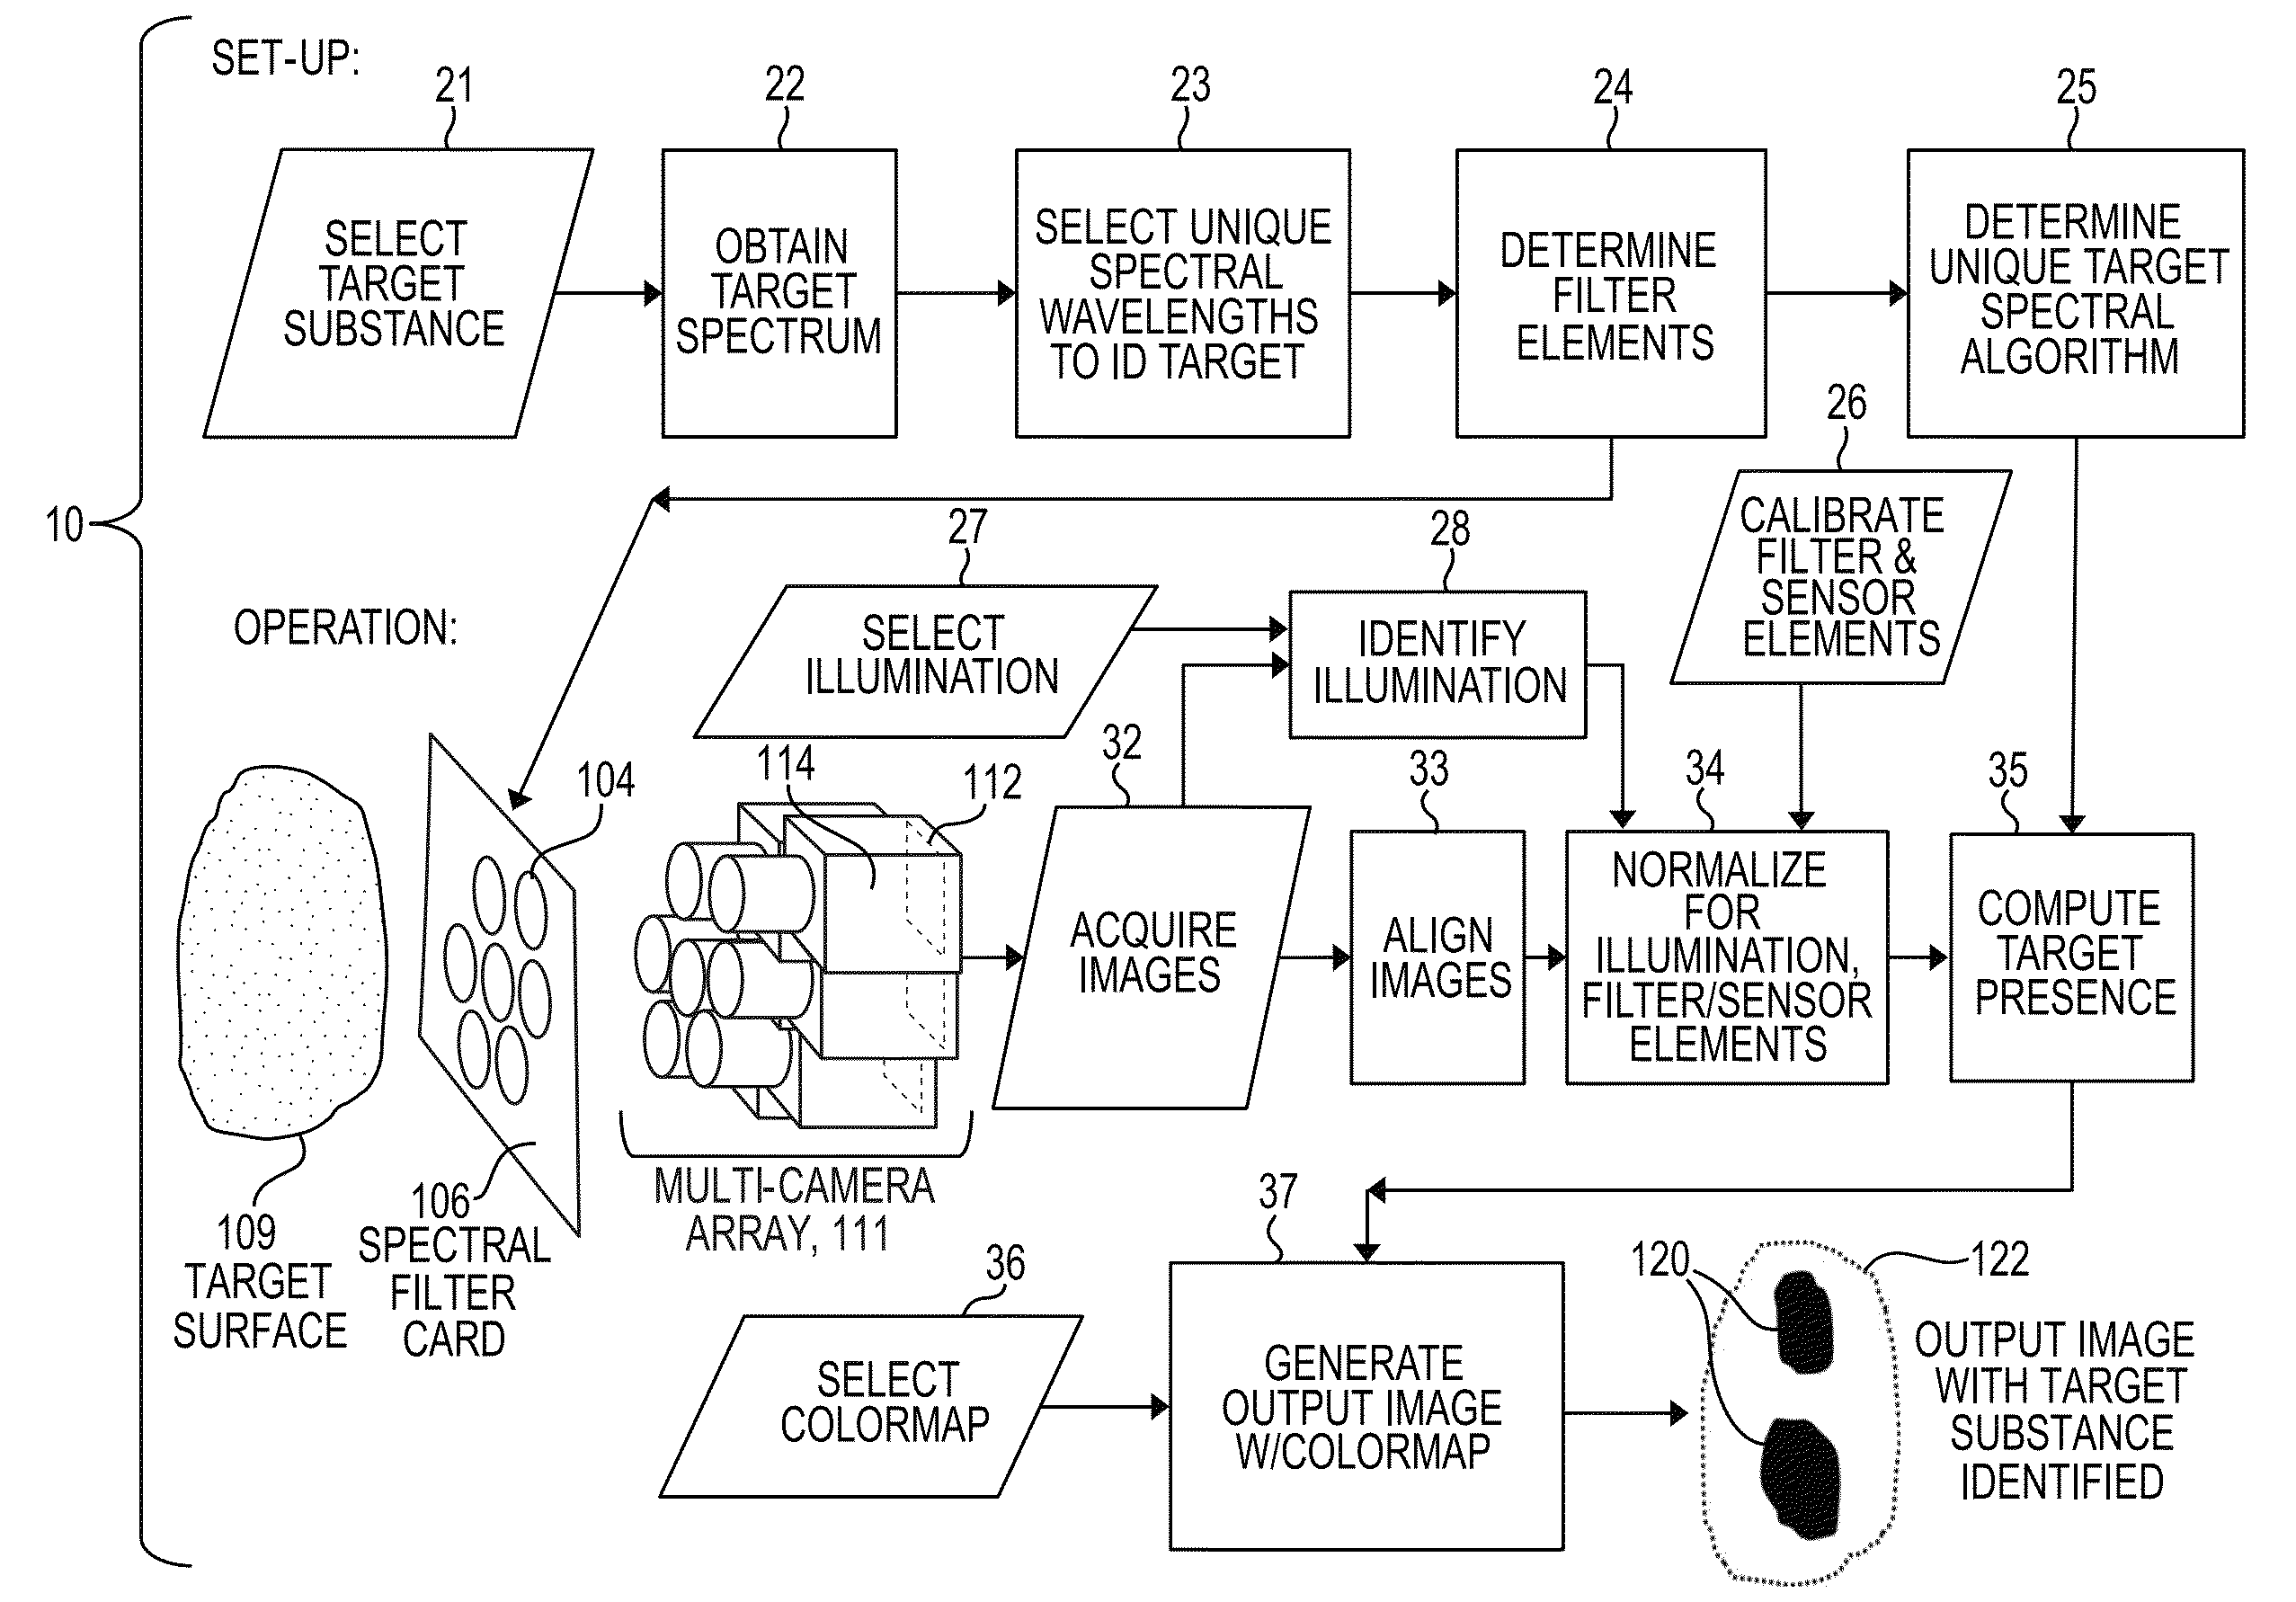
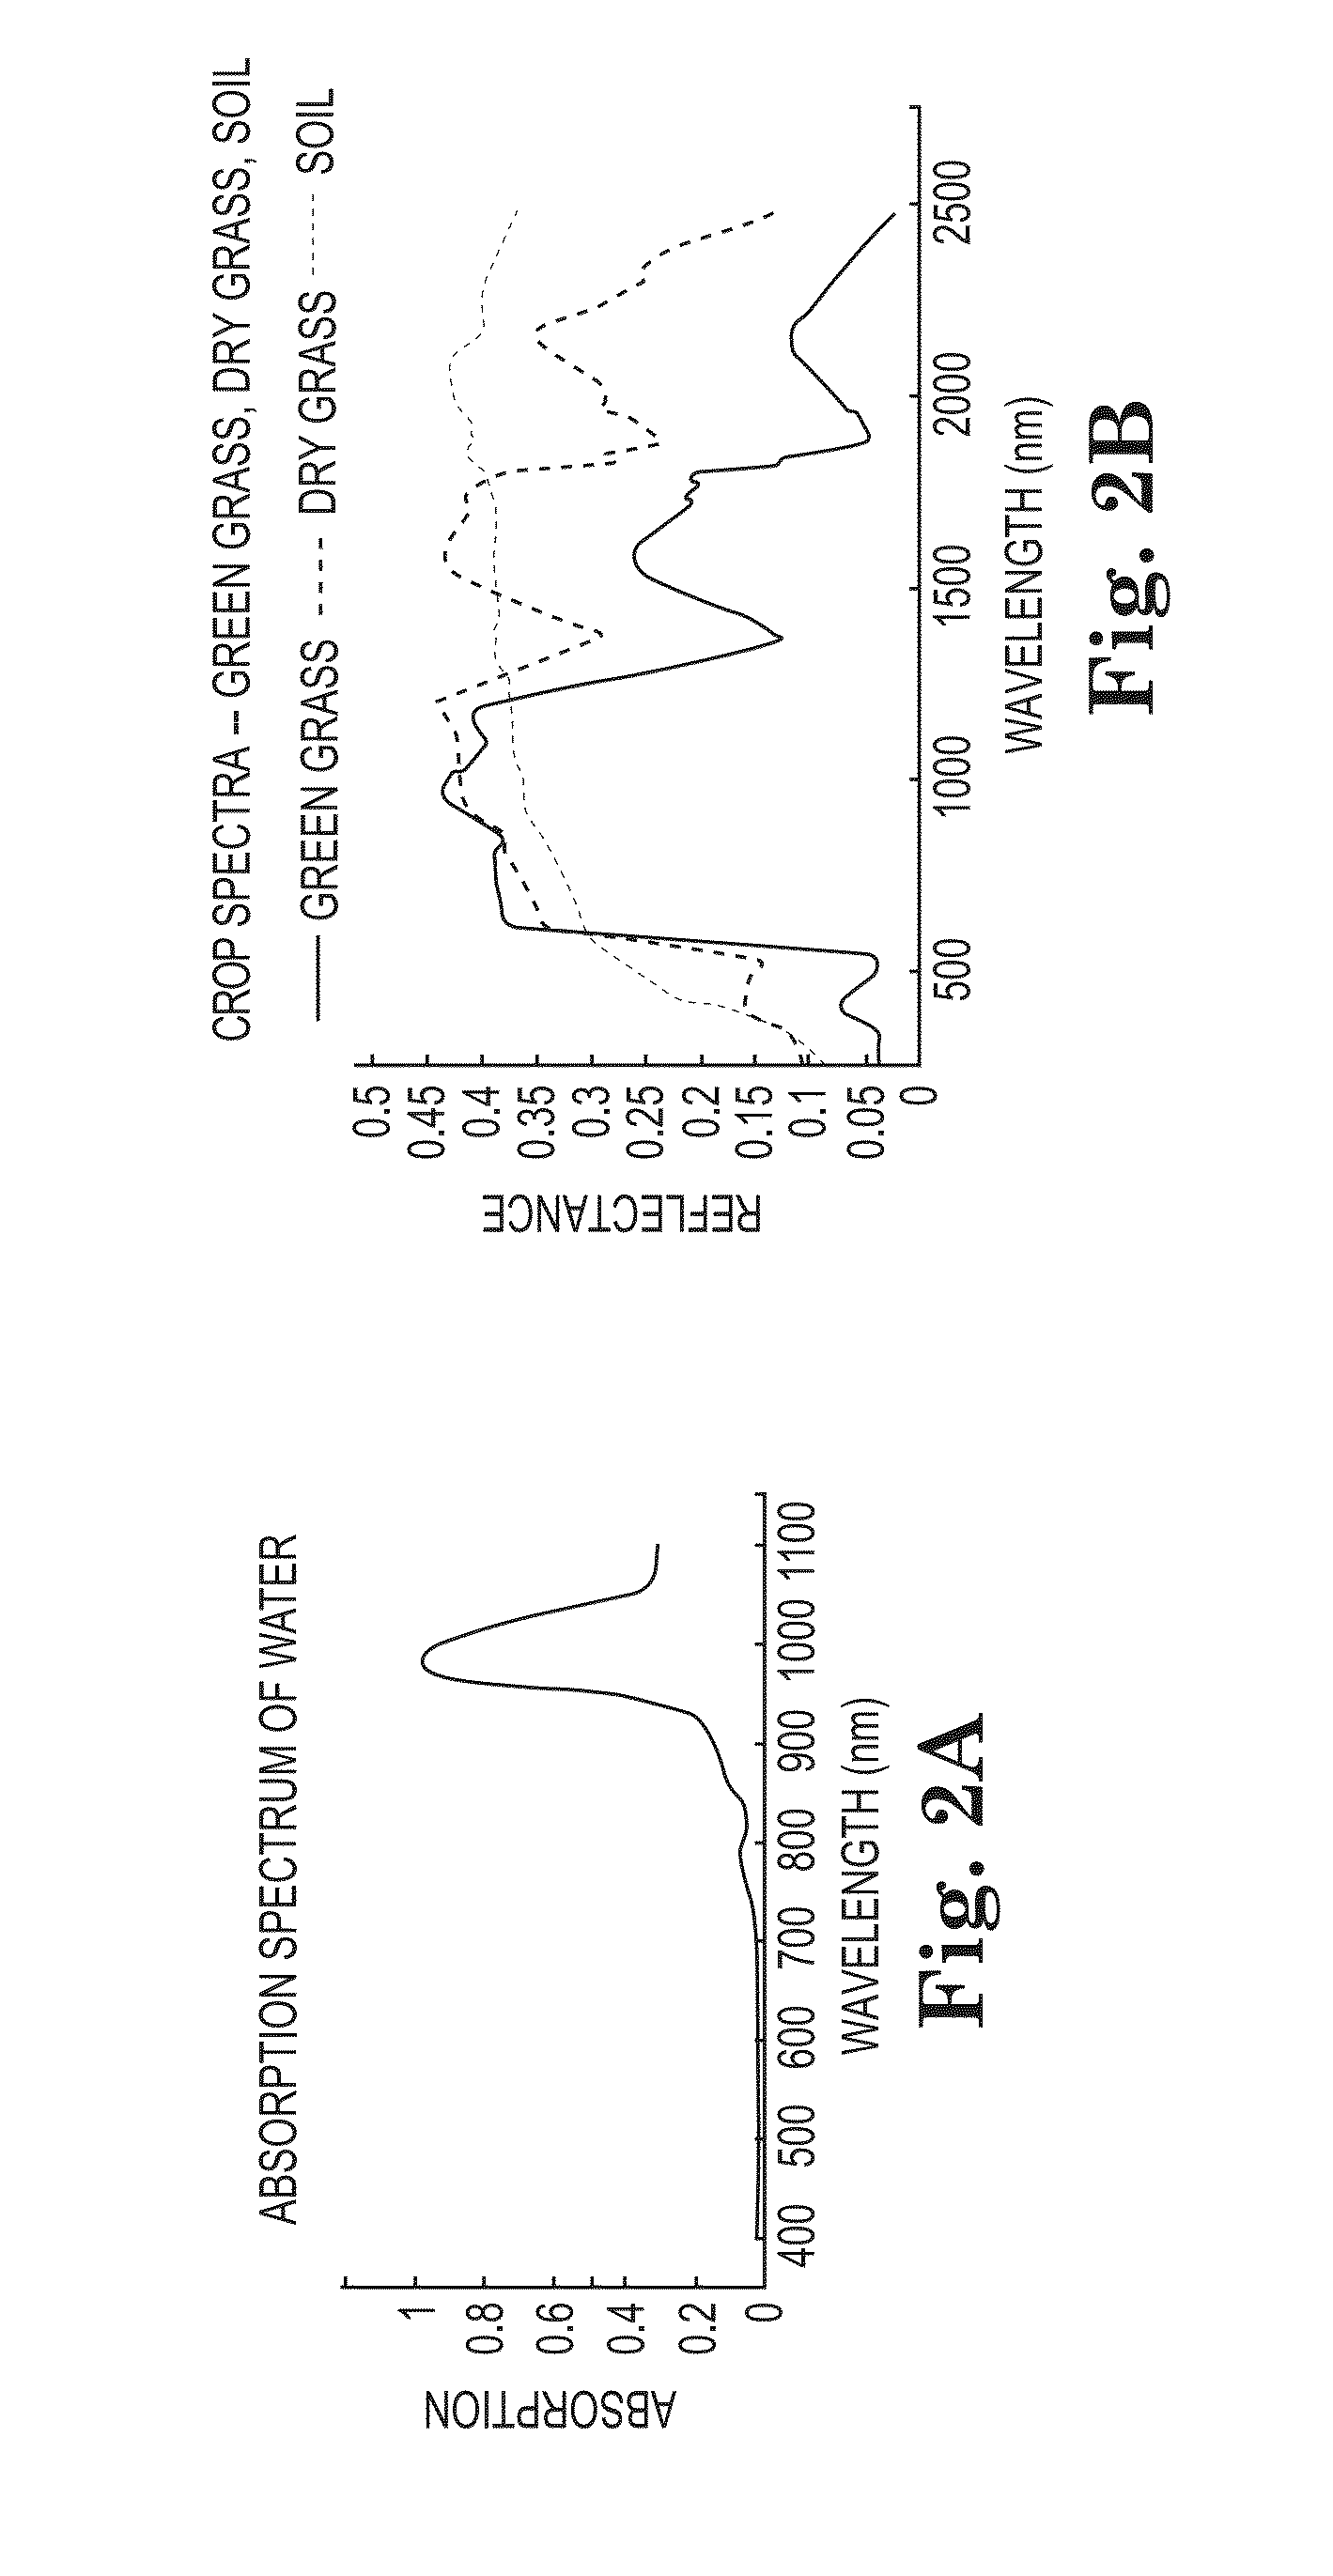
[0458]Referring to FIGS. 25A to 25E, the principles of the present invention are illustrated by an example having two glass vessels partially filled with water that are within the field of view of a spectral imaging system of the present invention. The system is used to detect the presence of water in the two vessels. In each of FIGS. 25A through 25E, the vessel on the left is a round drinking glass. The vessel on the right is a square glass flower vase with a bottom of non-uniform thickness. It is desired to generate a display image that shows the position of the water within each vessel, as well as an indication of the spatial position of objects within the field of view. FIG. 25A is a ‘full spectrum’ image taken with the narrower visible spectrum filter removed (typically included with digital cameras); FIG. 25B is an NIR detection image, sensitive to a narrow bandwidth centered on the absorption peak of water at 980 nm. FIG. 25C is a spectral reference image ce...
example 2
Hyperspectral Imaging for Obtaining Reference Spectral Information
[0467]This example shows how spectral information determined by hyperspectral studies may be useful to the present invention in helping to select the center wavelengths of the filter array elements for detection of a particular target substance.
[0468]This study was performed with respect to durum wheat, triticale, and barley. FIG. 28A shows spectra obtained with FOSS instruments showing the position of the selected wavelengths on the average spectra for the three grain types. From these spectra, it is determined that spectral characteristics of barley at 1110 and 1470 nm could be used to distinguish barley from the other two grains. FIG. 28B shows a custom colormap applied to the ratio values at these two wavelengths. FIG. 28C shows the resulting spatial image with detected areas indicating the ratio of the selected spectral amplitudes. The top row of images corresponds to wheat, the middle row to barley, and the bott...
example 3
Egg Inspection
[0471]As an example of the flexibility of the present invention, egg spectral data of U.S. Pat. No. 4,182,571 (issued 1980) are used to select filter wavelengths and determine an algorithm to discriminate between good and defective eggs. While U.S. Pat. No. 4,182,571 teaches an optical system to obtain a single measurement per egg using three wavelengths, the present invention permits a high resolution image of each egg using two wavelengths implemented in the fashion of the present invention, namely, two filter elements on a filter card processing a similar number of high resolution images. Wavelengths of 567 nm and 610 nm are selected based on the spectral information. In this embodiment, the present invention provides an analysis for each pixel in the egg image. The image can be analyzed at lesser resolution if desired.
[0472]This example shows that practice of the present invention may be used to discriminate between good and defective eggs. As compared to U.S. Pat....
PUM
 Abstract
Description
Claims
Application Information
 - R&D
- Intellectual Property
- Life Sciences
- Materials
- Tech Scout
- Unparalleled Data Quality
- Higher Quality Content
- 60% Fewer Hallucinations
Browse by: Latest US Patents, China's latest patents, Technical Efficacy Thesaurus, Application Domain, Technology Topic, Popular Technical Reports.
© 2025 PatSnap. All rights reserved.Legal|Privacy policy|Modern Slavery Act Transparency Statement|Sitemap|About US| Contact US: help@patsnap.com


