Method and system for calculation and graphical presentation of drug-drug or drug-biological process interactions on a smart phone, tablet or computer

a technology of biological process and drug-drug interaction, applied in the field of methods and systems of pharmacogenomic data analysis and visualization, can solve the problems of slow implementation of pgx into clinical practice, inability to meaningfully integrate into clinical decision making, and inability to achieve meaningful integration of human mind

Inactive Publication Date: 2017-09-21
BASKYS ANDRIUS
View PDF2 Cites 7 Cited by
  • Summary
  • Abstract
  • Description
  • Claims
  • Application Information

AI Technical Summary

Benefits of technology

[0013]The data entry causes a computer to, or a user causes the computer after entry of the data, to conduct a search of a comprehensive drug database for drugs that have known interactions with the entered genetic variations, and assign a numeric value to each drug, either in aggregate, as a class, or individually, in order to quantify the nature, strength and direction of each interaction (e.g., a CYP enzyme substrate, an enzyme inhibitor, an inducer, a receptor agonist, an antagonist, etc.). The computer's processor sends the assigned numeric values to the computer's output module for their visual presentation to a user as a graph. In some embodiments of the invention, the graph comprises a panel of columns, or any other geometrical structures, whose height (or size or shape, if the outputted graph is not a column graph) corresponds to the assigned numeric values of each drug. The graph can be subsequently further adjusted according to the numeric values assigned to a separately entered list of drugs that represents drugs that the patient is currently taking, which are also known to interact with the patient's genotype, with the goal of facilitating the prospective drug selection by a prescriber on the basis of the totality of drug-gene and drug-drug interactions presented to the user as a visual graph with column heights or a size of any other geometrical form, such as a circle, reflecting the degree of the interaction on any individual prospective drug that is being considered for prescribing.

Problems solved by technology

However, implementation of the PGx into clinical practice has been slow and acceptance of pharmacogenetic testing by prescribers has been wavering [Patel et al, 2014, Hess et al, 2015, Peterson et al 2017].
While these numbers are miniscule compared, for example, to data sets produced by whole exome or whole genome sequencing, they are nearly impossible for a human mind to meaningfully integrate into a clinical decision during a short patient visit, typically ranging from 7 to 15 minutes depending on the specialty.
Furthermore, PGx generated data sets become more complex when interactions with a patient's medications or nutritional supplements are taken into consideration.
Software tools designed for research data analysis are usually geared towards revealing statistical relationships, which is exactly opposite to the clinical setting aiming to address an individual's problems and cannot be successfully used on a routine basis in a clinic environment.
Other existing software tools designed to analyze PGx data often require to enter personally identifiable patient information, potentially opening a possibility for privacy violations or drastically reducing system robustness due to multiple sign-ons.
The FDA does not recommend dose adjustments for EMs, however some studies show somewhat weaker drug effects compared to IMs or PMs.
Clinically this may present as a sudden appearance of side effects associated with a drug that a patient had been taking without problems for some time upon addition of an another drug to the patient's medication regimen.
If prescribed a medication that is metabolized by the affected CYP2D6 enzyme, a PM will likely have unexpectedly higher drug concentration, which could result in drug toxicity.
If such an individual is taking a medication that is metabolized by that enzyme they will have a low drug plasma concentration, which in could make the drug ineffective at regular dosages.
However, since it is not possible to know apriori which medications will the patient be prescribed in a course of his or her lifetime, the 3-level PGx reports may not be directly related to the ongoing treatment issues and therefore may only be of a very limited clinical utility.
Importantly, these reports do not take into account interactions between the medications that the patient may already be taking as well as those that are yet to be prescribed, and the pertinent biological pathways compromised by genetic mutations.
In addition, reading and understanding tabular PGx reports could be prohibitively time-consuming and may require special training in genetics that most prescribers do not have.
Significantly, suitable tools for practitioner education on DNA data application in clinical practice are critically lacking.

Method used


Image

  • Method and system for calculation and graphical presentation of drug-drug or drug-biological process interactions on a smart phone, tablet or computer
  • Method and system for calculation and graphical presentation of drug-drug or drug-biological process interactions on a smart phone, tablet or computer
  • Method and system for calculation and graphical presentation of drug-drug or drug-biological process interactions on a smart phone, tablet or computer

Examples


Embodiment Construction

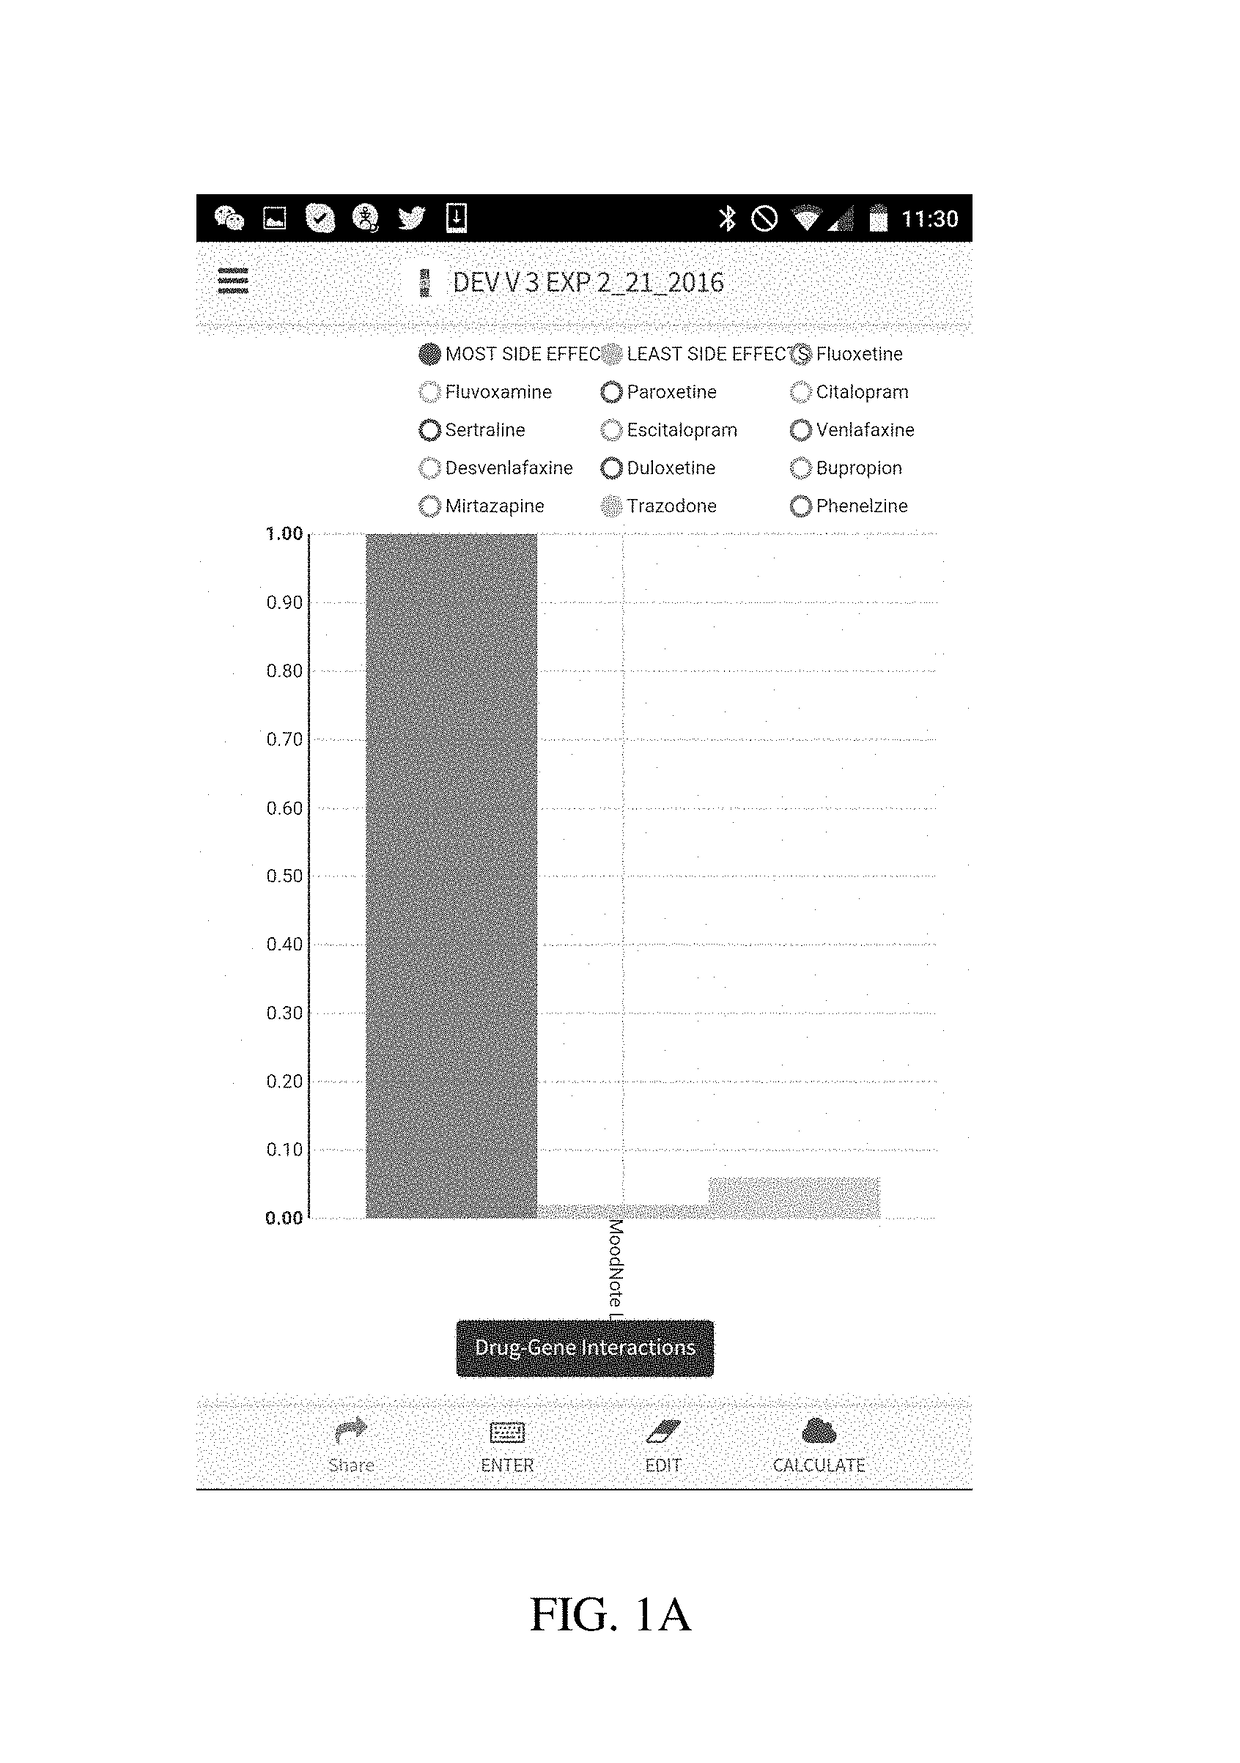
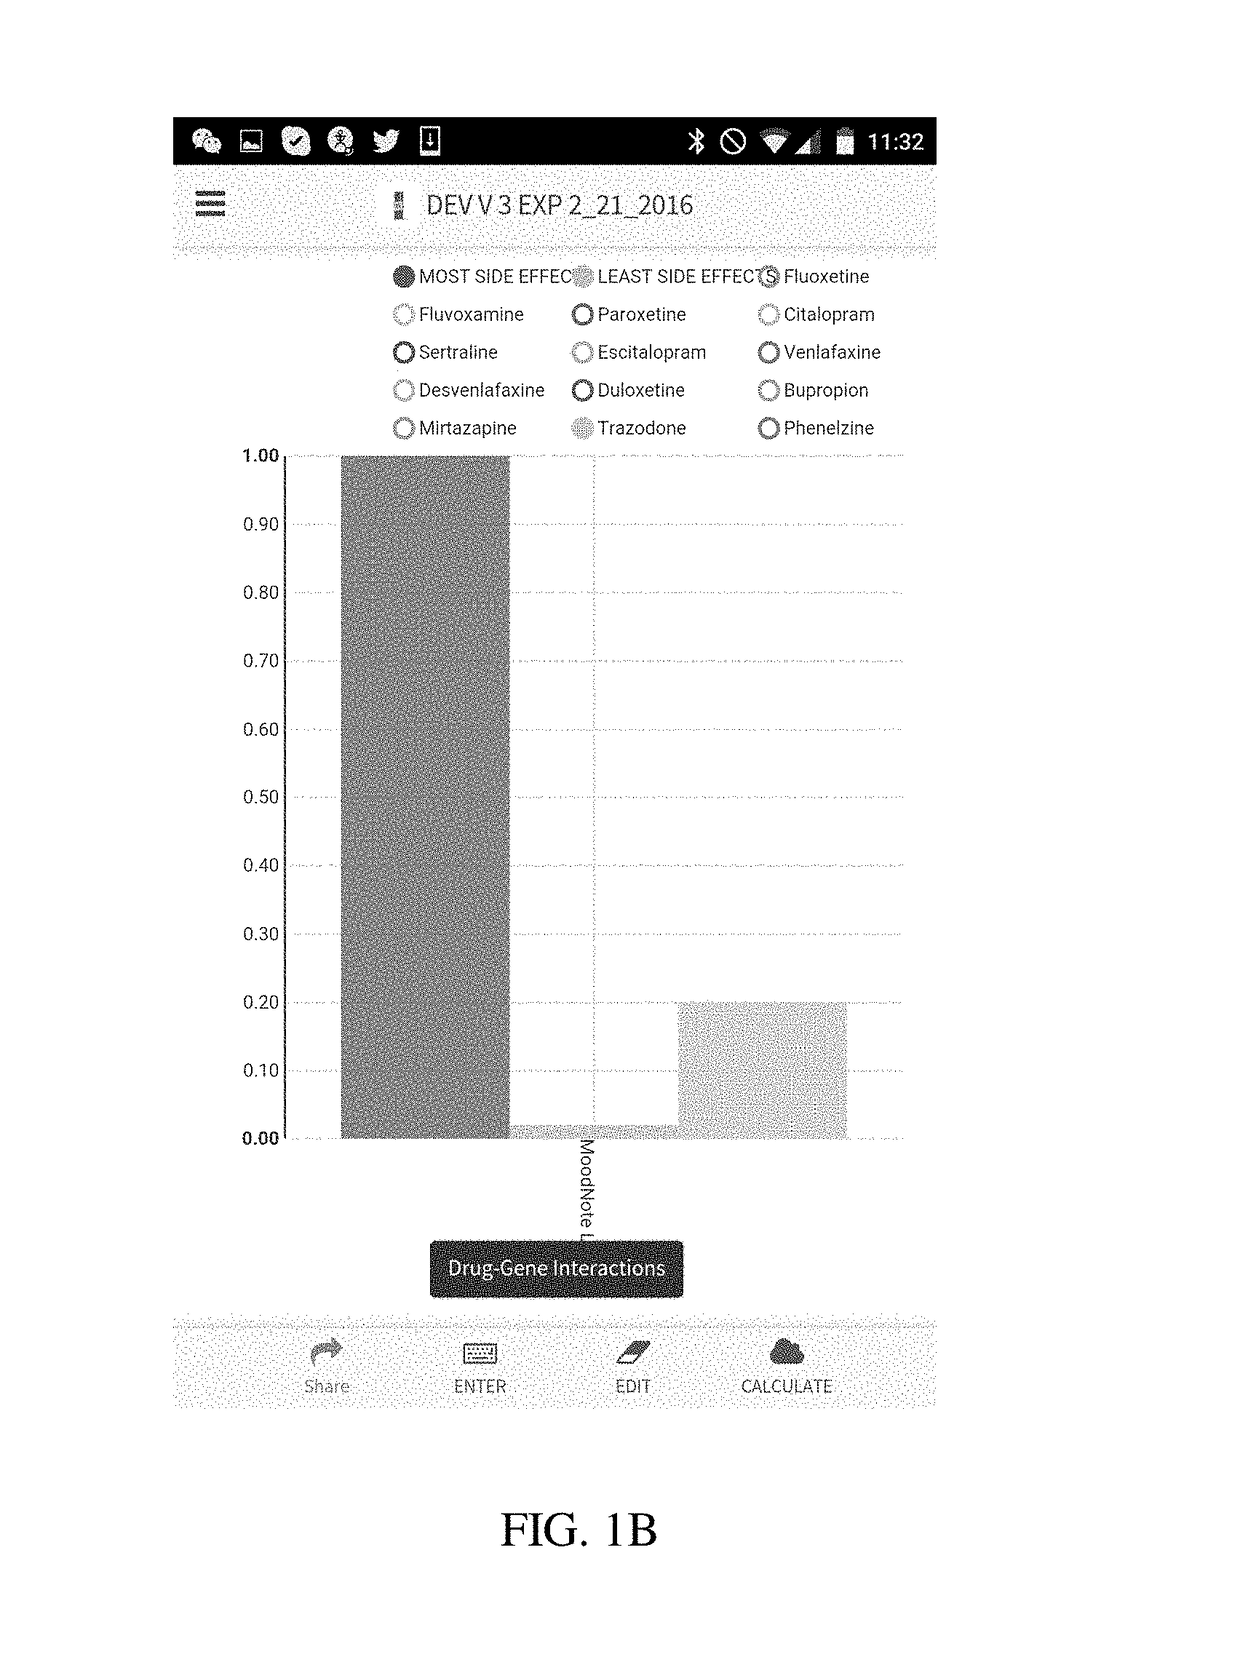
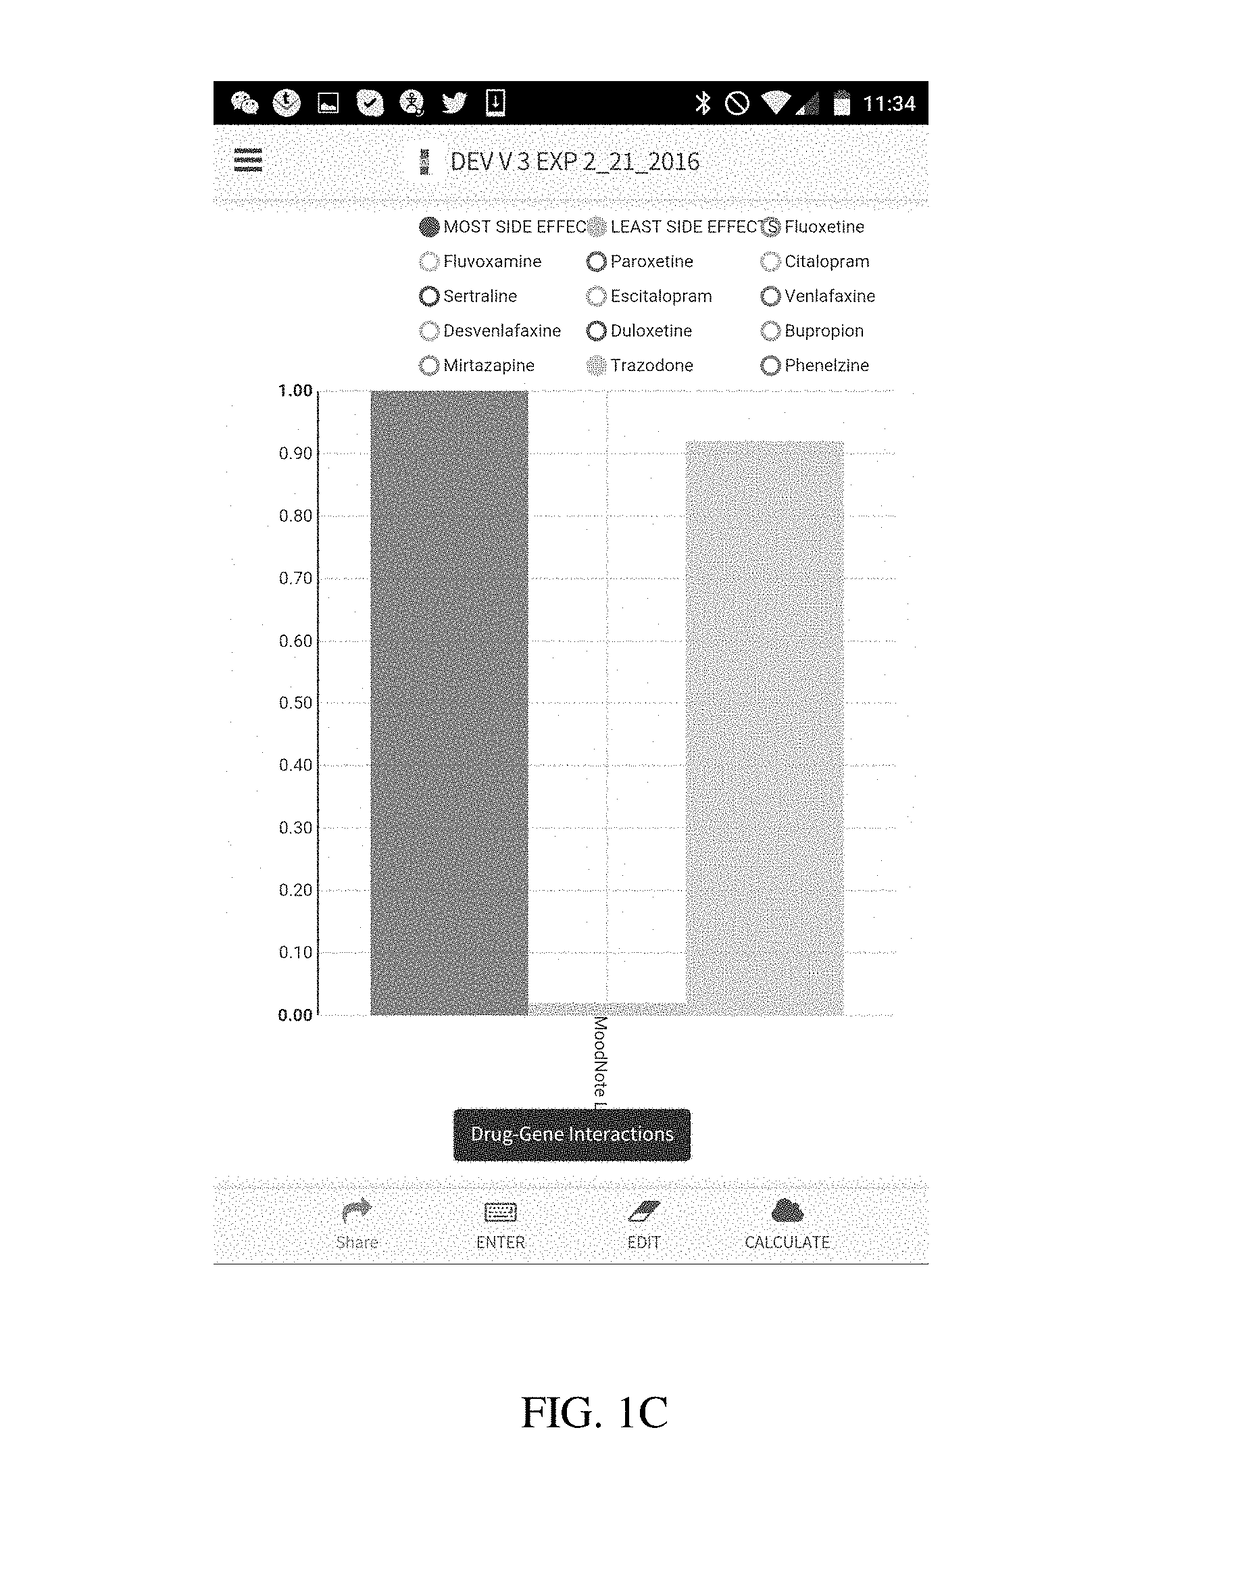
[0029]The present disclosure is directed to a method of using a computer to conduct pharmacogenetic data analysis and present results of this analysis to an interested party (e.g., a physician, a researcher, dentist or a patient) in a visual graphic format. The method and system of the present disclosure is based on entering the patient's genetic variation, mutation, polymorphism, phenotypic, transcription or other data that are known to affect a biological function, elimination, distribution or binding to a receptor of a drug or a nutraceutical into a computer. In various embodiments of the invention the entry of these data can be done in a number of ways comprising a manual entry, a direct transfer from another computer or a server, reading of a bar code, or any other similar data entry method. In another embodiment, these data are stored locked on a memory chip or transferred from one user to another.

[0030]Upon receiving genetic data, the computer processor executes a code that c...


PUM


Abstract

A method and system is provided for visualization and pictorial presentation to a user of possible interactions between a prospective drug that is being considered for prescribing to a person and that person's genotype. Genetic information of the person that can affect the manner in which a drug acts on a molecular, physiological or biological function of the body or a tissue, or a manner in which a drug is being metabolized, absorbed, excreted or otherwise eliminated from the body or a tissue by the body or tissue systems, is entered into a computerized device. The computerized device conducts a search of a drug database for drugs that have known interactions with the entered genetic information, and assigns a numeric value to each of a plurality of drugs, either in aggregate, as a class, or individually, in order to quantify the nature, strength and direction of each interaction. The computer sends the assigned numeric values to the computer's output module for their visual presentation to a user as a graph including a panel of columns, or other geometrical structures, whose geometrical characteristics correspond to the assigned numeric values of each drug, in order to facilitate the prospective drug selection by a prescriber on the basis of the totality of drug-gene and/or drug-drug interactions presented to the user as a visual graph.

Description

CROSS-REFERENCE TO RELATED PATENT APPLICATION[0001]This patent application claims benefit under 35 U.S.C. §119 to U.S. provisional patent application Ser. No. 62 / 310,813 filed on Mar. 21, 2016, entitled “A Tool For Calculation And Graphical Presentation Of Drug-Drug Or Drug-Biological Process Interactions On A Smart Phone, Tablet Or Computer,” which is incorporated herein by reference in its entirety as part of the present disclosure.FIELD OF THE INVENTION[0002]The present invention relates to methods and systems of pharmacogenomic data analysis and visualization for the purpose of medication selection for prescribing by the user. More specifically, it provides pharmacogenetic, drug-drug and drug-gene interaction impact visualization on the basis of available genetic information of a patient and information about other medications or foods / nutrition supplements that the patient of the system may be taking.BACKGROUND INFORMATION[0003]Despite the improved side effect profiles of pharm...

Claims


Application Information

Patent Timeline
Patent Type & Authority Applications(United States)
IPC IPC(8): G06F19/26G06F19/18G06F19/28G16B20/10G16B20/20G16B45/00G16B50/10G16B50/20
CPCG06F19/26G06F19/18G06F19/28G16B45/00G16B20/00G16B50/00G16B50/10G16B20/20G16B20/10G16B50/20G16H20/10
Inventor BASKYS, ANDRIUS
Owner BASKYS ANDRIUS
Why Eureka
Try Eureka