Methods and systems for computer-generated predictive application of neuroimaging and gene expression mapping data
a gene expression mapping and computer-generated technology, applied in the field of gene expression topography, can solve the problems of large brain regions lacking values, additional challenges, coarse spatial resolution, etc., and achieve the effects of minimizing signal bleed across sulcus, superior management and alignment of cortical folding, and high flexibility
- Summary
- Abstract
- Description
- Claims
- Application Information
AI Technical Summary
Benefits of technology
Problems solved by technology
Method used
Image
Examples
example 1
ession Maps for Genes of Interest and Map Validation
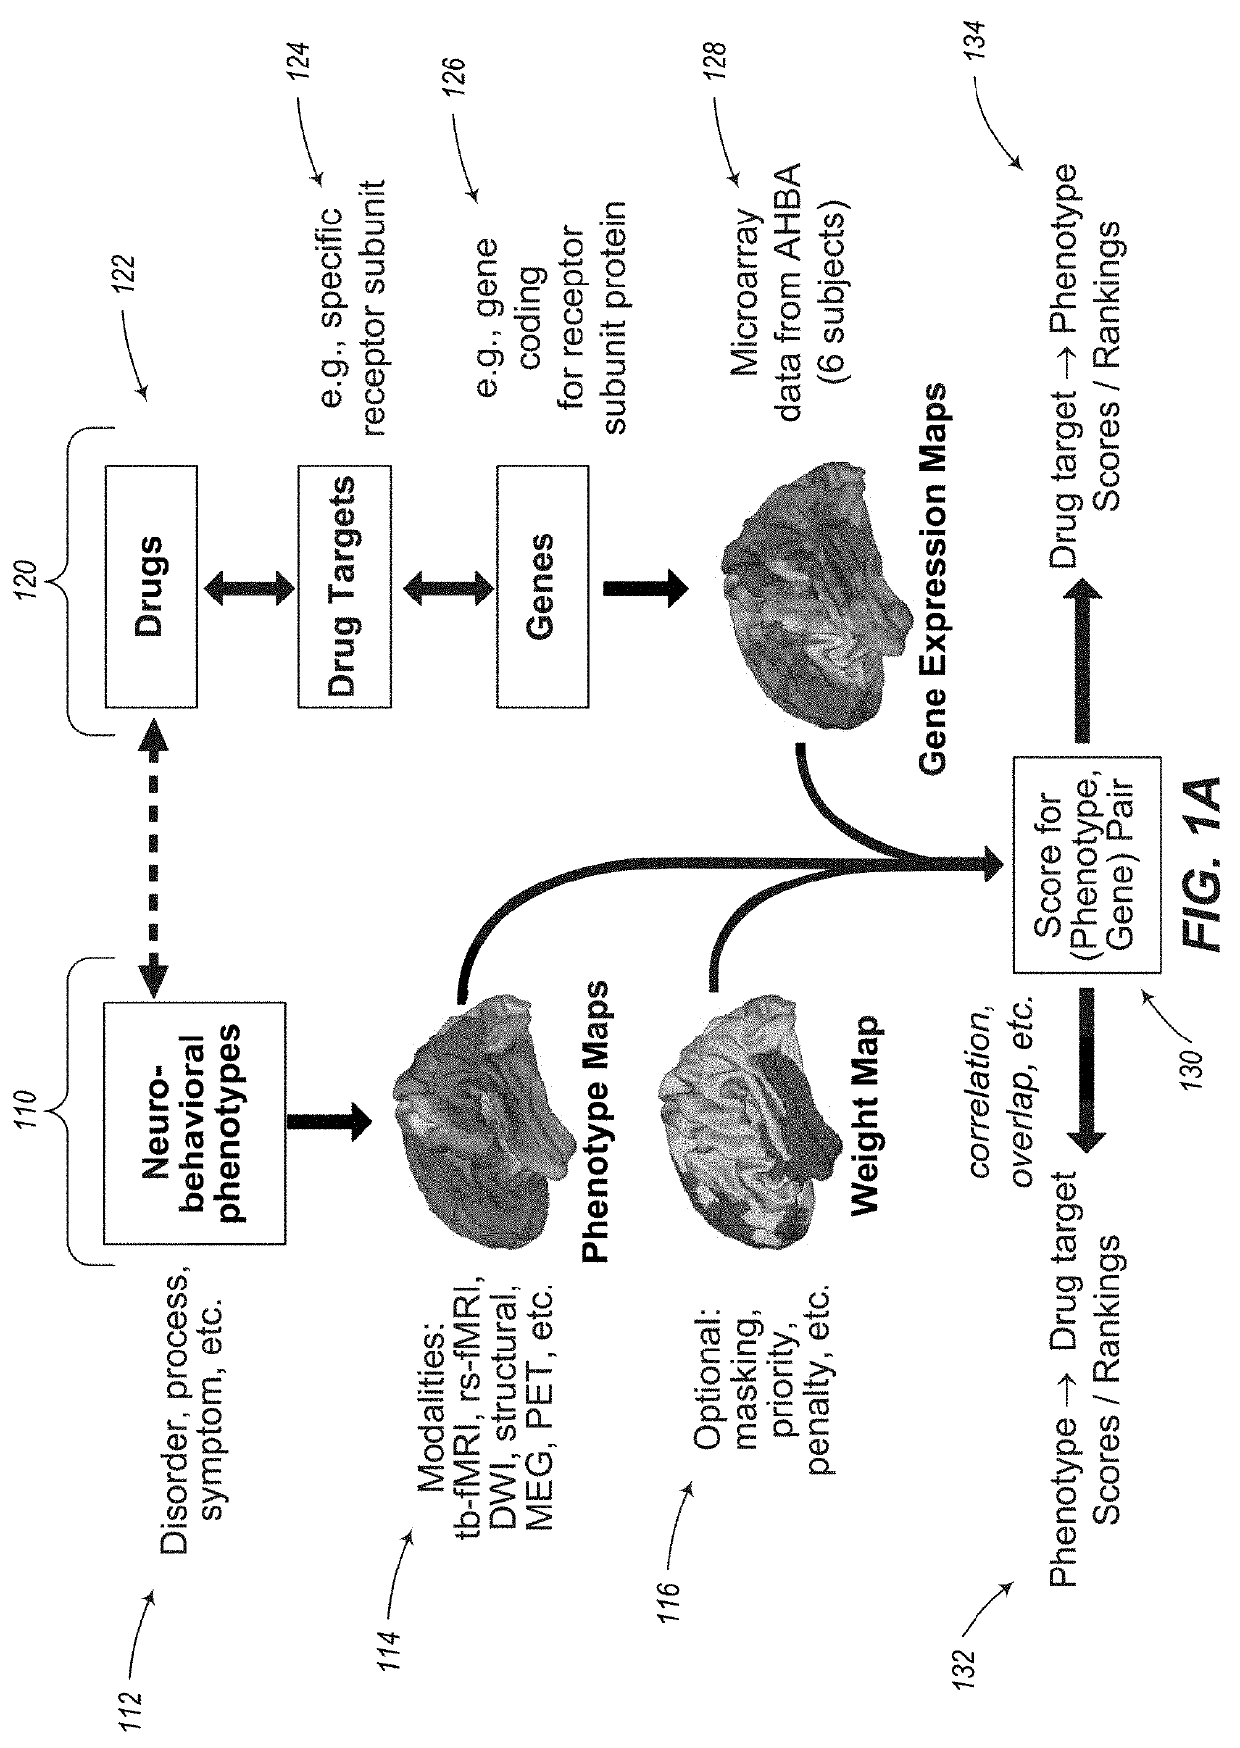
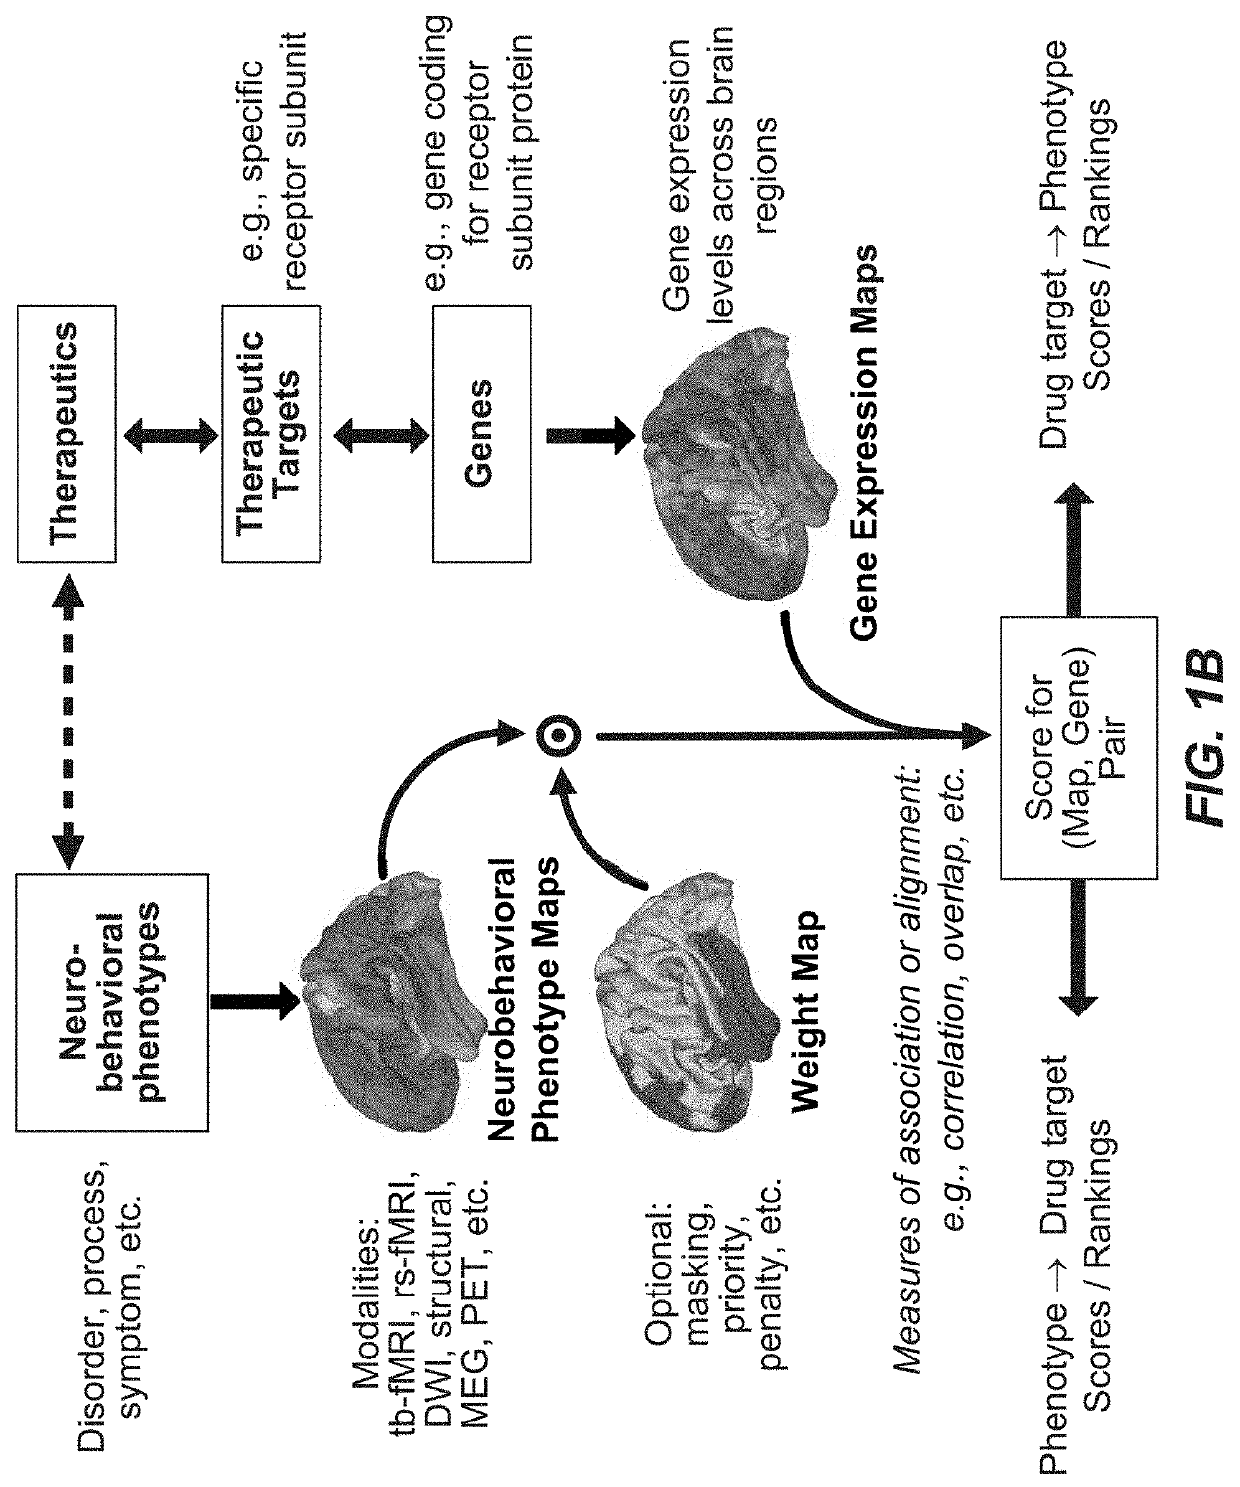
[0215]The present inventors developed algorithms to produce group-averaged parcellated gene expression maps from the AHBA dataset.
[0216]FIG. 6A shows these parcellated group-averaged expression maps for four genes of interest (OPRK1, PDYN, OXTR, and PNOC) in cortex (left) and subcortex (right). These maps reveal substantial yet systematic variation and structure in the expression patterns for these genes across cortex and subcortical structures. For instance, within cortex, PDYN shows high expression in anterior / medial temporal and medial prefrontal regions, but low expression in lateral prefrontal regions. Gene expression patterns can also be analyzed and visualized by their mean values across gross brain structures (e.g., cortex, caudate, thalamus, cerebellum), and across different functionally defined brain networks (e.g., auditory (AUD), somatomotor (SOM), visual (VIS)). FIG. 6B shows this structure-by-network analysis for the ...
example 2
Correlations with T1w / T2w (Myelin) Map for Two GABAA Receptor Subunit Genes: GABRA1 and GABRA5
[0220]A crucial step in the present platform is measuring the similarity between a gene expression map and a neuroimaging map. As a test case for a neurophenotype map, the present inventors used the map of T1w / T2w ratio which is derived from structural MRI (i.e., ratio of T1-weighted and T2-weighted MRI images). Glasser et al., Trends and properties of human cerebral cortex: correlations with cortical myelin content, NEUROIMAGE 93 Pt 2:165-75 (2014). The T1w / T2w map functions as an interpretable neurophenotype map because it captures microstructural specialization of cortical areas related to the hierarchical organization of cortex. Burt. The T1w / T2w map has high values in sensory cortex and low values in association cortex. Therefore if a cortical gene expression pattern exhibits a positive correlation with the T1w / T2w map, it is well distributed to preferentially modulate sensory cortex; ...
example 3
Correlations for Genes of Interest
[0227]FIG. 8 shows scores, here the correlation with the T1w / T2w (myelin) map, for seven genes of interest (PDYN, OXTR, OPRK1, PNOC, OXT, AVP, and OPRL1). The inventors found that four of the seven genes had highly significant negative correlations with T1w / T2w (myelin) map values (PDYN, OXTR, OPRK1, and PNOC), only one gene had a significant positive correlation (OXT), and two genes did not have a significant correlation (AVP, OPRL1).
[0228]These findings demonstrate the feasibility of the present platform, demonstrating that it can reveal significant structured relationships between gene expression maps and neuroimaging maps.
PUM
 Abstract
Description
Claims
Application Information
 - R&D
- Intellectual Property
- Life Sciences
- Materials
- Tech Scout
- Unparalleled Data Quality
- Higher Quality Content
- 60% Fewer Hallucinations
Browse by: Latest US Patents, China's latest patents, Technical Efficacy Thesaurus, Application Domain, Technology Topic, Popular Technical Reports.
© 2025 PatSnap. All rights reserved.Legal|Privacy policy|Modern Slavery Act Transparency Statement|Sitemap|About US| Contact US: help@patsnap.com


