
System and method for three-dimensional image rendering and analysis

Inactive Publication Date: 2007-09-25
CORNELL RES FOUNDATION INC +1
View PDF12 Cites 127 Cited by
  • Summary
  • Abstract
  • Description
  • Claims
  • Application Information

AI Technical Summary

Benefits of technology

[0094]Preferably, supersampling includes imposing three-dimensional units of image representation (voxels) on a three-dimensional image signal and increasing the number of such units in order to reduce the contribution of error per unit. Preferably, the supersampling is conducted in three-dimensional isotropic space.
[0112]Analysis of three-dimensional registration of two regions of interest can also include a process of weighting such as by use of Gaussian window, a triangular radial window, or a rectangular radial window, which can be used to reduce unwanted confounding structures found in the region of interest. The three-dimensional weighting of the region of interest can also include method of moment analysis to provide density distribution of the weighted region of interest.
[0116]As a result of the present invention, three-dimensional resampling techniques have been developed and evaluated which mitigate partial volume effects in the assessment of object volume. There has been a significant improvement in the reproducibility of volumetric estimates afforded by the techniques of the present invention over use of standard reconstructed CT data. For example, the double time estimates are consistent with pathologic diagnosis and are more appropriate estimates than those based on 2D metrics. Furthermore, as a result of estimating curvature based on a smoothed tessellated polygonal surface model, the actual nodule surface is approximated given the available resolution.

Problems solved by technology

To date, much of the effort has been directed to treatment of such data in two dimensions, and analysis has to a certain extent been constrained by two-dimensional limitations.
One particularly pernicious pathology is lung cancer.
For example, the small pulmonary nodule is a common radiographic finding that poses a diagnostic and clinical challenge in contemporary medicine.
One contributing factor for this low survival rate is the historical lack of early detection, or the detection of the disease at a stage where it is most likely to be curable.
In most cases, the tumor is detected at an advanced stage where opportunity for successful intervention is limited.
At this point, traditional methods for nodule characterization (many based on hand-measurement and subjective evaluation) become less effective, given the small size of these lesions.
In addition, very small pulmonary nodules may not be detectable in the ordinary chest x-ray or conventional CT and are visible in helical (spiral) CT examinations.
With continued development of instrumentation, increasingly complex procedures continue to be accomplished with this technique [37].
On the other hand, resection of a benign nodule carries a small surgical cost.
If all the information is contained in conventional transverse imaging is shown slice by slice, not everything is perceived by the observer because the information is inconveniently presented, by deconstructing anatomical and lesional picture.
The anode is heated during the generation of the x-rays and dissipation of heat becomes a limitation in long examinations.
The assumption that x-ray attenuation is uniform throughout the path of each x-ray beam (obviously an oversimplification) results in blurring of the resulting image.
Thus, lung cancer screening was not recommended as national policy.
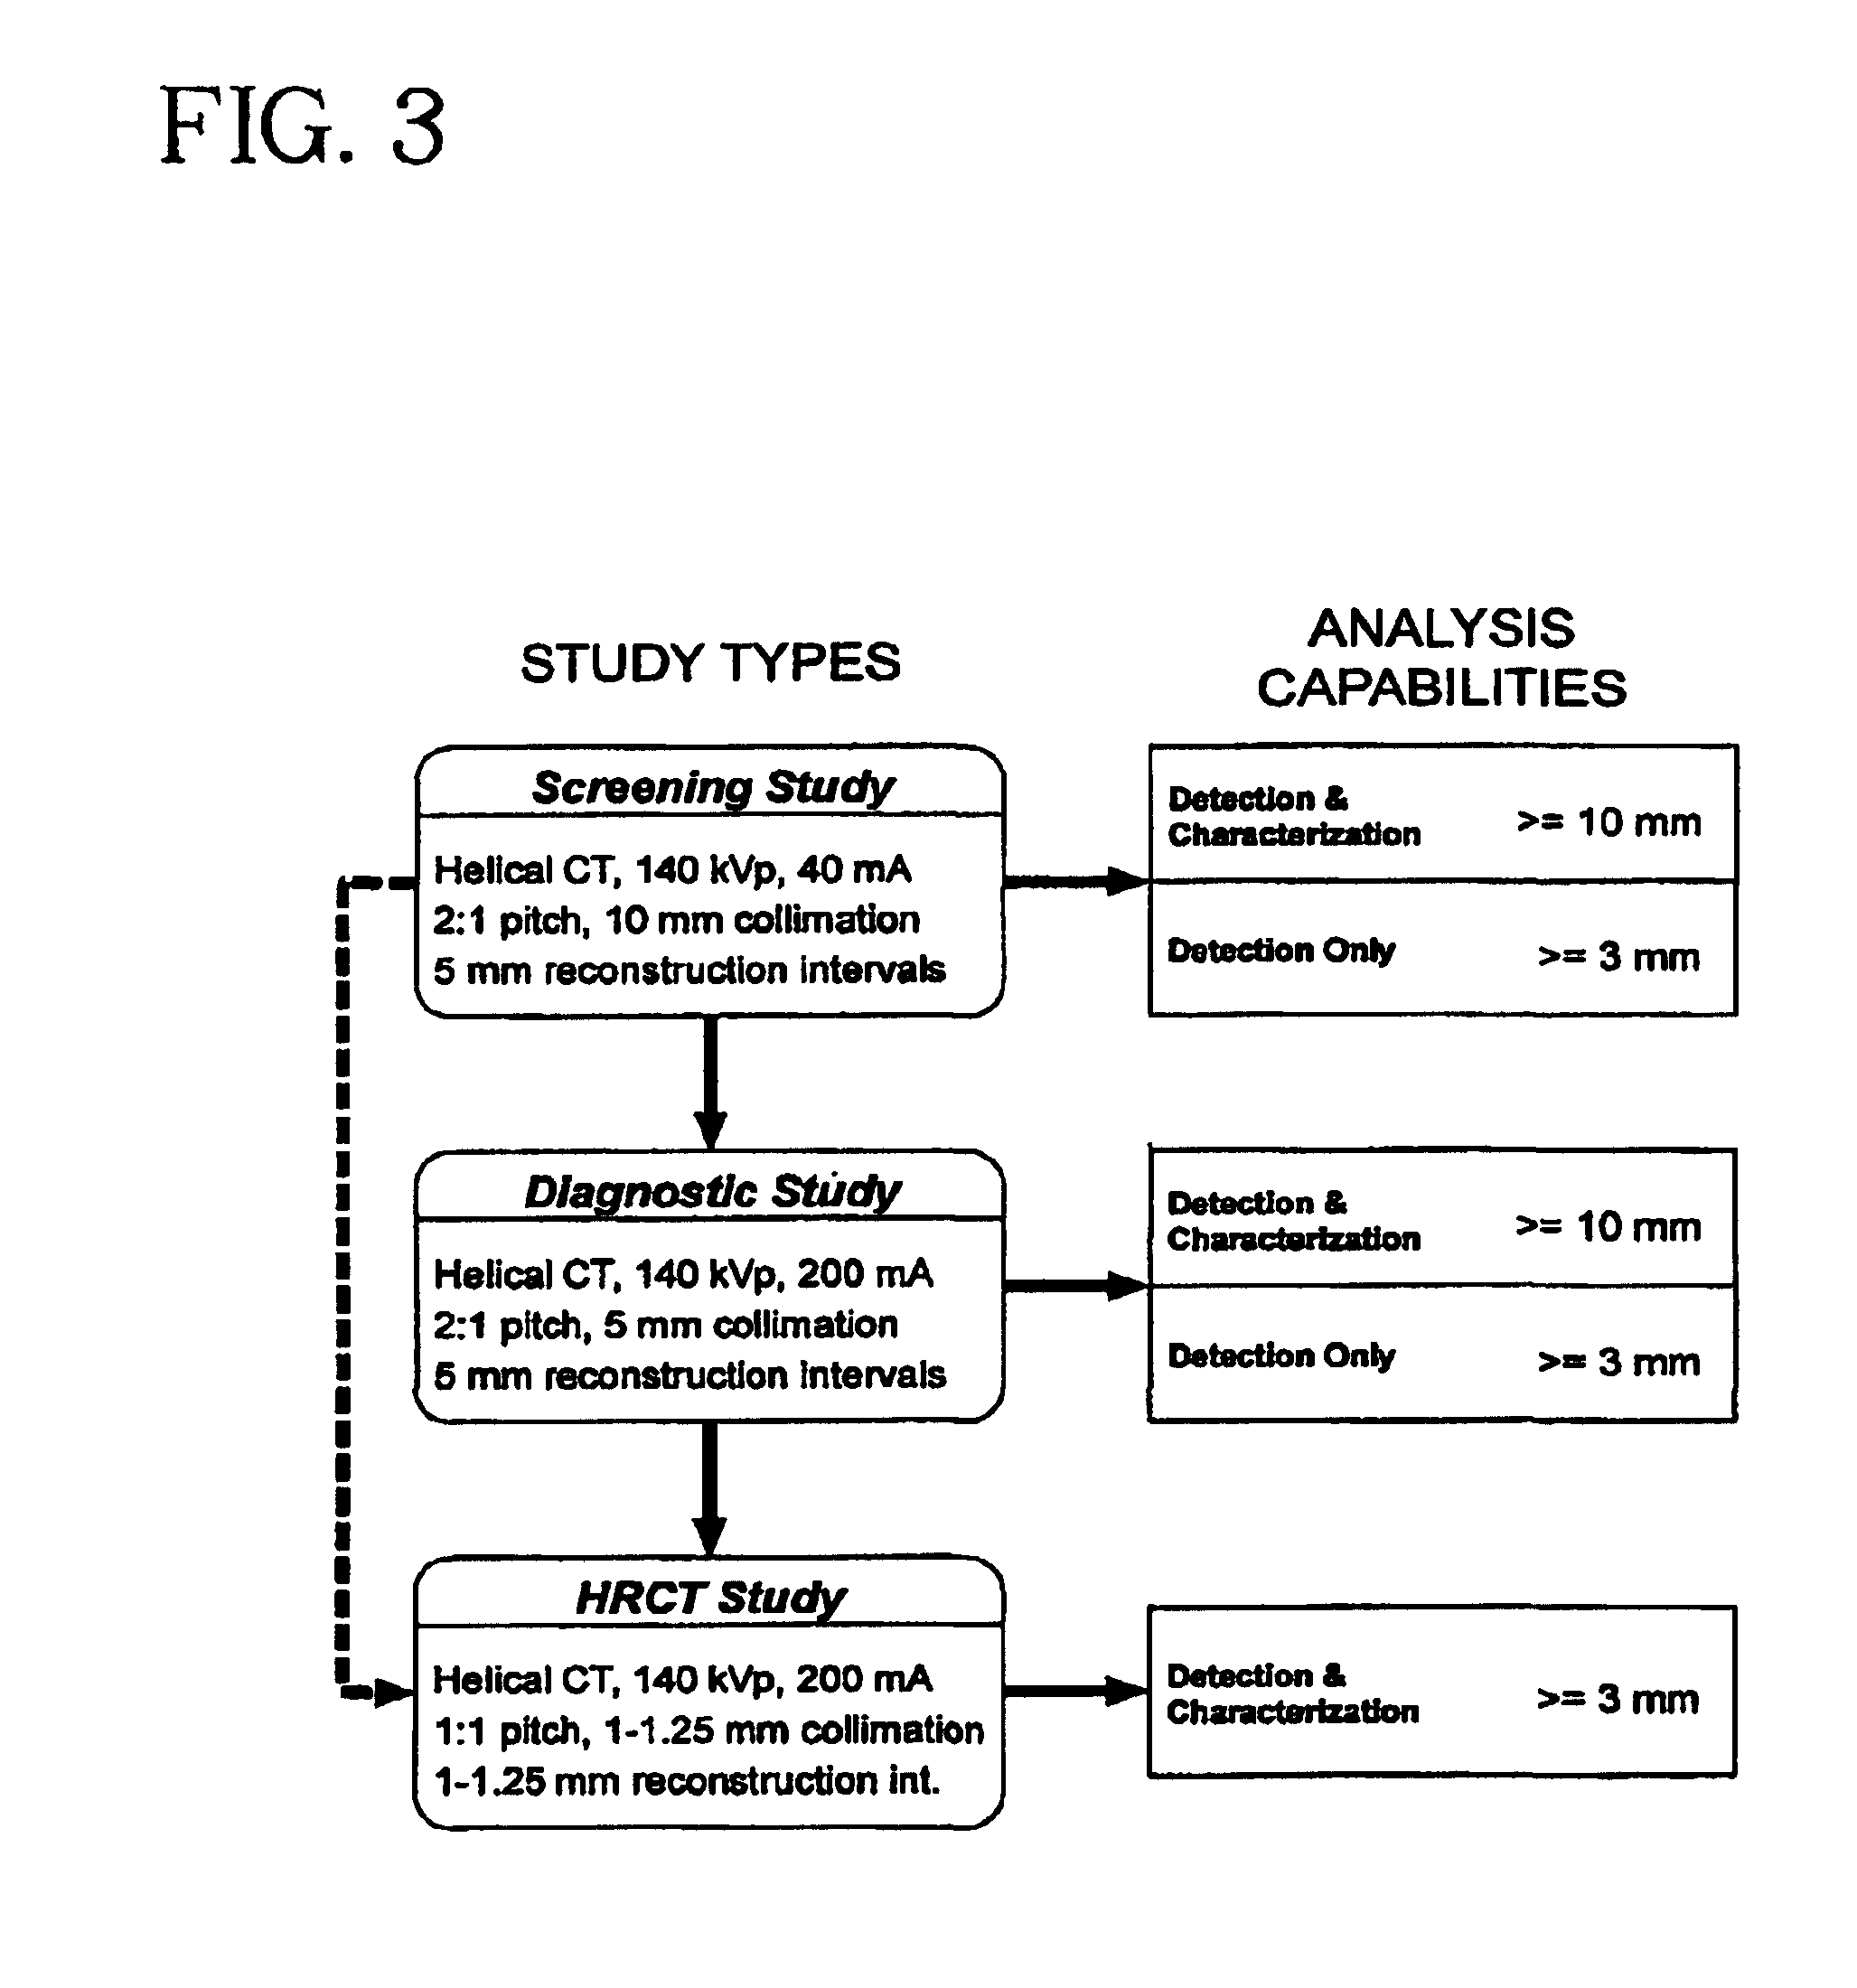
Note that these systems involve low-resolution screening scans and therefore, may be able to detect small nodules (<1 cm) but there is insufficient information to characterize them.
One of the most important issues regarding the use of CAD systems for nodule detection is the effective detection rate.
Most computer-aided schemes for the analysis of chest radiographs unfortunately have relatively low sensitivity.
In addition there is frequently a high false-positive rate (very low specificity) in these systems.
Thus, the choice of operating point on the receiver operating characteristic (ROC) curve for a particular CXR analysis technique may be quite challenging.
Another challenging problem in the study of pulmonary nodules is the analysis of non-solid nodules, or ground-glass opacities (GGOs) [18, 11].
These lesions are difficult to characterize using traditional size and shape metrics.
Infections in the lung may exhibit extremely fast growth.
As with measurement of nodule size, there have been difficulties in making reproducible shape characterizations, due to the lack of a precise mathematical basis and measurement technique.
Detection of pulmonary nodules in screening CT scans is challenging due to the desire to limit radiation dose and scan time, both of which result in a reduction of information.
An additional reduction in radiation dose achieved through low tube current further affects image quality.
The classification stage in detection systems is sometimes extended to include the separation of benign from malignant lesions, however, this may only achieve limited results with the low-dose, low (axial) resolution studies common to initial screening exams.
This anisotropy presents special challenges in distinguishing between small pulmonary nodules and fine vasculature.
Therefore, it is a non-trivial problem to distinguish between small pulmonary nodules and small vascular cross-sections as the low axial resolution of screening studies limits the three-dimensional information needed to fully characterize these objects.
The problem is further exacerbated by the fact that nodules are frequently attached to the pulmonary vasculature or to the pleural surface, increasing their difficulty of detection as they may be considered part of either confounding structure due to the similar density values found in many non-calcified nodules.
It is evident that the low axial resolution of anisotropic screening data limits the extent to which the bronchi can be followed.
It is important to note, however, that the standard low-dose screening study is significantly anisotropic, and therefore largely limits the feasibility of performing measurements in three dimensions.

Method used


Image

  • System and method for three-dimensional image rendering and analysis
  • System and method for three-dimensional image rendering and analysis
  • System and method for three-dimensional image rendering and analysis

Examples


example 1

[0376]A 3.5-mm (diameter) nodule is detected using HRCT. Using Equation 5.32, we determine a to be 5.75%. Equation 5.37 then yields a value of 40 days for ti.

example 2

[0377]A 9.0-mm (diameter) nodule is detected using HRCT. The corresponding value for α is 3.0%. The appropriate interscan interval is 21 days.

[0378]Each of these interscan intervals less than 90 days, perhaps the maximum time a second high-resolution CT study should be delayed. Intuitively, one must wait a longer interscan interval to accurately assess growth in a smaller nodule. As mentioned at the beginning of this section, one of the constraints of this model should be to avoid the possibility of significant nodule growth during the interscan interval. The maximum amount of time a small pulmonary nodule (3≧d<10 mm) will be held between scans, given the error estimates described is approximately 42 days, which is less than 1.5 doubling times for even the most aggressive malignancy. Traditional exam intervals for the study of lung cancer ranged from six months to two years (approximately 4-17 times as long), even though the smallest detectable lesion was at least 10 mm in diameter....

example 3

[0395]After several annual screens, a nodule is detected in a patient that was undetectable retrospectively in the previous exam. The nodule is scanned at high-resolution (1 mm slice thickness) for volumetric measurement yielding a volume estimate of 73.57 mm3. The upper bound on doubling time for this nodule could be estimated using Vβ=8.18 mm3 and Δts,=365.25. The incidence estimated doubling time would then be

[0396]DTi=ln⁢⁢2·365.25ln⁡(73.57 / 8.18)=115.3⁢⁢days

Such a doubling time would put this nodule well within the range of malignancy. Furthermore, as this is an upper bound on the doubling time, it is possible that the nodule is growing even more aggressively.

[0397]Estimation of the doubling time of incidence cases may be an important alternative to waiting an appropriate interscan interval for a second volumetric measurement. This is particularly true in incidence cases that are significantly larger than the minimum-detectable nodule size, as they are those most likely to be mal...


PUM


Abstract

The present invention relates to methods and systems for conducting three-dimensional image analysis and diagnosis and possible treatment relating thereto. The invention includes methods of handling signals containing information (data) relating to three-dimensional representation of objects scanned by a scanning medium. The invention also includes methods of making and analyzing volumetric measurements and changes in volumetric measurements which can be used for the purpose of diagnosis and treatment.

Description

[0001]The present application claims priority to two (2) provisional applications identified as follows: U.S. Application Ser. No. 60 / 196,208, filed Apr. 11, 2000; and U.S. Application Ser. No. 60 / 253,974, filed Nov. 29, 2000. Each of these earlier filed provisional applications are incorporated herein by reference.[0002]The invention was made with government support under R01CA63393 and RO1CA78905 by the National Cancer Institute. The government has certain rights to the invention.BACKGROUND OF THE INVENTION[0003]The present invention relates to the art of diagnostic imaging, and, in particular, to methods and systems for conducting highly enhanced three-dimensional reproduction and analysis of three-dimensional images and diagnosis and treatment related thereto.[0004]It is known in the art of image diagnostic systems and methods to scan objects found in a host patient, retrieve signals resulting from such scanning, and process the signals to obtain information for possible diagnos...

Claims


Application Information

Patent Timeline
IPC IPC(8): G06K9/00G06T5/00G06T7/00G06T7/60G06T11/00G06T17/10
CPCG06T7/0012G06T7/0081G06T7/0091G06T7/602G06T11/008G06T15/08G06T17/10G06T5/002G06T5/005G06T5/30G06T2207/10081G06T2207/30064G06T2207/30096G06T2200/04G06T2207/20148G06T7/11G06T7/155G06T7/62G06T7/136G06T5/77G06T5/70
Inventor REEVES, ANTHONY P.KOSTIS, WILLIAM J.HENSCHKE, CLAUDIAYANKELEVITZ, DAVID
Owner CORNELL RES FOUNDATION INC
Learn More