
Preconcentration and separation of analytes in microchannels

a microchannel and preconcentration technology, applied in the direction of fluid pressure measurement, liquid/fluent solid measurement, peptide measurement, etc., can solve the problems of difficult implementation, difficult to fabricate chips in a reproducible manner, poor optical detection sensitivities, etc., and achieve the effect of increasing the preconcentration resolution

Inactive Publication Date: 2010-11-09
SANDIA NAT LAB
View PDF7 Cites 72 Cited by
  • Summary
  • Abstract
  • Description
  • Claims
  • Application Information

AI Technical Summary

Benefits of technology

[0019]In some embodiments, the concentration polarization effects are reduced by using a narrow, about 10 to about 50 μm, preferably about 10 to about 40 μm, more preferably about 10 to about 30 μm, size-exclusion polymeric element with respect to the field direction, using an size-exclusion polymeric element that has minimal surface charge (for example polyacrylamide / bisacrylamide, or the like) or close to net zero charge with a zwitterionic polymer (for example SPE / bisacrylamide or the like), introducing a porous polymeric element only within the assay area, generating fluid flow on one or both sides of the size-exclusion polymeric element to replenish ions, or a combination thereof.

Problems solved by technology

Also, micrometer dimensions of the fluidic channels lead to poorer sensitivities for optical detection than their conventional scale counterparts.
Further, the practical constraints on sample loading limit the minimum volume of sample inserted into a chip to the order of about 1 μl while the volume typically analyzed is on the order of about 1 nl.
For example, sample stacking methods require insertion and maintenance of multiple buffer zones and can be difficult to implement with samples of unknown conductivity.
While a 600-fold signal increase was reported for proteins electrophoretically driven against the silicate membrane, the authors reported that (1) the chips are hard to fabricate in a reproducible manner, and (2) the silicate membrane often has defects adversely affecting the concentration.
This required precision can be a demanding and limiting fabrication requirement, especially when etching deep channels with an isotropic etch process.
Another limitation is that the surface area of the membrane face is a very thin line of contact between the channel lid and the top of the channel wall.
The nanofluidic filter described by Wang et al. requires labor intensive and demanding fabrication process to make the nanometer size channels.
There are other aspects of the nanofilter that pose difficulties for integrated processing and analysis.
This means there is no option for size-selective trapping or filtering and that small buffer ions are stacked along with larger analyte which can be detrimental for downstream processing, analysis or both, e.g. if the concentrated species were directed into a gel electrophoresis channel, sample destacking would prohibit useful separations.
Further, non-linear concentration factors and lack of reproducibility are problematic with a membrane based approach to preconcentration.
This behavior results from concentration polarization that can lead to sample destacking.
The steep concentration gradients in the depleted concentration polarization zone results in diffusion-limited transport of ions.
This leads to a drop in current as a function of time upon application of the external electric field.
Localized increase in ion concentrations lead to sample destacking and other non-linear effects resulting in band-broadening and irreproducible migration over time.

Method used


Image

  • Preconcentration and separation of analytes in microchannels
  • Preconcentration and separation of analytes in microchannels
  • Preconcentration and separation of analytes in microchannels

Examples


example 1

On-Chip Mixing at the SEP Element

[0200]Mixing of sample with buffer and reagents is a vital component of most integrated microfluidic processes. It is also a challenge for which a number of novel approaches have been employed. Some of the key factors that define the effectiveness of a mixer are the (i) time and (ii) space required for mixing and (iii) the complexity of device fabrication added by the mixing element. Also relevant is whether the mixing depends on the size of the species being mixed or other properties of the sample such as viscosity or pH.

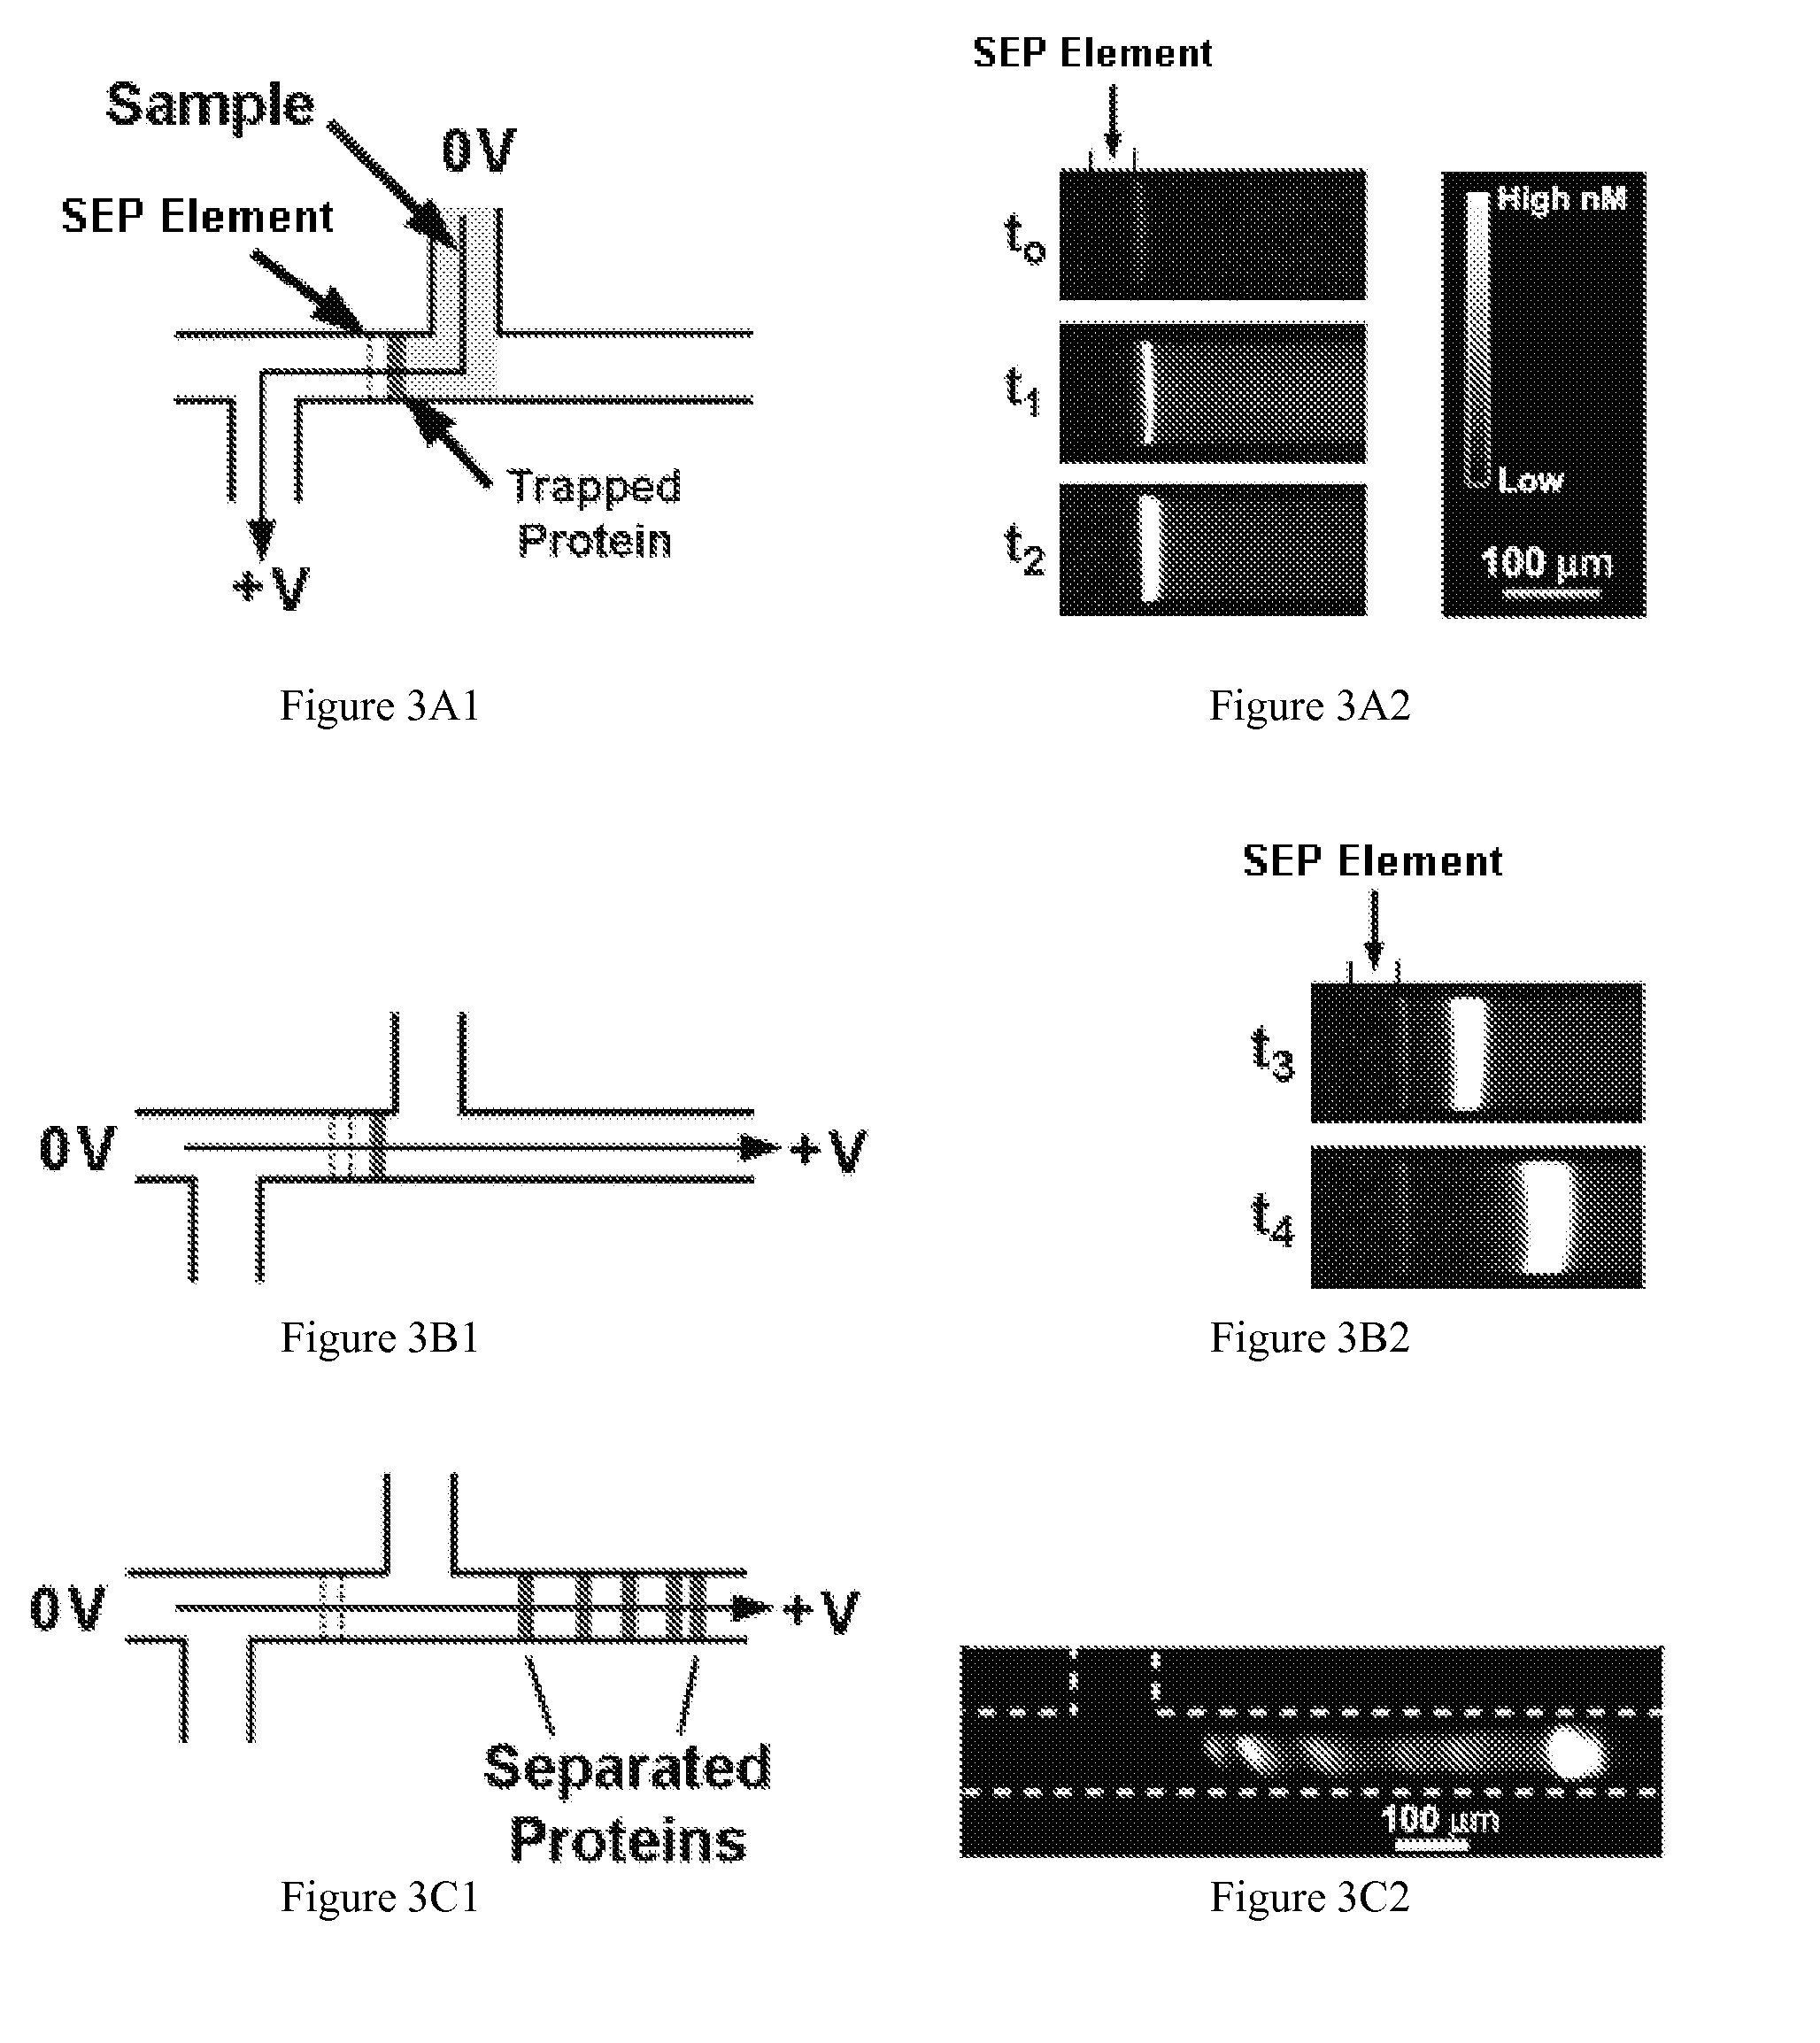
[0201]The processing area adjacent to an SEP element serves as a suitable mixer in terms of device space used for mixing and time required. In the assays tested, proteins from solution 1 can be trapped at the SEP element followed by proteins from solution 2. The components are fully mixed at the SEP element as soon as they are trapped. This could easily be extended to additional solutions. Another advantage is that the ratio of comp...

example 2

Preconcentration Followed by SDS-PAGE of Proteins in a Microchip

[0204]SDS-PAGE is a commonly used protein separation technique for protein size determination and expression profiling. Only more abundant proteins are detectable with standard methods leaving out many important low-abundance proteins from analysis. Using an integrated SEP element and cross-linked PP element for preconcentration and separation of proteins, greater than about a 1,000-fold improvement can be achieved without loss of separation resolution. See Hatch et al. (2006) Anal. Chem. 78(14):4976-4984, which is herein incorporated by reference.

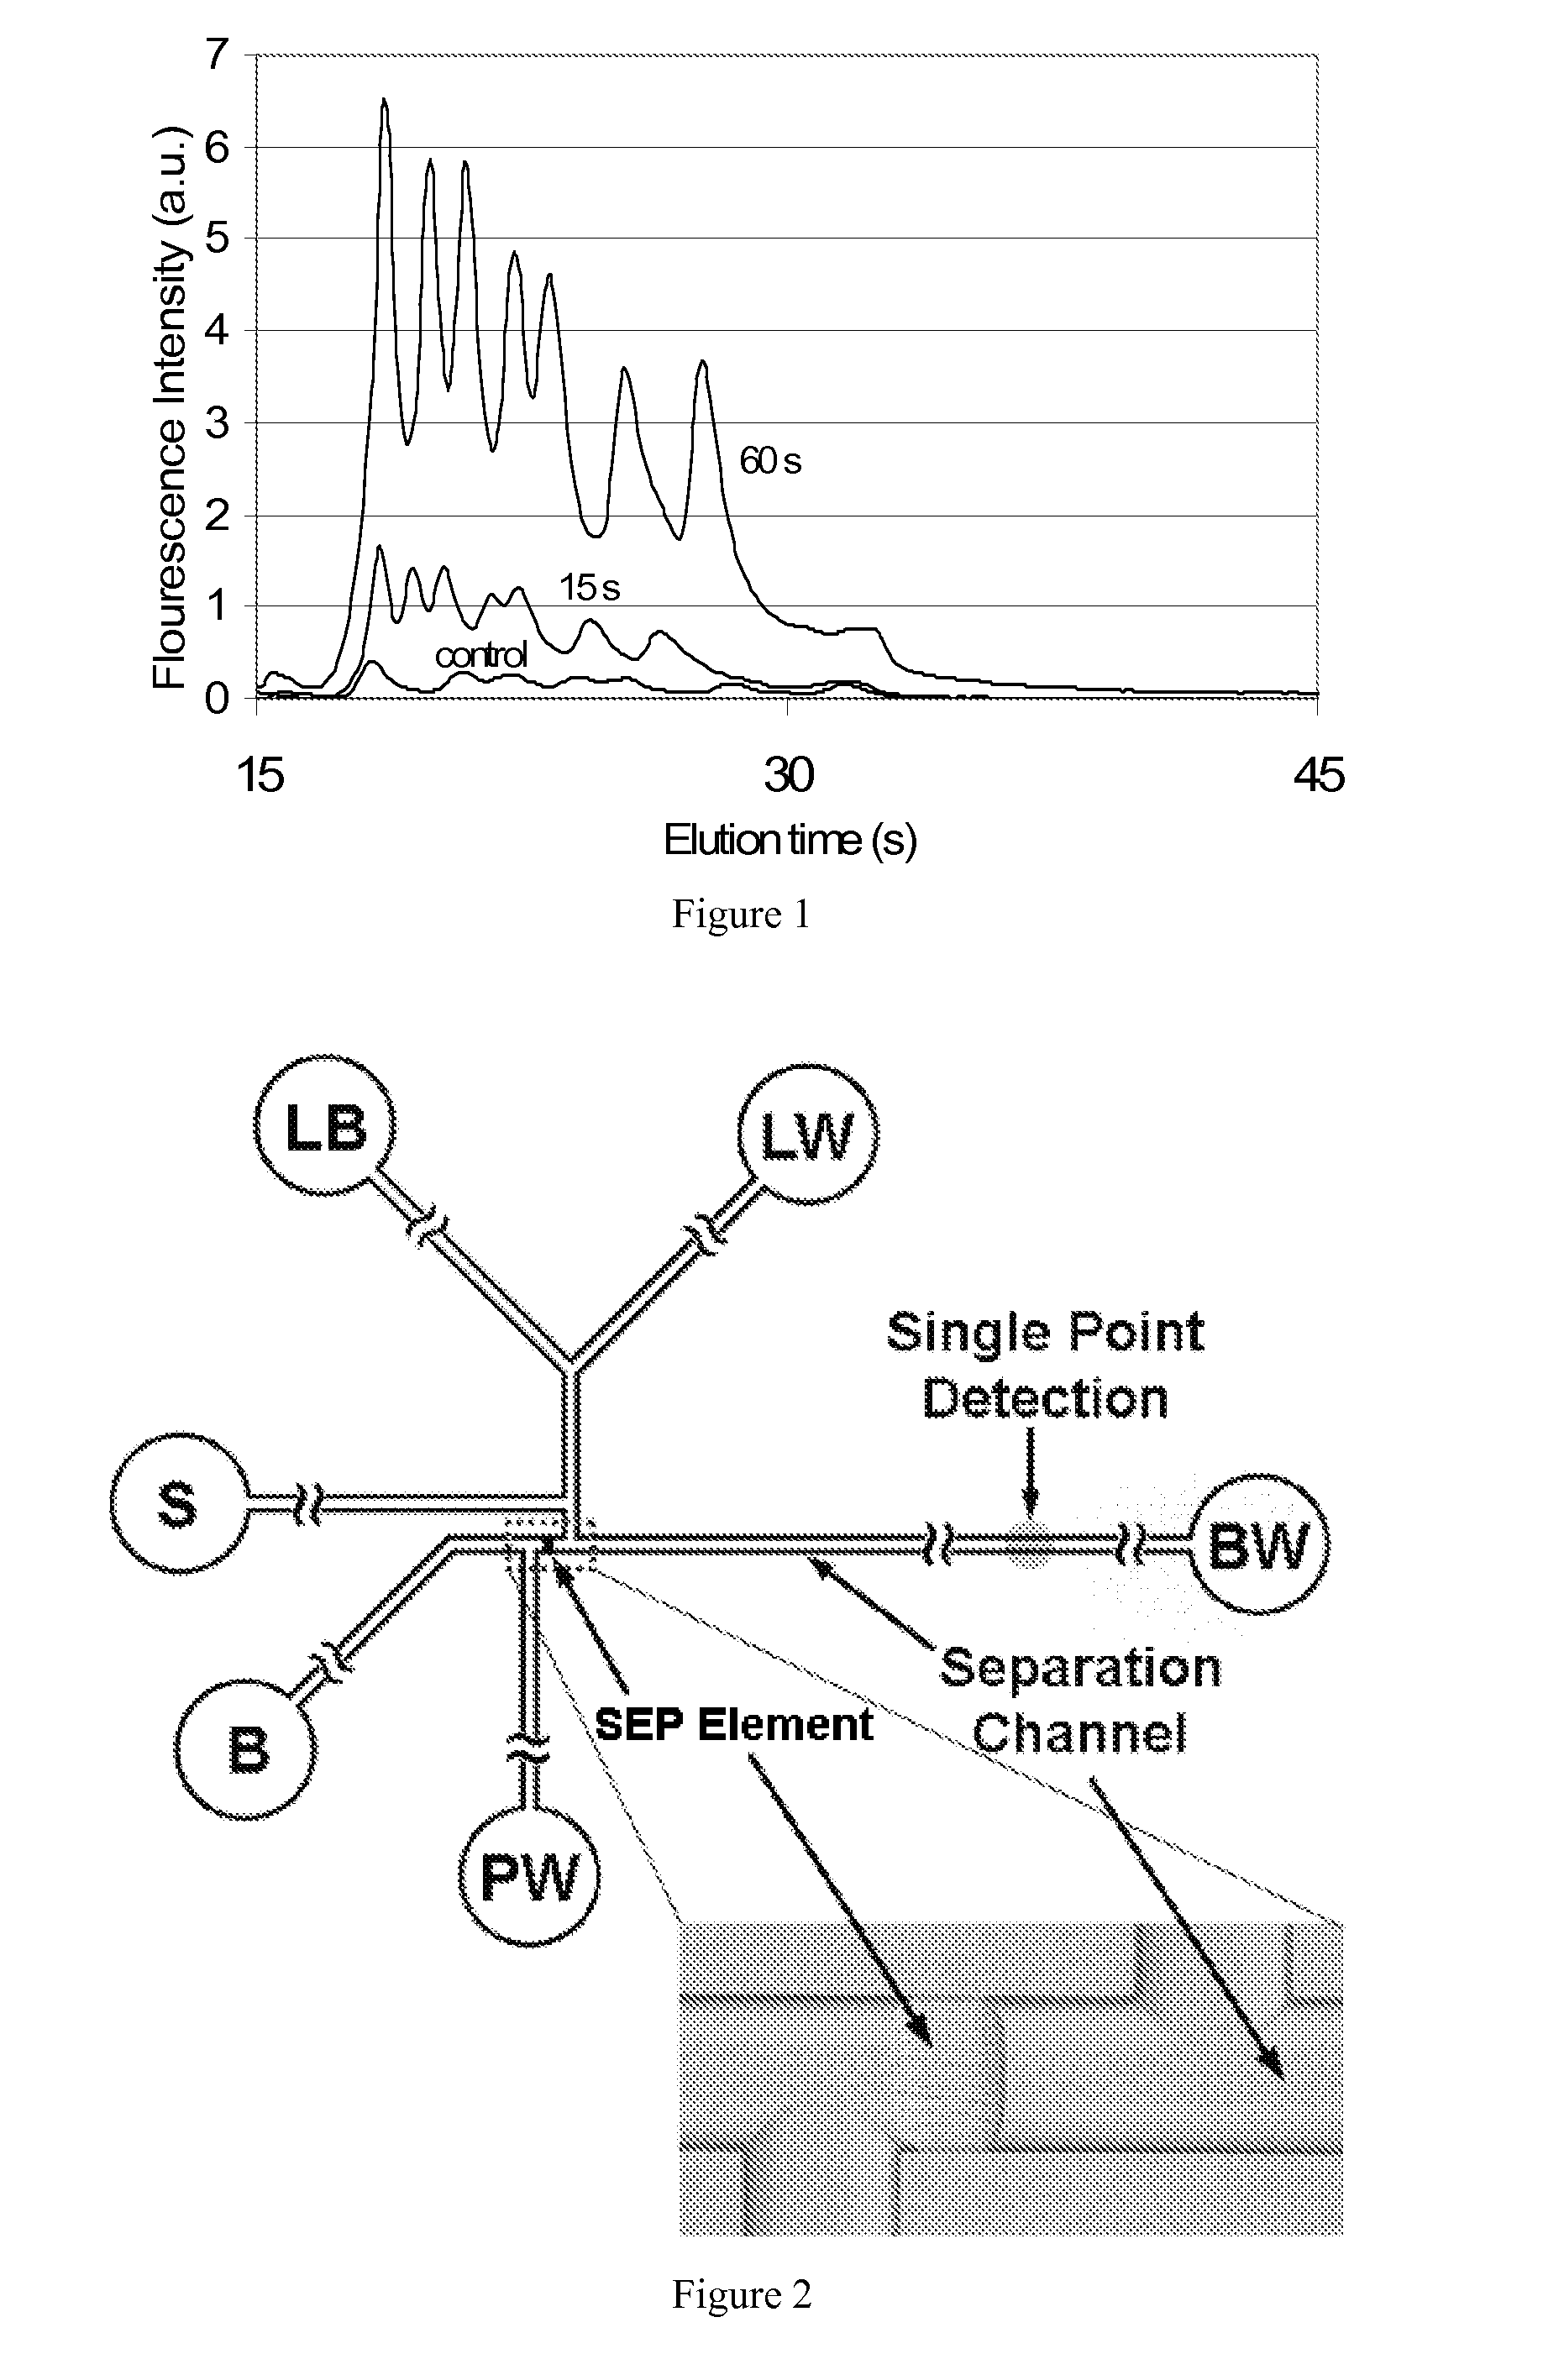
[0205]FIG. 18A shows electropherograms depicting SDS-PAGE of a mixture of proteins. It is evident that without preconcentration, the proteins cannot be detected. As proteins are concentrated prior to separation, the peak height increases. FIG. 18B shows the concentration factor obtained as a function of time of loading. Proteins could be concentrated up to 1400-fold upon 4 min...

example 3

Preconcentration Followed by PAGE of DNA in a Microchip

[0206]Although there are many techniques for amplifying nucleic acid molecules, e.g., PCR, known in the art, there are instances where concentrating the nucleic acid molecules is preferred. Integrated preconcentration and analysis of nucleic acid molecules was achieved using a device and protocol similar to that described in Hatch et al. (2006) Anal. Chem. 78(14):4976-4984, which is herein incorporated by reference. However, as provided herein, the PP element was 8% T 5% C in order to separate smaller nucleic acid molecules. The SEP element dimensions and pore size was as previously described (22% T 6% T). The applied field for preconcentrating nucleic acid molecules was 150 V / cm for times ranging from about 1 to about 8 minutes and the field applied for separation was 300 V / cm. Nucleic acid molecules ranging from about 20 to greater than about 1,000 bp have been effectively preconcentrated and separated using these methods, inc...


PUM

PropertyMeasurementUnit
Lengthaaaaaaaaaa
Lengthaaaaaaaaaa
Acidityaaaaaaaaaa

Abstract

Disclosed herein are methods and devices for preconcentrating and separating analytes such as proteins and polynucleotides in microchannels. As disclosed, at least one size-exclusion polymeric element is adjacent to processing area or an assay area in a microchannel which may be porous polymeric element. The size-exclusion polymeric element may be used to manipulate, e.g. concentrate, analytes in a sample prior to assaying in the assay area.

Description

CROSS-REFERENCE TO RELATED APPLICATIONS[0001]This application claims the benefit of U.S. Provisional Patent Application Ser. No. 60 / 725,015, filed 6 Oct. 2005, U.S. patent application Ser. No. 10 / 443,491 filed 22 May 2003, and U.S. patent application Ser. No. 10 / 646,808 filed 25 Aug. 2003, which are herein incorporated by reference in their entirety.ACKNOWLEDGEMENT OF GOVERNMENT SUPPORT[0002]This invention was made with Government support under government contract DE-AC04-94AL85000 awarded by the U.S. Department of Energy to Sandia Corporation. The Government has certain rights in the invention.BACKGROUND OF THE INVENTION[0003]1. Field of the Invention[0004]The present invention generally relates to multidimensional electrophoresis devices and methods of making and using thereof.[0005]2. Description of the Related Art[0006]The advent of microfluidic chips has enabled miniaturization of many biochemical techniques resulting in faster and cheaper analysis using much smaller amounts of...

Claims


Application Information

Patent Timeline
IPC IPC(8): B01D57/02B01D61/58B01D63/00
CPCB01D57/02G01N27/44743G01N27/44791
Inventor HATCH, ANSONSINGH, ANUP K.HERR, AMY E.THROCKMORTON, DANIEL J.
Owner SANDIA NAT LAB
Learn More