DNA-based methods of geochemical prospecting

a geochemical and dna-based technology, applied in the field of dna-based geochemical prospecting, can solve the problems of limited approach, increased health problems of bacteria or fungi, microbial infections caused by bacteria or fungi, etc., and achieve the effect of quick “capture” and easy manipulation

Inactive Publication Date: 2011-12-06
TAXON BIOSCI
View PDF6 Cites 46 Cited by
  • Summary
  • Abstract
  • Description
  • Claims
  • Application Information

AI Technical Summary

Benefits of technology

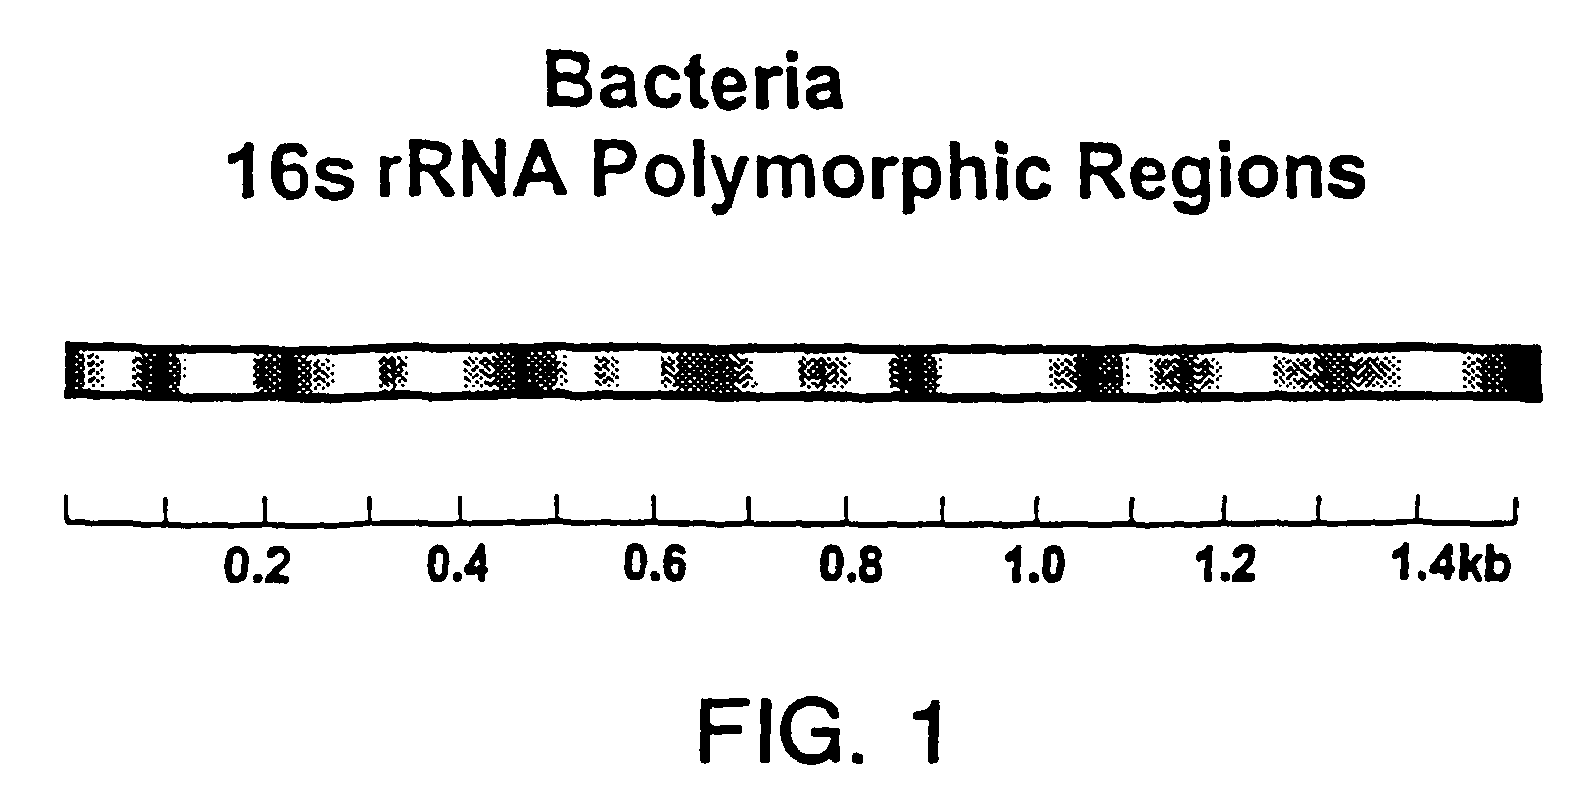
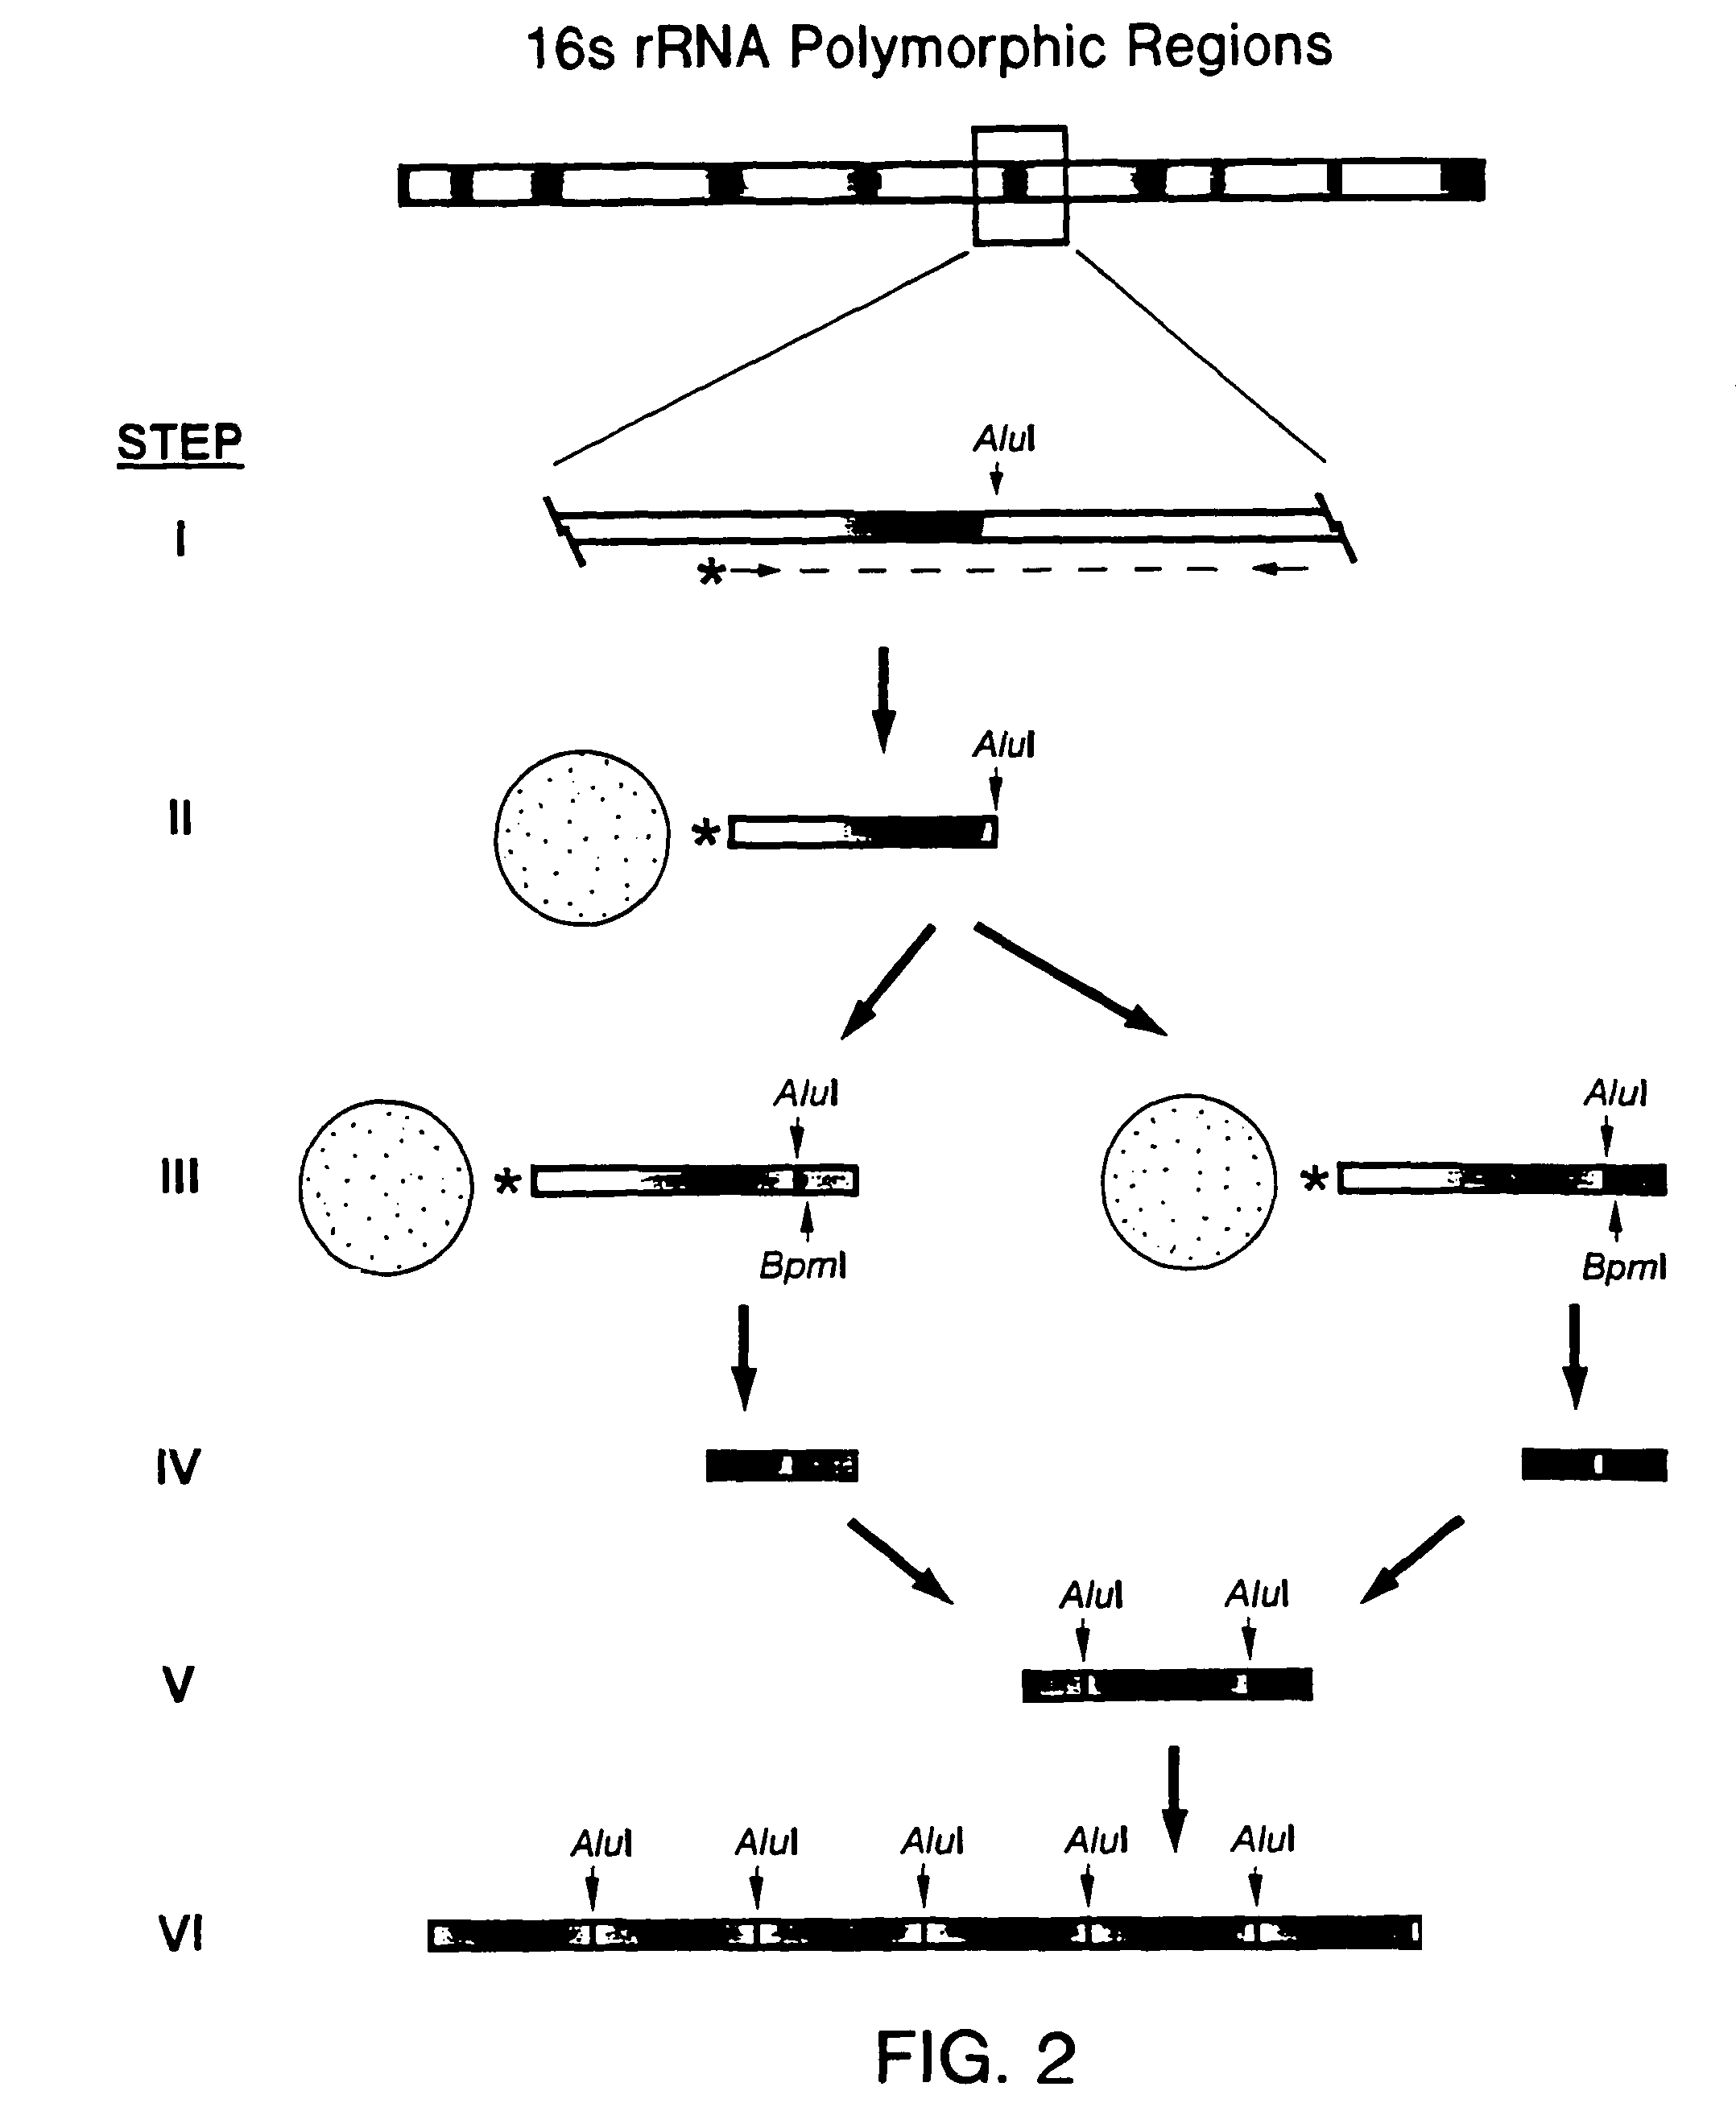
[0015]The present invention solves this problem by providing methods for rapidly determining the diversity of a microbial or viral population and for determining the antibody or TCR diversity of a population of B or T cells. The present invention relies on hybridization-independent genomic technology to quickly “capture” a portion of a designated polymorphic region from a given DNA molecule present in a population of organisms or cells. This portion of the DNA molecule, a “marker,” is characteristic of a particular genome in the population of interest. The marker can be easily manipulated by standard molecular biological techniques and sequenced. The sequence of a multitude of markers provides a measure of the diversity and / or identity of a population. In one aspect, the invention provides a method, Serial Analysis of Ribosomal DNA (SARD), that can be used to distinguish different, members of a microbial population of interest.

Problems solved by technology

This approach is limited, however, by the metabolic diversity of a few well-characterized bacterial strains.
In addition, bacterial infections have become an increasing health problem because of the advent of antibiotic-resistant strains of bacteria.
Further, microbial infections caused by bacteria or fungi that do not usually infect humans may be a problem in immunocompromised individuals.
Further, individuals in developing countries who may be malnourished or lack adequate sanitary facilities may also support a large load of opportunistic bacteria, many of which may cause sickness and disease.
A large number of different types of microbes may contaminate food for humans or animals.
However, many of the microbes responsible for causing sickness in humans and animals are difficult to isolate or identify.
However, SAGE only measures RNA levels from tissues or organisms, and is not suitable for examining genetic diversity.
37:49-55), it has limited utility for an environmental microbial survey for two reasons.
However, the vast majority of environmental microbes have not been characterized.
Second, DNA chips rely on hybridization of nucleic acids which is subject to cross hybridization from DNA molecules with similar sequence.
However, the resolving power of a hybridization-based approach is limited because one must identify regions of DNA that do not cross-hybridize, which may be difficult for related microbial species.
Genomic technologies and bioinformatics hold much untapped potential for application in other areas of biology, especially in the field of microbiology.
However, to date there has not been a method to rapidly and easily determine the genomic diversity of a population, such as a microbial or viral population.
Further, there has not been a method to easily determine the antibody or TCR diversity of a population of B or T cells, respectively.

Method used


Image

  • DNA-based methods of geochemical prospecting
  • DNA-based methods of geochemical prospecting
  • DNA-based methods of geochemical prospecting

Examples


example 1

Serial Analysis of rDNA Polymorphic Tags from the Domain Eubacteria

[0108]A sample comprising environmental bacteria was obtained and total DNA was extracted from the sample. To, amplify the DNA, PCR was performed by mixing 5 μL 10×Advantage2 reaction buffer (Clontech), 2.5 μL dNTPs, 5 μL 8 μM TX9 / TX16 primers, 50 ng of sample DNA, 0.5 μL Advantage2 Taq polymerase (Clontech) and water to 50 μL. Primer TX9 was biotinylated. The primers are shown in FIG. 12 and a general strategy of this example is shown in FIG. 13. The reaction mixture was then subjected to PCR under the following conditions:

[0109]a) 94° C. for 5 minutes;

[0110]b) 94° C. for 1 minute, 10 seconds;

[0111]c) 55° C. for 50 seconds;

[0112]d) 68° C. for 1 minute;

[0113]e) repeat steps (b) through (d) 20 times; and

[0114]f) 68° C. for2minutes.

[0115]The approximately 600 basepair PCR product was gel purified using 1% agarose and a Qiaquick kit (Qiagen) according to manufacturer's instructions. The DNA was eluted with 50 μL Tris-ED...

example 2

SARD Analysis of a Defined Population

[0135]SARD was performed essentially as described in Example 1. In this example, commercially available bacterial genomic DNA samples were mixed at an equal concentration (weight / volume). The bacterial DNA samples used included Bacillus subtilis, Clostridium perfringens, Escherchia coli, Lactococcus lactis and Streptomyces coelicolor. Equal volumes of the DNA samples (total genomic DNA) were mixed at a concentration of 50 ng / μL each. Chart I shows the size of the genomes of each bacterial species, the number of 16S rDNA copies per genome and the molar percentage of 16S copies for each bacterial species in the total DNA sample.

[0136]

Chart IBacteriaGenome (Mb)16S Copies / GenomeMolar %B. subtilis4.21017.2C. perfringens4.41016.4E. coli4.6711.0L. lactis2.41030.7S. coelicolor8.065.4

[0137]After SARD, 120 tags were sequenced. Chart II shows the expected number and percentage of tags compared to the observed number and percentage of tags for the population...

example 3

SARD Analysis of Environmental Bacterial Diversity

[0140]In order to demonstrate that the SARD method could be used to survey environmental bacterial diversity, total DNA was extracted from two soil samples (Wy-1 and Wy-2) taken from the Rocky Mountain Oilfield Testing Center (RMOTC, Casper, Wyo.) in October, 2000. The samples were collected about 0.5 miles apart and from a depth of 14-18 inches. The environmental DNA samples were subjected to SARD analysis as described in Example 1. In a preliminary analysis, 148 tags were identified from Wy-1 and 234 tags were identified.fromr Wy-2 (FIGS. 15 and 16, respectively).

[0141]In the Wy-1 sample, 58 distinct tags were identified and the abundance of each tag varied. The most abundant tag (ATGGCTGTCGTCAGCT) (SEQ ID NO: 6) made up about 34% of the population. This tag sequence is identical to many bacterial sequences in GenBank and its position within the 16S rDNA gene indicates that it is located in a conserved region located distal to the ...


PUM

PropertyMeasurementUnit
temperaturesaaaaaaaaaa
depthsaaaaaaaaaa
depthsaaaaaaaaaa

Abstract

The present invention relates to methods for performing surveys of the genetic diversity of a population. The invention also relates to methods for performing genetic analyses of a population. The invention further relates to methods for the creation of databases comprising the survey information and the databases created by these methods. The invention also relates to methods for analyzing the information to correlate the presence of nucleic acid markers with desired parameters in a sample. These methods have application in the fields of geochemical exploration, agriculture, bioremediation, environmental analysis, clinical microbiology, forensic science and medicine.

Description

[0001]This application is a divisional of application Ser. No. 09 / 829,855, filed Apr. 10, 2001, which in turn claims the benefit of U.S. provisional application Ser. No. 60 / 196,063, filed Apr. 10, 2000 and U.S. provisional application Ser. No. 60 / 196,258, filed Apr. 11, 2000.[0002]This Invention was made with Government support under Contract No. DE-FC36-01G011016 awarded by the Department of Energy. The Government has certain rights in this invention.TECHNICAL FIELD OF THE INVENTION[0003]The present invention relates to methods for performing surveys of the genetic diversity of a population. The invention also relates to methods for performing genetic analyses of a population. The invention further relates to methods for the creation of databases comprising the survey information and the databases created by these methods. The invention also relates to methods for analyzing the information to correlate the presence of nucleic acid markers with desired parameters in a sample. These ...

Claims


Application Information

Patent Timeline
Patent Type & Authority Patents(United States)
IPC IPC(8): C12Q1/68C12P19/34C07H21/02C07H21/04G16B30/20G01N33/48G01N33/50G06F19/00G16B20/40
CPCC12Q1/6809C12Q1/6888C12Q1/683G06F19/18Y10T436/21C12Q1/6869C12Q2525/191C12Q2525/151C12Q2521/313C12Q2535/138C12Q2525/131C12Q2600/156G16B30/00G16B20/00G16B30/20G16B20/40
Inventor ASHBY, MATTHEW
Owner TAXON BIOSCI
Why Eureka
Try Eureka