
Methods of predicting crop yield using metabolic profiling

a metabolic profiling and crop yield technology, applied in the field of plant breeding or genetic engineering, can solve the problems of reducing yield, senescence of leaves, and a drop in photosynthetic capacity, and achieve the effect of efficient crop management practices

Active Publication Date: 2016-04-12
SYNGENTA PARTICIPATIONS AG
View PDF11 Cites 10 Cited by
  • Summary
  • Abstract
  • Description
  • Claims
  • Application Information

AI Technical Summary

Benefits of technology

[0011]The methods herein provide novel methods of predicting a plant's yield through the measurement of specific metabolites either individually or in combination with one another in a specific plant reproductive sink tissue. The plant predictive methods described herein may be used to predict yield of plant populations as well as allow for more efficient crop management practices (e.g. amount and timing of chemical applications or amount of irrigation water applied to a field).
[0096]Water Use Efficiency (WUE) is a parameter frequently used to estimate the tradeoff between water consumption and CO 2 uptake / growth (Kramer, 1983, Water Relations of Plants, Academic Press p. 405). WUE has been defined and measured in multiple ways. One approach is to calculate the ratio of whole plant dry weight, to the weight of water consumed by the plant throughout its life (Chu et al., 1992, Oecologia 89:580). Another variation is to use a shorter time interval when biomass accumulation and water use are measured (Mian et al., 1998, Crop Sci. 38:390). Another approach is to utilize measurements from restricted parts of the plant, for example, measuring only aerial growth and water use (Nienhuis et al 1994 Amer J Bot 81:943). WUE also has been defined as the ratio of CO 2 uptake to water vapor loss from a leaf or portion of a leaf, often measured over a very short time period (e.g. seconds / minutes) (Kramer, 1983, p. 406). The ratio of 13 C / 12 C fixed in plant tissue, and measured with an isotope ratio mass-spectrometer, also has been used to estimate WUE in plants using C 3 photosynthesis (Martin et al., 1999, Crop Sci. 1775). As used herein, the term “water use efficiency” refers to the amount of organic matter produced by a plant divided by the amount of water used by the plant in producing it, i.e. the dry weight of a plant in relation to the plant's water use. As used herein, the term “dry weight” refers to everything in the plant other than water, and includes, for example, carbohydrates, proteins, oils, and mineral nutrients. It is contemplated that the transgenic plants produced by the methods described herein will confer an increase in water use efficiency.
[0101]The term “early vigor” refers to active healthy well-balanced growth especially during early stages of plant growth, and may result from increased plant fitness due to, for example, the plants being better adapted to their environment (optimizing the use of energy resources and partitioning between shoot and root). Plants having early vigor also show increased seedling survival and a better establishment of the crop, which often results in highly uniform fields (e.g. crops growing in a uniform fashion, such as the crops reaching various stages of development at substantially the same time), and often higher yields. Therefore, early vigor may be determined by measuring various factors, such as thousand kernel weight, percentage germination, percentage emergence, seedling growth, seedling height, root length, root and shoot biomass and many more.
[0102]As used herein, “seedling vigor” refers to the plant characteristic whereby the plant emerges from soil faster, has an increased germination rate (i.e., germinates faster), has faster and larger seedling growth and / or germinates faster under cold conditions as compared to the wild type or control under similar conditions. Seedling vigor has often been defined to comprise the seed properties that determine “the potential for rapid, uniform emergence and development of normal seedlings under a wide range of field conditions”.

Problems solved by technology

On the other hand rapid growth of a sink can sometimes compete with leaves for remobilizable nitrogen leading to senescence of the leaf and a drop in its photosynthetic capacity.
Because the seed are weak sinks, it is unable to attract stored reserves from source tissues.
Seed abortion may occur when concurrent photosynthate is insufficient to meet the needs of reproductive growth, resulting in dramatically decreased yield, or in the case of maize ear, barreness.
Varied experimental approaches have demonstrated that treatments, which decrease the plant carbon exchange rate (CER) around anthesis, decrease grain yield.
Collectively, these results suggest that kernel number may be limited by carbohydrate supply, particularly during drought stress at anthesis.

Method used


Image

  • Methods of predicting crop yield using metabolic profiling
  • Methods of predicting crop yield using metabolic profiling
  • Methods of predicting crop yield using metabolic profiling

Examples


example 1

Plant Tissue Sampling

[0190]Four maize lines (A. B, C, and D) were selected for the study based upon the lack of close genetic relation to each other and because they had shown varied nitrogen use efficiencies in a previous year of testing. The field study was machine planted. A complete factorial in a randomized complete block design with four replications was used in which hybrid and N rate were the treatment factors. Each plot consisted of four rows, 17.5 feet in length and spaced 2.5 feet apart. A soil-applied insecticide (tefluthrin) was applied in furrow at a rate of 0.099 lb a.i. acre−1. Weed control consisted of a pre-emergence application of Lumax (S-metolachlor+atrazine+mesotrione) at the labeled rate. N was applied as ammonium sulfate ((NH4)2SO4) in a diffuse band after emergence and incorporated between V2 and V3. The N treatments were applied to between and on either side of the middle two rows of each four row plot. The N rates were 0, 50, 100, 150, and 200 lbs N per ac...

example 2

First Metabolic Profiling Study

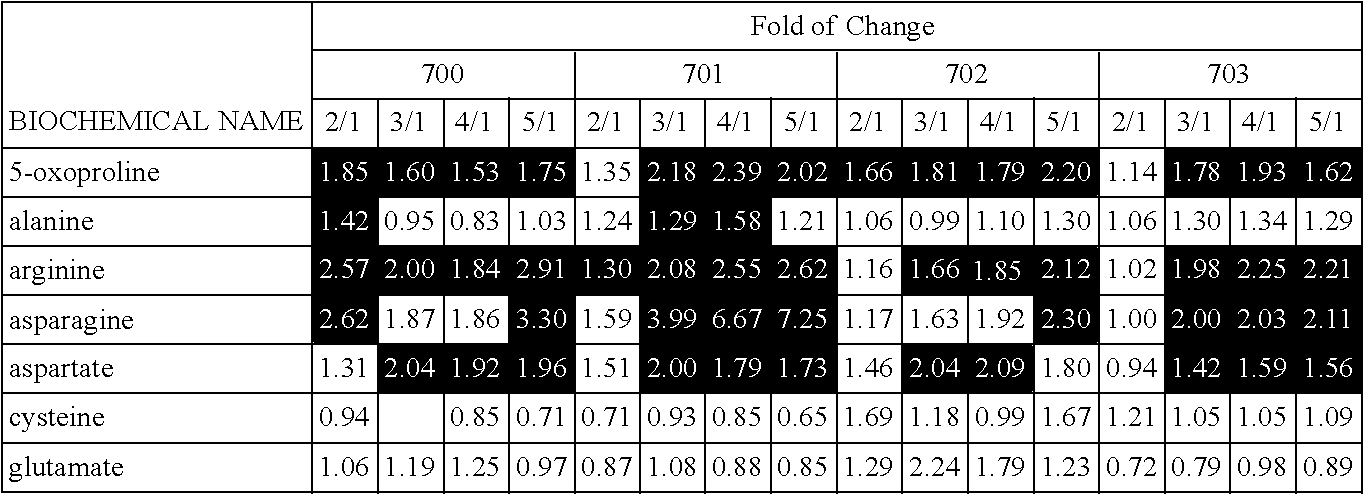
[0193]Samples from Example 1 were ground to a fine powder in a modified shredder under dry ice conditions and then sent for metabolite profiling and statistical analysis. Each sample was then analyzed for 267 metabolites using methods essentially as described in Anal. Chem., 2009, 81 (16), pp 6656-6667; and herein incorporated by reference. For visualization of biochemical differences between the various treatment groups, the data are displayed in line plot format. From this analysis, several metabolites profiled in corn un-pollinated ear shoots were shown to positively correlate with yield. The metabolite glutamine measured from unpollinated ear shoots showed a high correlation to yield (approximately 0.89). Likewise, 5-oxoproline, aspartate, arginine and proline metabolite levels measured in unpollinated ear shoots also correlated to grain yield (>0.80). The table below shows the metabolites with the highest positive correlation to yield prediction.

[...

example 3

Re-Analysis of Metabolic Data

[0201]Data Normalization and Preprocessing:

[0202]Raw and imputed data generated in Example 2 was reanalyzed using different methods. The raw data consisted of measurements of all of the metabolites identified in the study by various chromatographic methods. The imputed data is the raw data that has been median normalized where missing values are imputed using the lowest value of a given metabolite. Either raw or imputed data was loaded into SimcaP+12™ software from Umetrics™. All of the metabolite values for the various samples were entered as “X” variables and yield and NUE data were designated “Y” variables. There were a total of 1861 (8.5%) missing values in the raw data for this study. There were no missing data points with the imputed data.

[0203]Data Analysis

[0204]Principal component analysis was performed on the raw, non-imputed data to determine the greatest sources of variance. A total of 10 significant components were detected in the data. A plo...


PUM

PropertyMeasurementUnit
temperatureaaaaaaaaaa
pHaaaaaaaaaa

Abstract

The present invention relates to the fields of agriculture, plant breeding or genetic engineering for plants with increased yield, crop forecasting and crop management. In particular, the methods herein describe novel methods of predicting a plant's yield through the measurement of specific metabolites either individually or in combination with one another in a specific plant reproductive tissue. The plant predictive methods described herein may be used to predict yield of plant populations as well as allow for more efficient crop management practices (e.g. amount and timing of chemical applications or amount of irrigation water applied to a field).

Description

FIELD OF THE INVENTION[0001]The present invention relates to the fields of agriculture, plant breeding or genetic engineering for plants with increased yield, crop forecasting and crop management. In particular, the methods herein describe novel methods of predicting a plant's yield through the measurement of specific metabolites either individually or in combination with one another in a specific plant reproductive tissue. The plant predictive methods described herein may be used to predict yield of plant populations as well as allow for more efficient crop management practices (e.g. amount and timing of chemical applications or amount of irrigation water applied to a field). These and more utilities enabled by the novel predictive methods described herein are described in further detail herein.STATEMENT REGARDING ELECTRONIC SUBMISSION OF A SEQUENCE LISTING[0002]A Sequence Listing in ASCII text format, submitted under 37 C.F.R. §1.821, entitled 73051 US REG ORG P 1 07FEB2014 SeqLis...

Claims


Application Information

Patent Timeline
Patent Type & Authority Patents(United States)
IPC IPC(8): G01N33/50G06G7/75A01H1/04G01N33/48A01C21/00
CPCA01H1/04A01C21/007G01N33/5097G01N33/48G06G7/75G01N33/5038Y02A40/10
Inventor DUNCAN, KATERICOHN, JONATHANGUO, LININGDESAI, NALINIMITCHELL, MATTHEWWULFF, JACOB
Owner SYNGENTA PARTICIPATIONS AG
Learn More