Weak affinity chromatography
a chromatography and weak affinity technology, applied in the field of target compound analysis, can solve problems such as interference problems and physical detection challenges of target compounds
- Summary
- Abstract
- Description
- Claims
- Application Information
AI Technical Summary
Benefits of technology
Problems solved by technology
Method used
Image
Examples
example 1
Column Preparation
[0070]Four columns were prepared, a blank diol-silica column (column A) having no binding ligands and 3 columns (columns B, C, D) loaded with albumin as the binding ligand. Column B was a silica packed column (7 μm, 300 Å porosity) loaded with 96% purity bovine serum albumin (BSA) at a concentration of 66 mg of BSA per gram of silica. Column C was a silica packed column (7 μm, 300 Å porosity) loaded with 99% purity bovine serum albumin (BSA) at a concentration of 77 mg of BSA per gram of silica. Column D was a silica packed column (7 μm, 300 Å porosity) loaded with 99% purity human serum albumin (HSA) at a concentration of 118 mg of HSA per gram of silica. All four column dimensions were 2.1×50 mm stainless steel. Immobilization of the ligands was performed batchwise with periodate activation. 0.5 g of diol-silica was used with 5 ml of H2O added. The silica was sonicated for 2 minutes, and 0.5 g of periodic acid was added to convert the diol groups to aldehyde-grou...
example 2
Steroid Detection
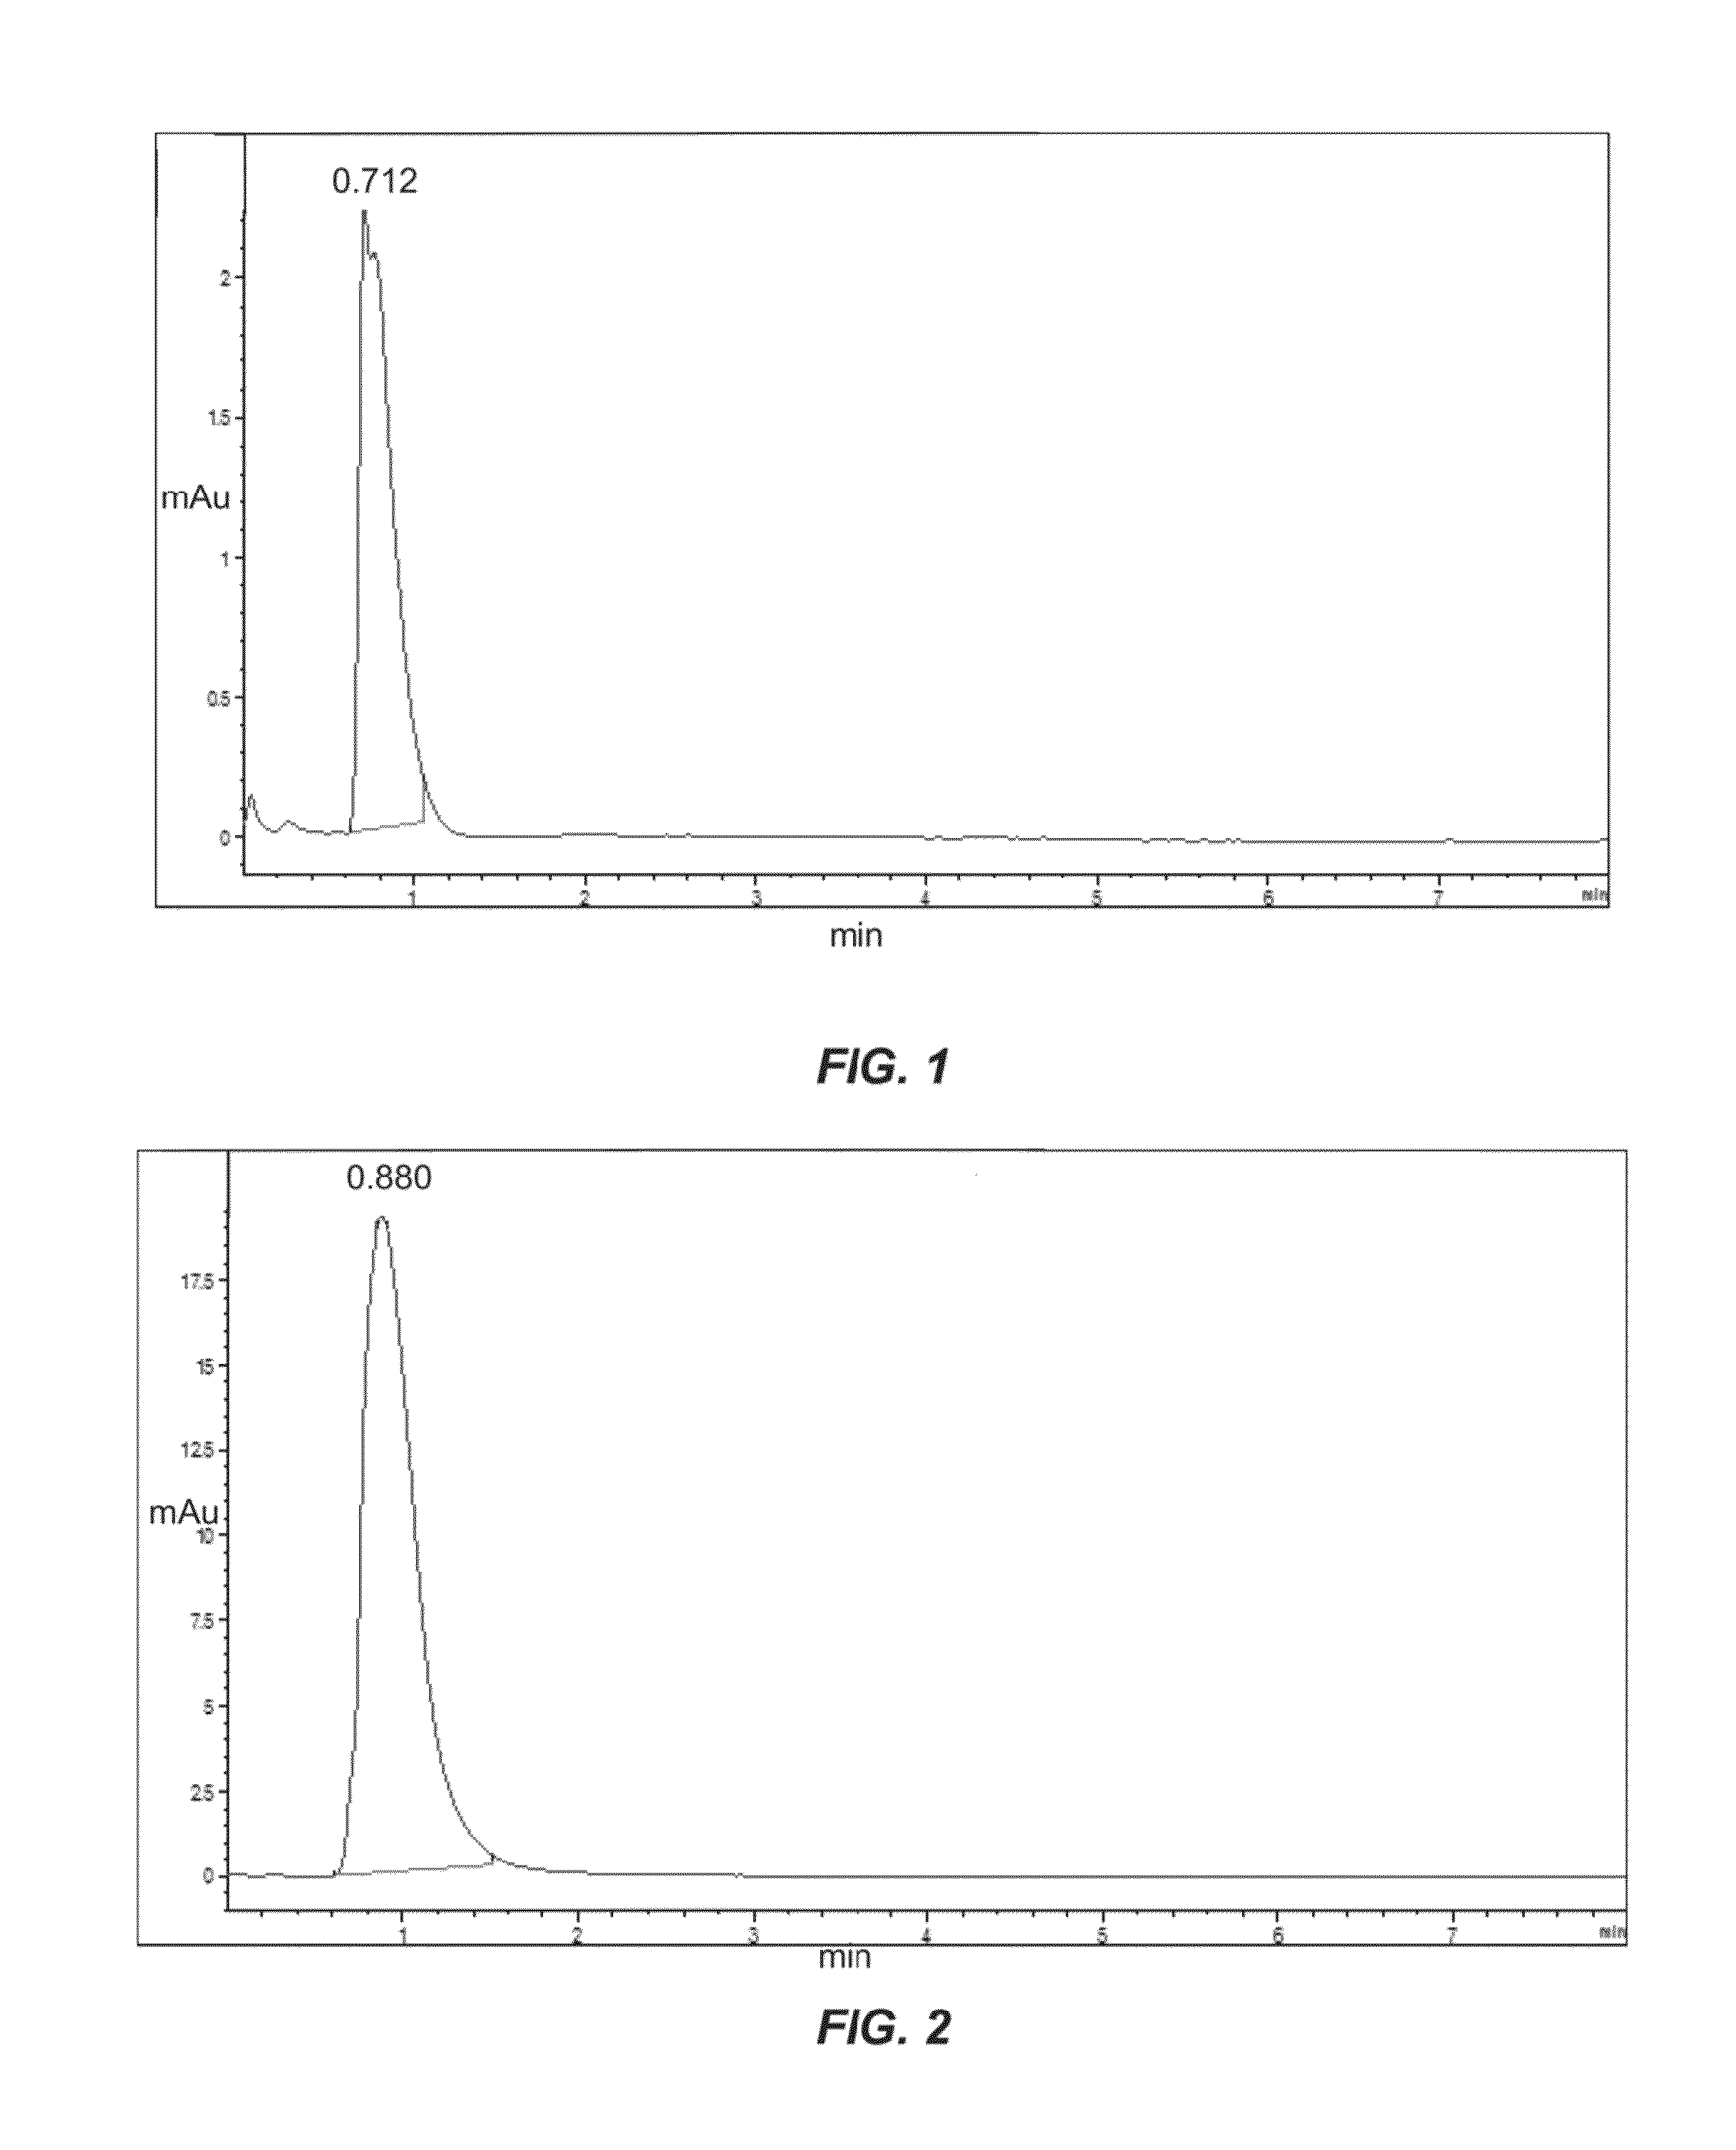
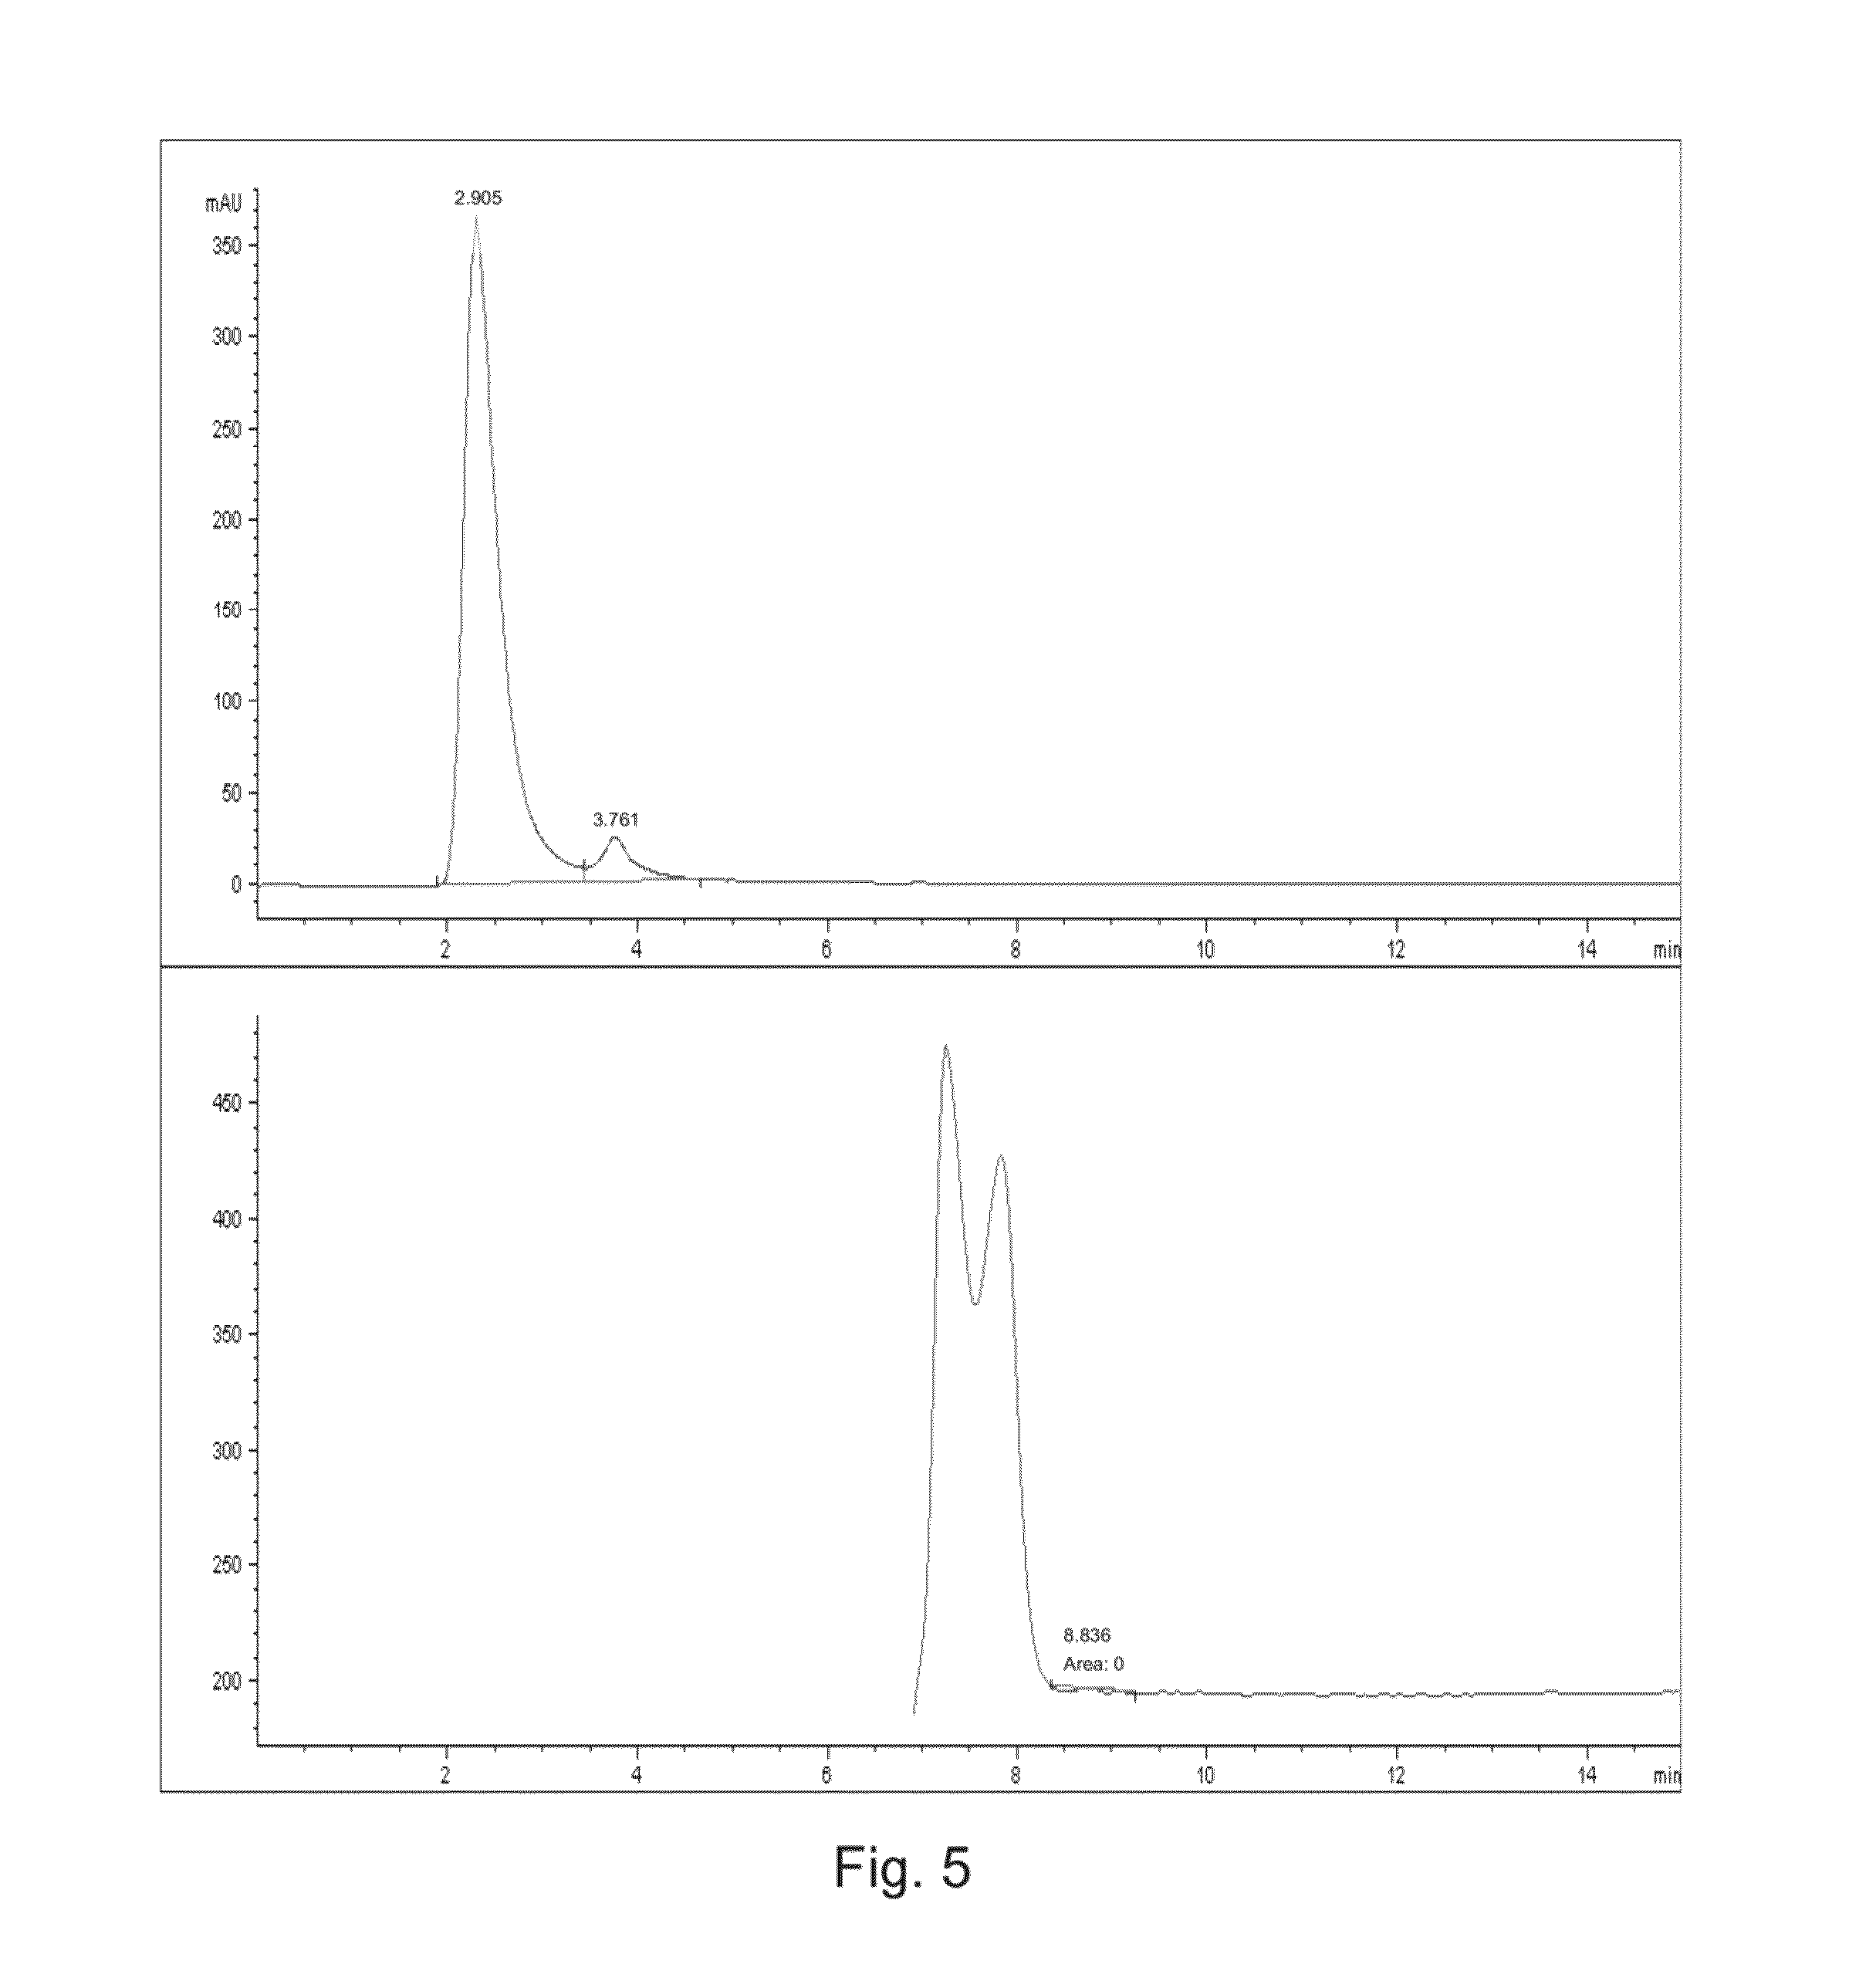
[0076]Four steroids, cortisone, hydrocortisone, prednisone, and prednisolone were tested on columns A-D of Example 1. The system comprised the columns used in an Agilent 1200-LC-MS system. The steroids were all dissolved in ethanol at a concentration of 0.05 μg / μl. 2 μl samples were run in duplicate. Solvent buffers used included phosphate buffered saline (PBS) at pH 7.4 and 5 mM ammonium-acetate (Am-Ac) salt, pH 6.9. Column temperature was 20° C. with a flow rate of 0.400 ml / min. Detection included the use of UV diode-array detector (DAD) at 237 nm.
[0077]The columns were tested with the PBS buffer and the Am-Ac listed above. The capacity factor (k′) and dissociation constant (Kd) were determined as set forth in U.S. Pat. No. 4,879,247 issued on Nov. 7, 1989 to Sten Ohlson, which is hereby incorporated by reference in its entirety. The results are listed in Tables 1-4.
[0078]
TABLE 1k′ for PBS bufferSteroidColumn AColumn BColumn CColumn DCortisone0.241.141.292.54Hydro...
example 3
Elution Time of Serum
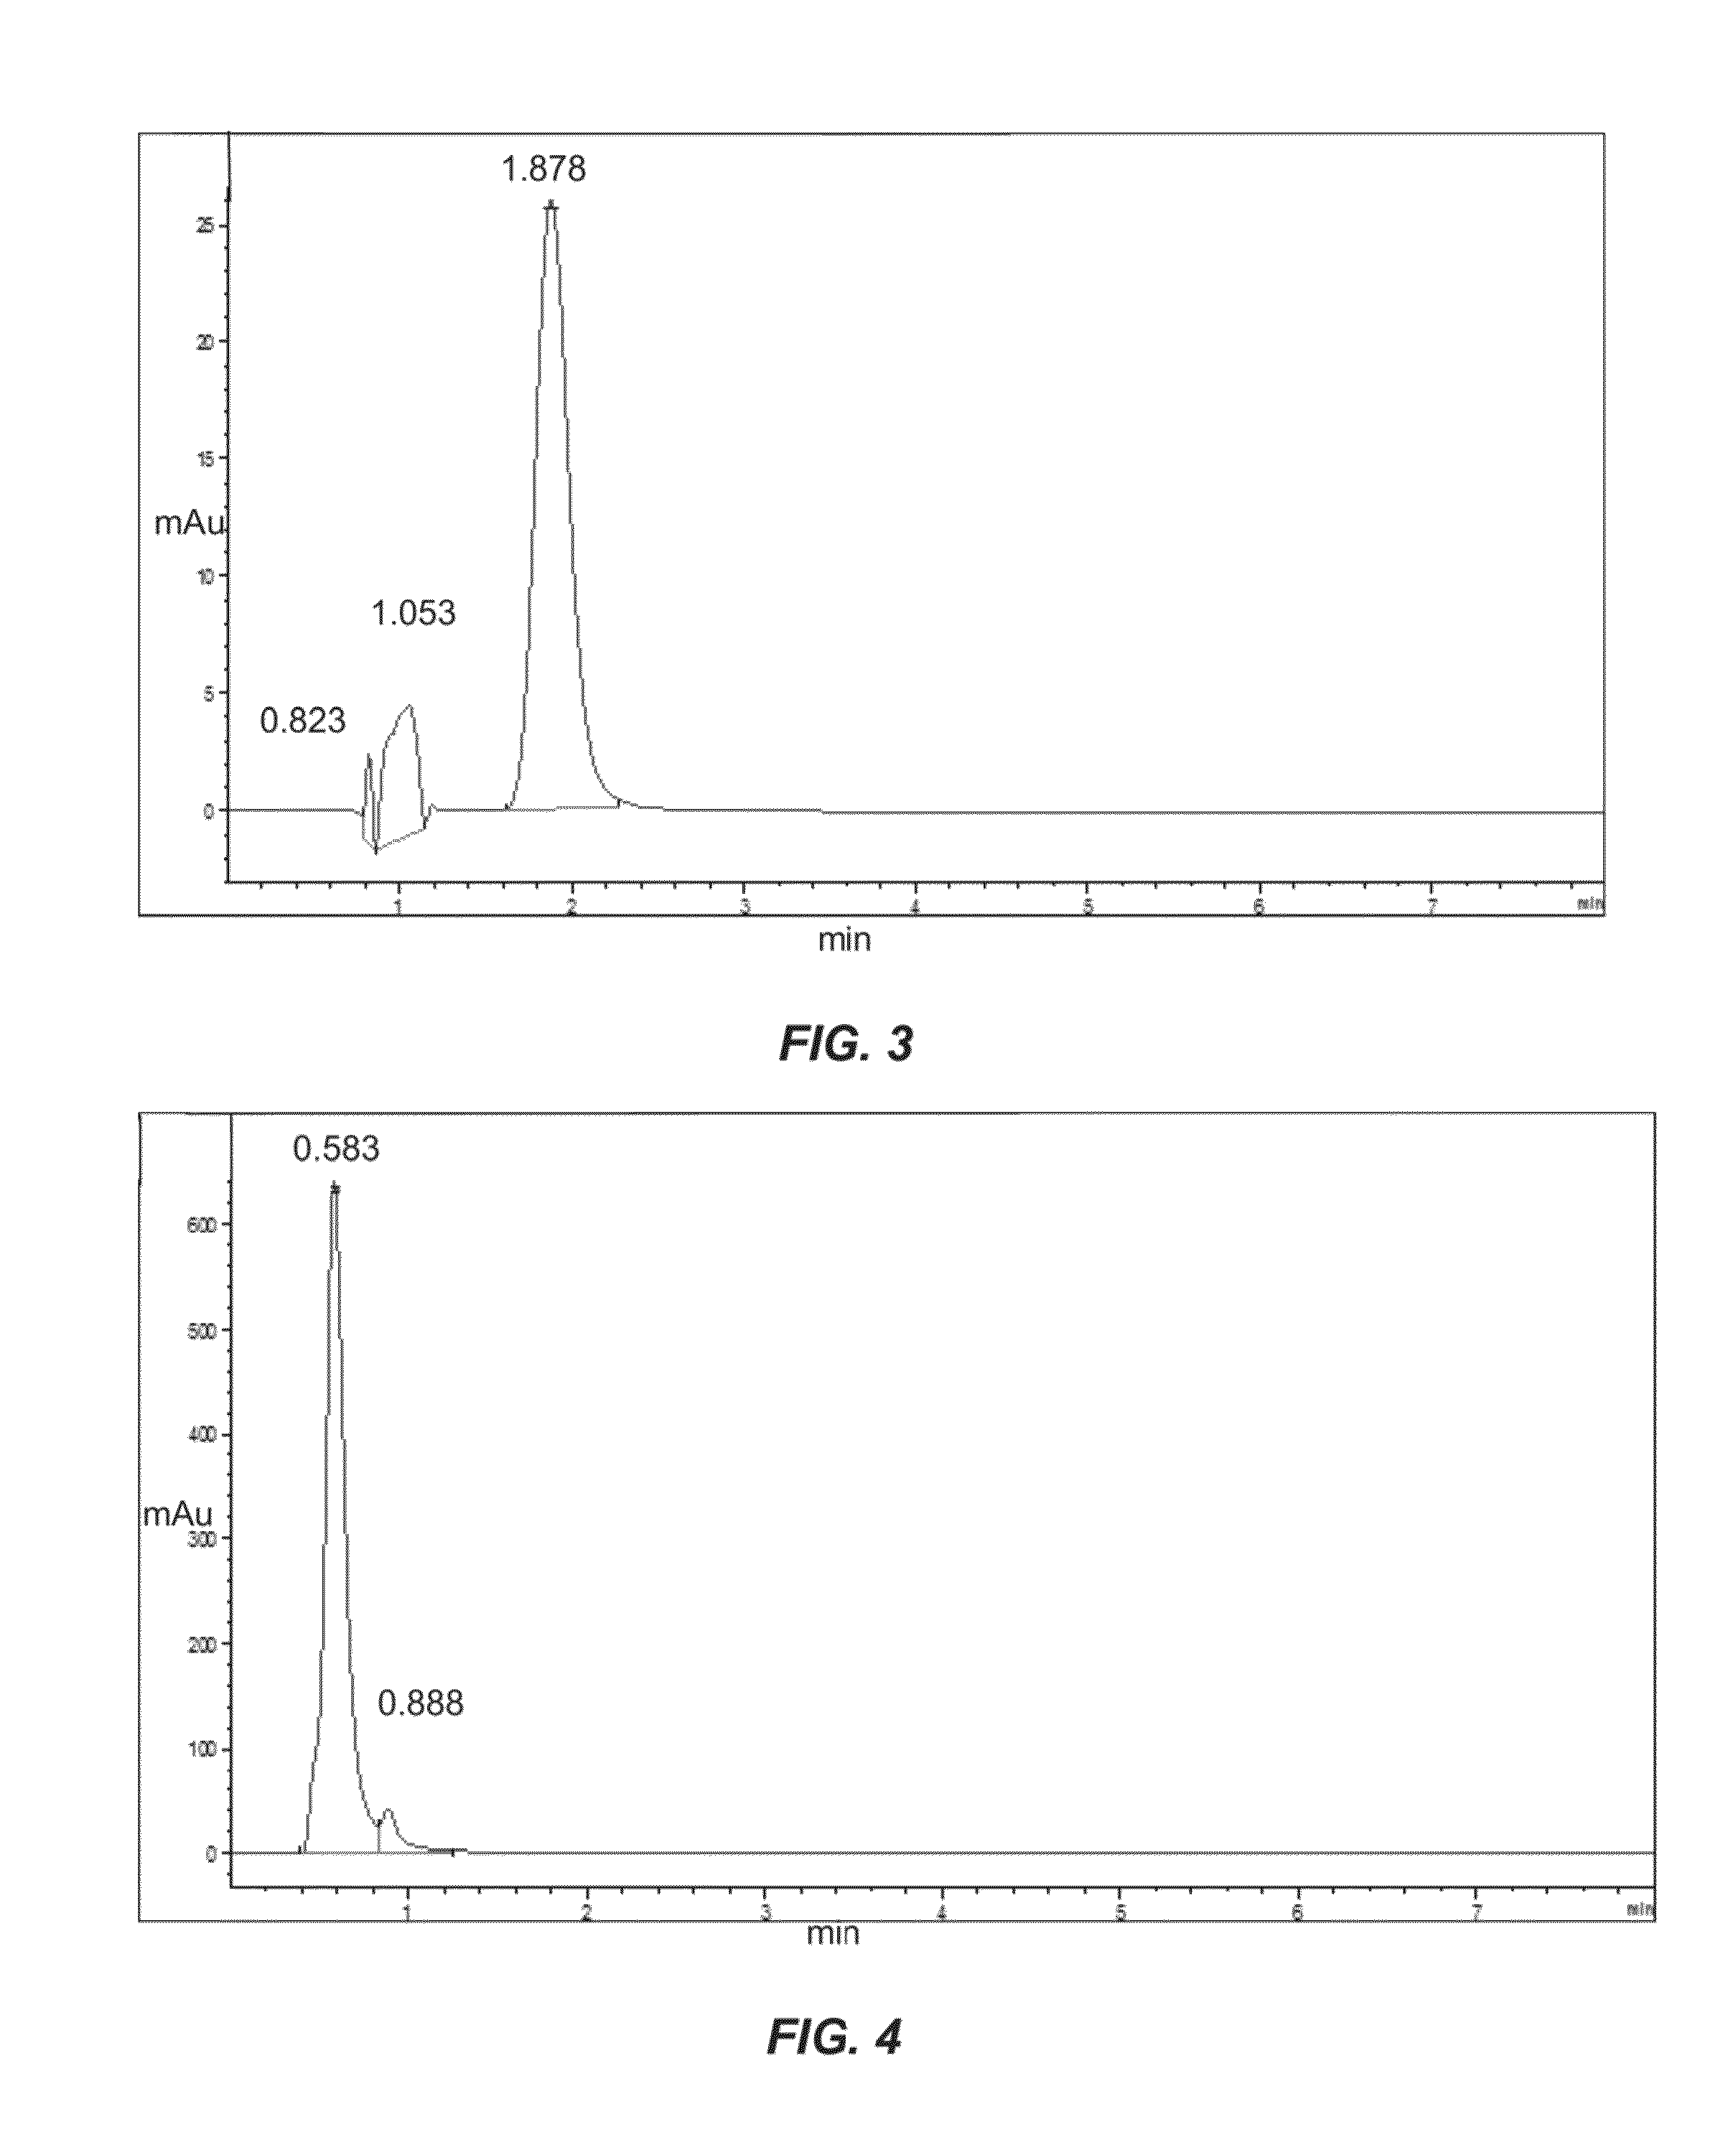
[0083]Column C of Example 1 was loaded with n-Serum (pool from healthy volunteers) to determine elution time. Specifically, 2 μl of diluted n-serum, 1:10 with PBS was injected on column C, to see protein-level remaining on the column, as compared to elution time of steroids. A chromatogram of the serum on column C is shown in FIG. 4.
[0084]The serum peak eluted with the void of the column. At about 0.58 min, approximately 95% of the serum proteins eluted. Based on the chromatogram and examples provided herein, the steroids general appear at about 1.5-1.8 minutes. As such, the present columns can be used to separate steroids from serum and can be combined with mass spectrometry for subsequent detection.
PUM
| Property | Measurement | Unit |
|---|---|---|
| concentration | aaaaa | aaaaa |
| porosity | aaaaa | aaaaa |
| porosity | aaaaa | aaaaa |
Abstract
Description
Claims
Application Information
 - R&D
- Intellectual Property
- Life Sciences
- Materials
- Tech Scout
- Unparalleled Data Quality
- Higher Quality Content
- 60% Fewer Hallucinations
Browse by: Latest US Patents, China's latest patents, Technical Efficacy Thesaurus, Application Domain, Technology Topic, Popular Technical Reports.
© 2025 PatSnap. All rights reserved.Legal|Privacy policy|Modern Slavery Act Transparency Statement|Sitemap|About US| Contact US: help@patsnap.com


