

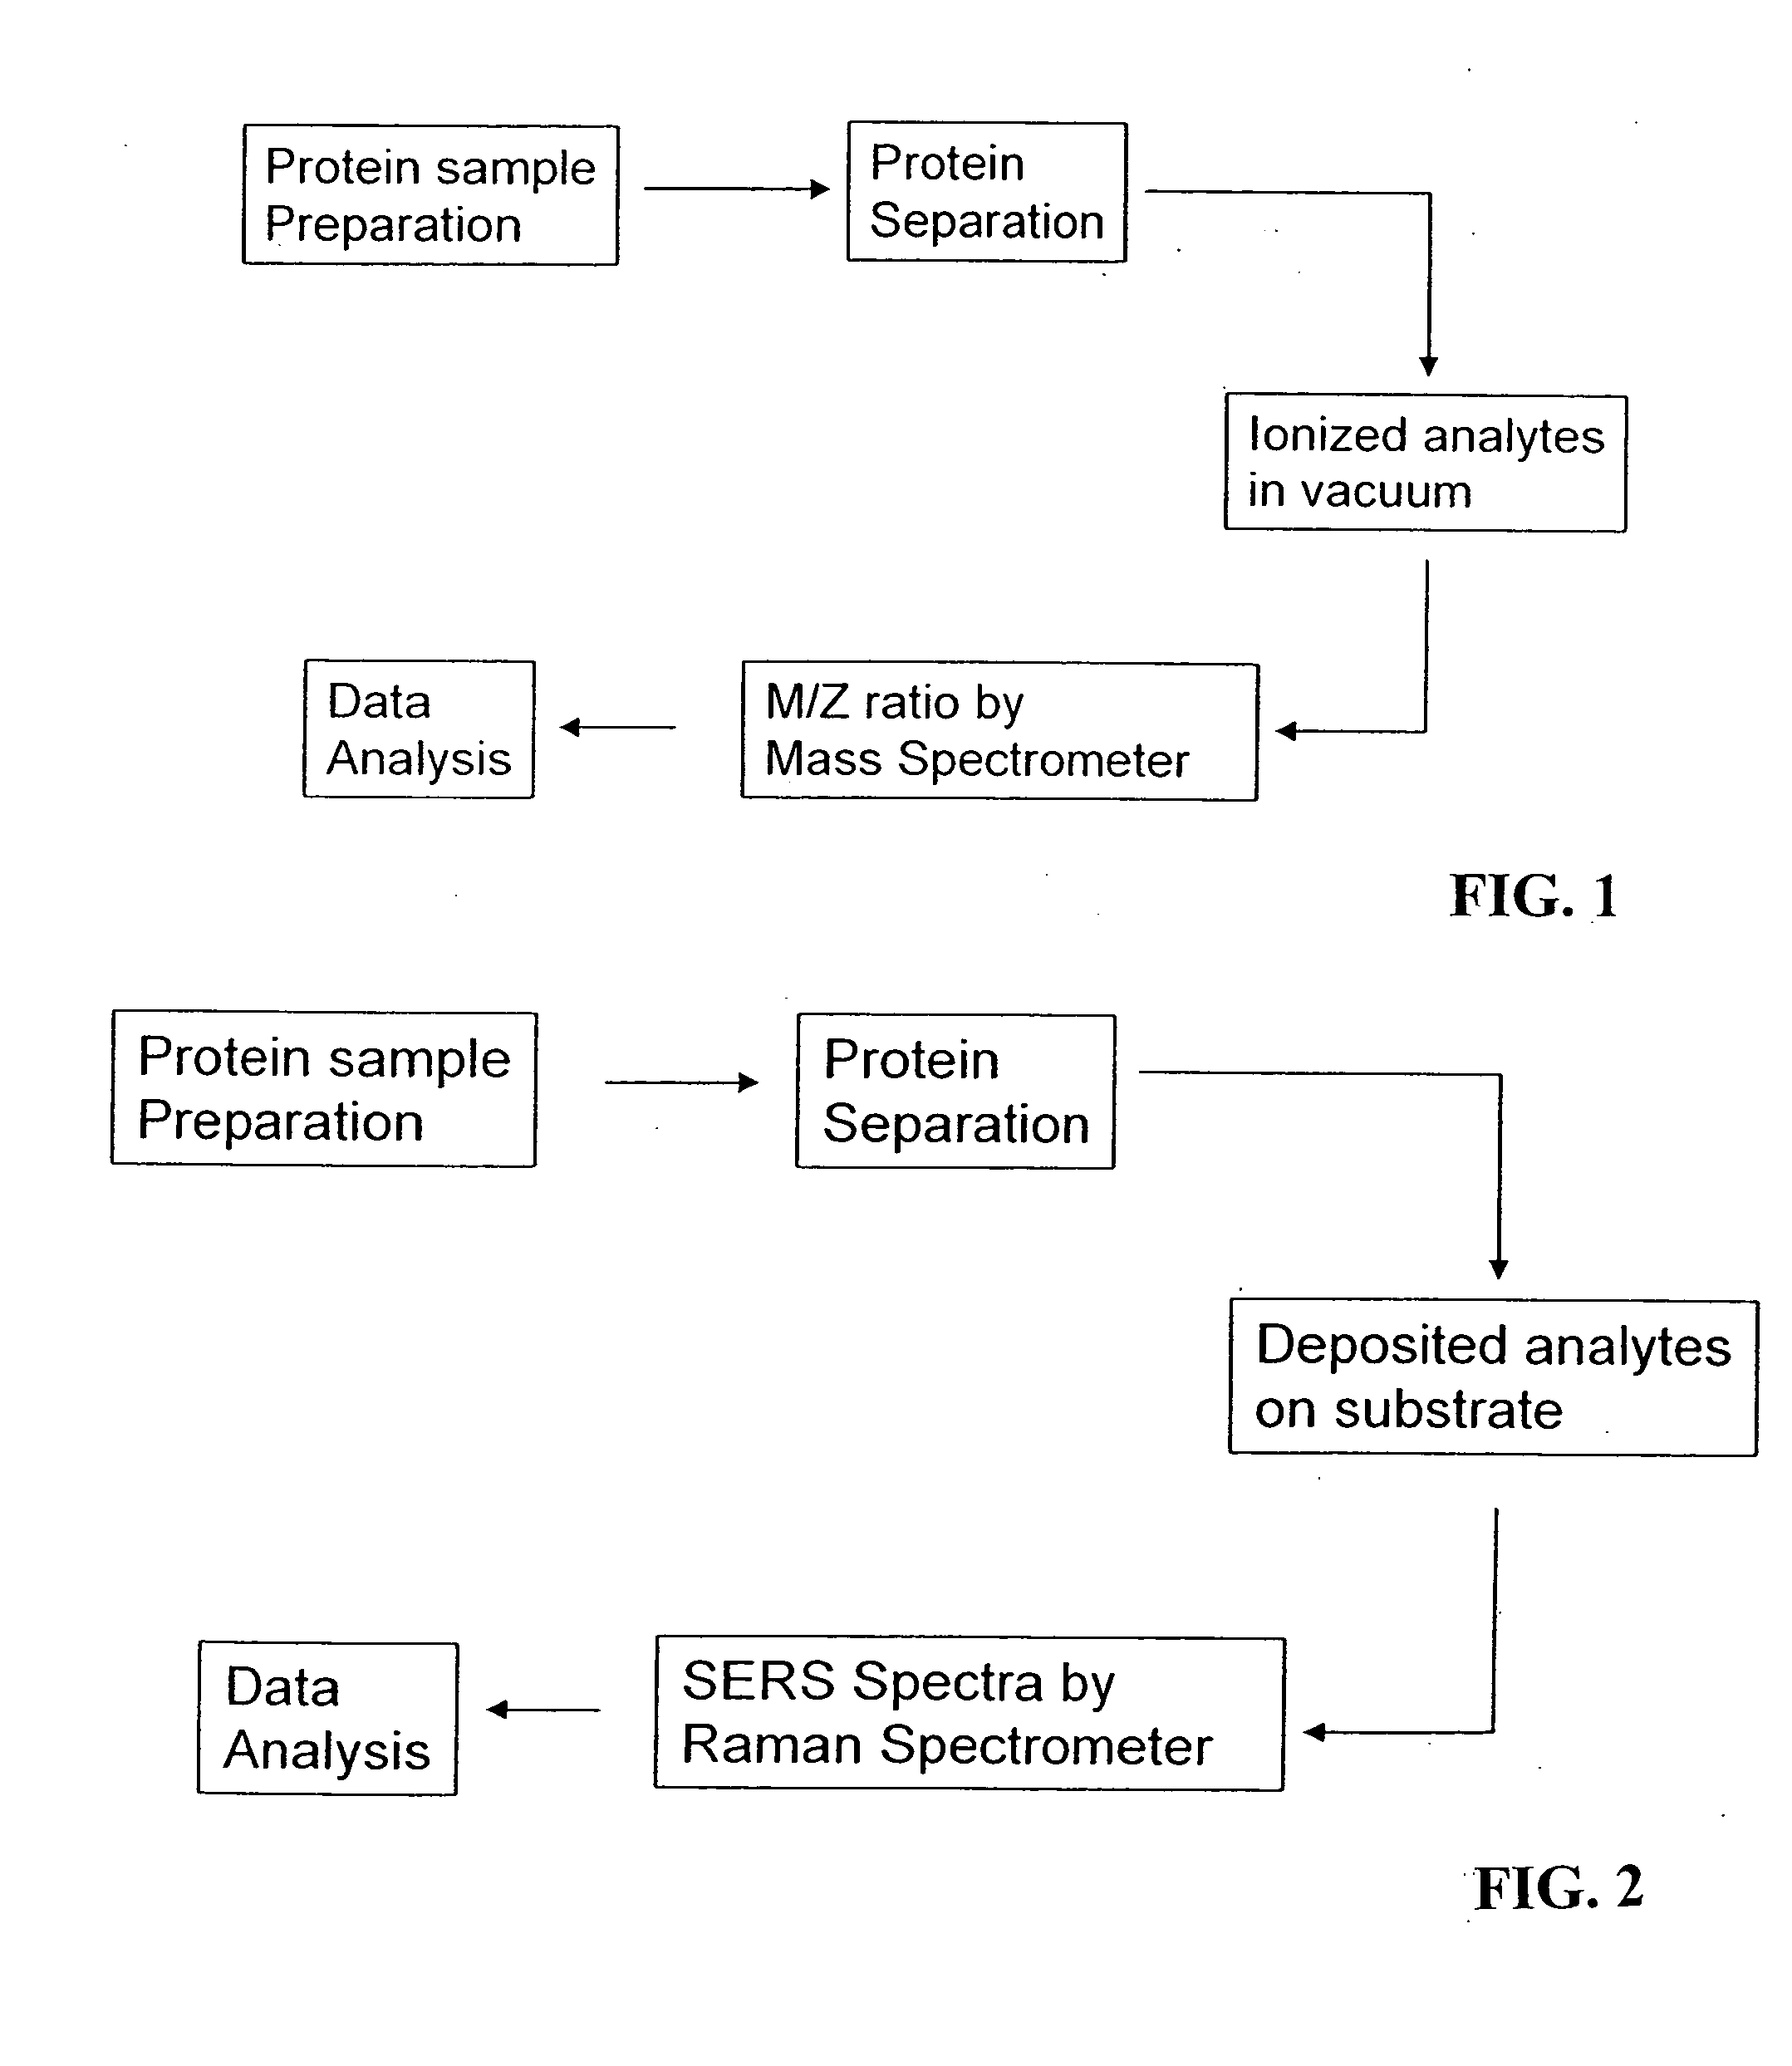
Methods for using raman spectroscopy to obtain a protein profile of a biological sample
a biological sample and protein profile technology, applied in the field of raman spectroscopy to obtain a protein or peptide profile of a complex biological sample, can solve the problems of inability to detect, identify or quantify post-translational protein modifications, no protein profiling technology that can approach, and general limited qualitative analysis of such analytes
- Summary
- Abstract
- Description
- Claims
- Application Information
AI Technical Summary
Problems solved by technology
Method used
Image

Examples
example 1
Experiments on Standard Peptides.
[0073] Standard peptides as shown in Table 1 below were synthesized and 10 μl of stock solution (100 ng / μl) of standard peptides was deposited onto discrete locations on an aluminum substrate and left to dry. Raman spectroscopy was performed with SERS colloidal solution of 80 μl of 1:2 colloidal silver / water and 20 nl of 0.5 M LiCl. A total of 1500 spectra were collected for each peptide: 5 experiments @ 3 scans each for 100 frames. To understand whether Raman signals of peptides can be distinguished after normalization of spectra, principal components analysis (PCA) was performed. FIG. 7 shows the Raman spectra collected for each of the peptides. The results of the PCA analysis are shown in FIG. 8.
TABLE 1Peptide Standardssample IDDescription1Neurotensin - pGlu-Leu-Tyr-Glu-Asn-Lys-Pro-Arg-Arg-Pro-Tyr-Ile-Leu (SEQ ID NO: 1)2ACTH (7-38) - Phe-Arg-Trp-Gly-Lys-Pro-Val-Gly-Lys-Lys-Arg-Arg-Pro-Val-Lys-Val-Tyr-Pro-Asn-Gly-Ala-Glu-Asp-Glu-Ser-Ala-Glu-Ala...
example 2
[0074] The purpose of this experiment was to determine optimal sample detection conditions for obtaining a protein profile of a model complex protein without Raman tagging or labeling of protein targets. Reagent grade calf cell culture serum was used as the sample source. In the first experiment, three sets of samples of whole calf serum deposited on aluminum substrate and either air-dried or wet tested after each step in application of a covering of colloidal silver (containing 160 μL Ag in 1:2 dilution with water)+BSA (20 μL 1% BSA)+LiCl (40 μL 0.5M LiCl) were prepared. Table 2 below shows the combinations of sample detection conditions for each sample. The samples were excited at a wavelength range from 820 to 900 and the SERS signals were collection for 1 sec. tests. Only samples 5 (wet-dry-wet) and 9 (wet-wet-wet) yielded SERS spectra, showing that wet samples are preferable to dry samples under these conditions.
TABLE 2Sample #Colloidal Silver Soln.BSALiCl1WetDryDry2DryWetDry...
example 3
[0077] The purpose of this experiment was to determine optimal conditions for obtain SERS data from HPLC separated protein fractions of a complex protein sample containing intact proteins, using calf serum as the model sample. In preparation for this experiment, low molecular weight protein standards were fractionated by HPLC. A concentration of 1.33 μg / μl in 1×PBS was used for each, with an injection volume of 10 μl. The standards used were Phosphorylase (97 kDa); BSA (66 kDa); Ovalbumin (45 kDa); Carbonic anhydrase (30 kDa); Trypsin inhibitor (20.1 kDa); and Alpha-lactalbumin (14.4 kDa).
[0078] After filtering with a 0.45 μm spin filter by centrifuging at 14000 rpm for 10 minutes, calf serum was separated by HPLC at 1:30 dilution in water using a Zorbax GF-220 column and injection volume of 10 μl. Fractions 1-11 were collected over 12.5 min elution time and one additional fraction was collected after about 20 min. It was found that the concentrations of proteins were very low to o...
PUM
| Property | Measurement | Unit |
|---|---|---|
| diameter | aaaaa | aaaaa |
| inner diameter | aaaaa | aaaaa |
| flow rate | aaaaa | aaaaa |
Abstract
Description
Claims
Application Information