Fluorescent protein sensors for detection of analytes

a technology of fluorescence protein and analytes, which is applied in the direction of peptide sources, instruments, peptides, etc., can solve the problems of many technical problems of relative low molecular weight indicators, and achieve the effect of limiting the sensitivity of fret measuremen

Inactive Publication Date: 2006-05-25
RGT UNIV OF CALIFORNIA
View PDF9 Cites 34 Cited by
  • Summary
  • Abstract
  • Description
  • Claims
  • Application Information

AI Technical Summary

Benefits of technology

[0034] The invention can have one or more of the following advantages. Ligand-induced conformational changes can be monitored by FRET if, for example, the amino and carboxy termini of the binding protein are fused to a donor and acceptor GFP. This approach has several advantages over the usual covalent labeling with fluorescent probes. The fluorescent indicator can be generated in situ by gene transfer into the cells or organisms. This approach avoids the need to express and purify large quantities of soluble recombinant protein, purify and label it in vitro, microinject it back into cells. The fluorescent indicator can be targeted to cellular structures. The sites of fusion between the moieties of the fluorescent indicator are exactly defined, giving a molecularly homogenous product without relying on elaborate protein chemistry. In addition, the chromophore of GFP is fixed in the protein. See, Ormo, M., et al., Science 273:1392-1395 (1996). If the GFP donor and acceptor are fused to a host protein rigidly, minor changes in the relative orientation of the ends of the latter would alter FRET. In contrast, most conventional fluorescent labels are attached by flexible linkers that at least partially decouple the fluorophore orientation from that of the protein to which it is attached, limiting the sensitivity of the FRET measurement.

Problems solved by technology

These relatively low molecular weight indicators can suffer from many technical problems relating to ester loading, leakage of the dyes from the cell, compartmentation in organelles, and perturbation of the indicators by cellular constituents.

Method used


Image

  • Fluorescent protein sensors for detection of analytes
  • Fluorescent protein sensors for detection of analytes
  • Fluorescent protein sensors for detection of analytes

Examples


examples

Gene Construction

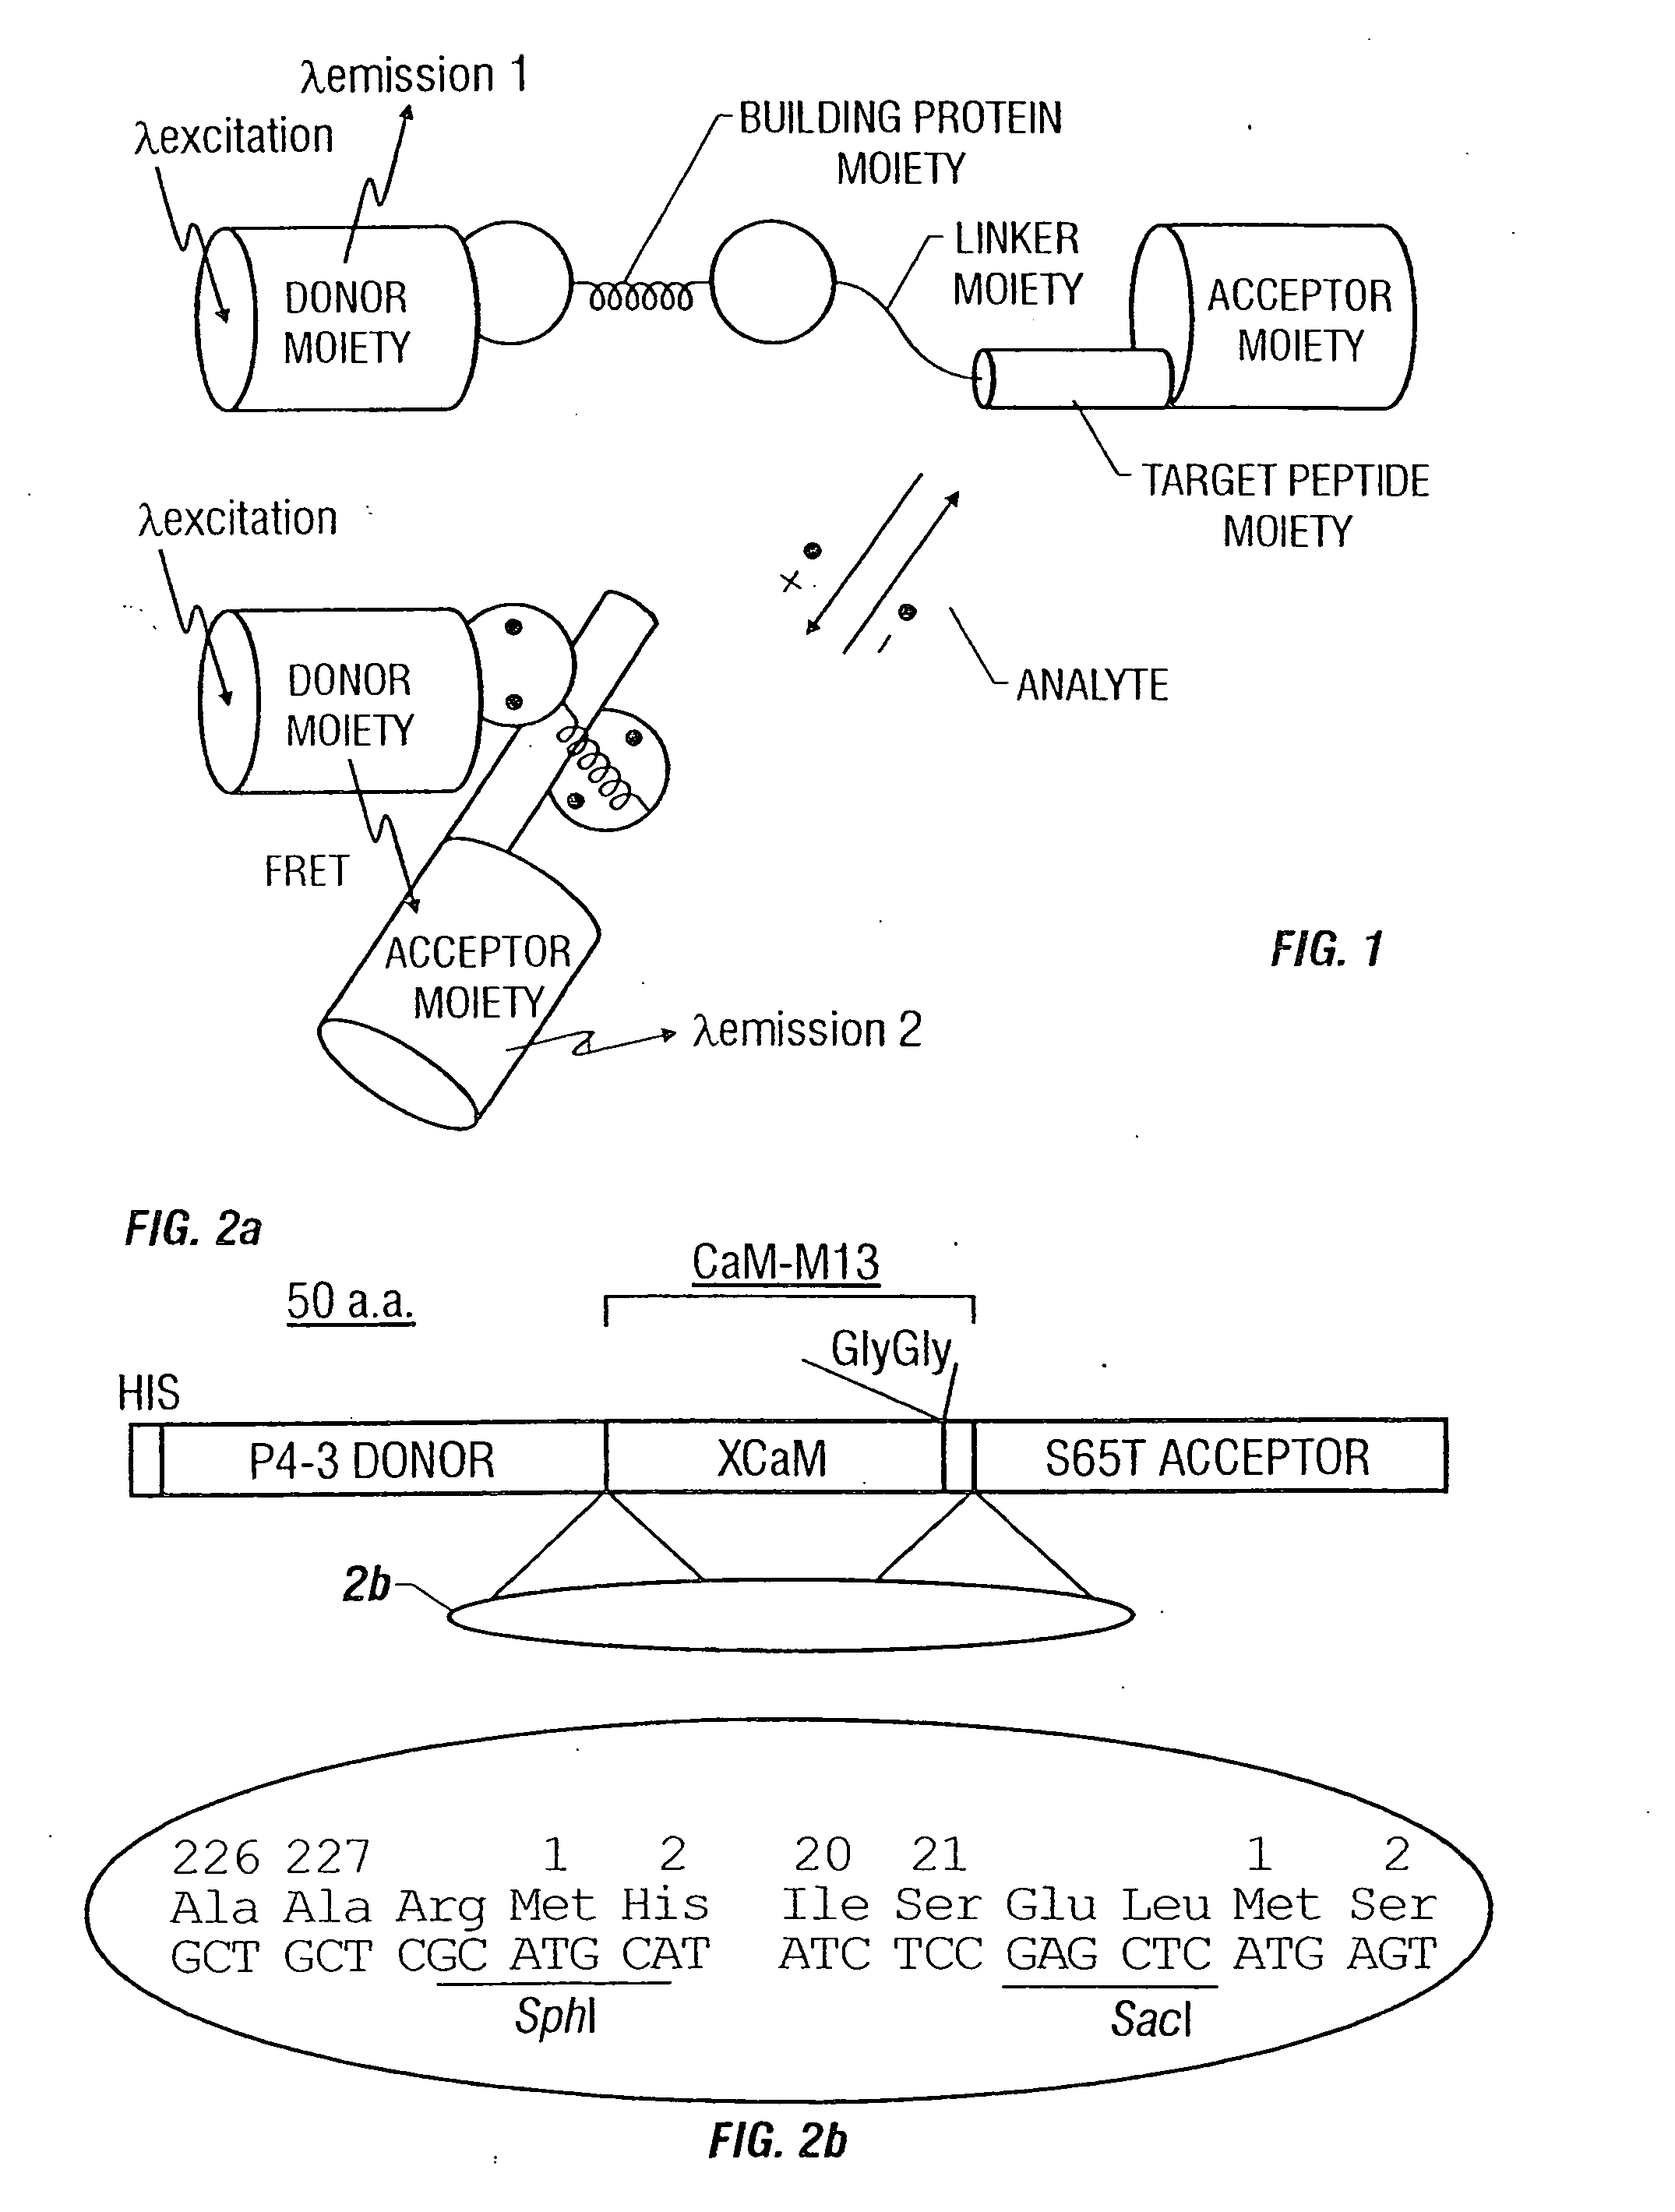
[0126] The cDNA of the GFP mutant P4-3 was amplified by PCR with a sense primer containing a BamHI site, and a reverse primer containing an SphI site and eliminating the GFP stop codon. See, for example, Heim, R. & Tsien, R. Y. Current Biol. 6:178-182 (1996). Likewise, the cDNA of S65T was amplified with a SacI site and an EcoRI site introduced to the 5′ and 3′ ends of the gene, respectively. Two restriction sites (SphI and SacI) were introduced by PCR into 5′ and 3′ ends of the CaM-M13 gene, respectively, using the pHY1 as a template. See, Porumb, T., et al. Prot. Engineering 7:109-115 (1994). All the amplification reactions were done by Pfu polymerase (Stratagene). The restricted products were ligated and cloned in-frame into the BamHI / EcoRI sites of pRSETB (Invitrogen). The modifications of the boundary regions between P4-3 and CaM and between M13 and S65T were performed by PCR or by a combined use of restriction enzymes, Klenow fragment of DNA polymerase I, T4...


PUM

PropertyMeasurementUnit
diameteraaaaaaaaaa
dissociation constantsaaaaaaaaaa

Abstract

Fluorescent indicators including a binding protein moiety, a donor fluorescent protein moiety, and an acceptor fluorescent protein moiety are described. The binding protein moiety has an analyte-binding region which binds an analyte and causes the indicator to change conformation upon exposure to the analyte. The donor moiety and the acceptor moiety change position relative to each other when the analyte binds to the analyte-binding region. The donor moiety and the acceptor moiety exhibit fluorescence resonance energy transfer when the donor moiety is excited and the distance between the donor moiety and the acceptor moiety is small. The indicators can be used to measure analyte concentrations in samples, such as calcium ion concentrations in cells.

Description

STATEMENT AS TO FEDERALLY SPONSORED RESEARCH [0001] This invention was made with Government support under Grant No. NS27177, awarded by the National Institutes of Health. The Government has certain rights in this invention.BACKGROUND OF THE INVENTION [0002] The invention relates to fluorescent protein sensors for detecting and quantifying analytes. [0003] Measurement of an analyte concentration in vitro or in vivo by non-invasive techniques can help elucidate the physiological function of the analyte. This can also aid in identifying changes that occur in a cell or organism in response to physiological stimuli. For example, cyclic AMP can be detected by fluorescence resonance energy transfer between a separately labeled proteins that associate with each other but are not covalently attached to each other. See, U.S. Pat. No. 5,439,797. [0004] For example, many effects of Ca2+ in cells are mediated by Ca2+ binding to calmodulin (CaM), which causes CaM to bind and activate target prote...

Claims


Application Information

Patent Timeline
Patent Type & Authority Applications(United States)
IPC IPC(8): A01K67/027C07K14/435G01N33/542
CPCA01K2217/05C07K14/43595C07K2319/00G01N33/542
Inventor TSIEN, ROGERMIYAWAKI, ATSUSHI
Owner RGT UNIV OF CALIFORNIA
Why Eureka
Try Eureka