Method for assessing biofilms

a biofilm and biochemical technology, applied in the field of biofilm characterization, can solve the problems of affecting the detection efficiency of biofilms, and widespread problems in the industry, and achieve the effects of sacrificing resolution, low noise, and high detection efficiency

Inactive Publication Date: 2006-12-07
GE HEALTHCARE LTD
View PDF3 Cites 27 Cited by
  • Summary
  • Abstract
  • Description
  • Claims
  • Application Information

AI Technical Summary

Benefits of technology

[0126] One embodiment uses a continuous-read line-camera, and in a preferred embodiment a rectangular CCD is used as a line-camera. Both embodiments have no dead-time between lines within an image or between images. An additional advantage of the present invention is that a larger effective field-of-view is achievable in the stage- scanning embodiment, discussed below.
[0127] The properties required of the detection device can be further clarified by considering the following preferred embodiment. The resolution limit of the objective lens is <1 μm, typically ˜0.5 μm, and the detector comprises an array of ˜1000 independent elements. Resolution, field-of-view (FOV) and image acquisition-rate are not independent variables, necessitating compromise among these performance parameters. In general, the magnification of the optical system is set so as to image as large a FOV as possible without sacrificing resolution. For example, a ˜1 mm field-of-view could be imaged onto a 1000-element array at 1 μm pixelation. If the detection elements are 20 μm square, then the system magnification would be set to 20×. Note that this will not result in 1 μm resolution.
[0128] Pixelation is not equivalent to resolution. If, for example, the inherent resolution limit of the objective lens is 0.5 μm and each 0.5 μm×0.5 μm region in the object plane is mapped onto a pixel, the true resolution of the resulting digital image is not 0.5 μm. To achieve true 0.5 μm resolution, the pixelation would need to correspond to a region ˜0.2 μm×0.2 in the object plane. In one preferred embodiment, the magnification of the imaging system is set to achieve the true resolution of the optics.
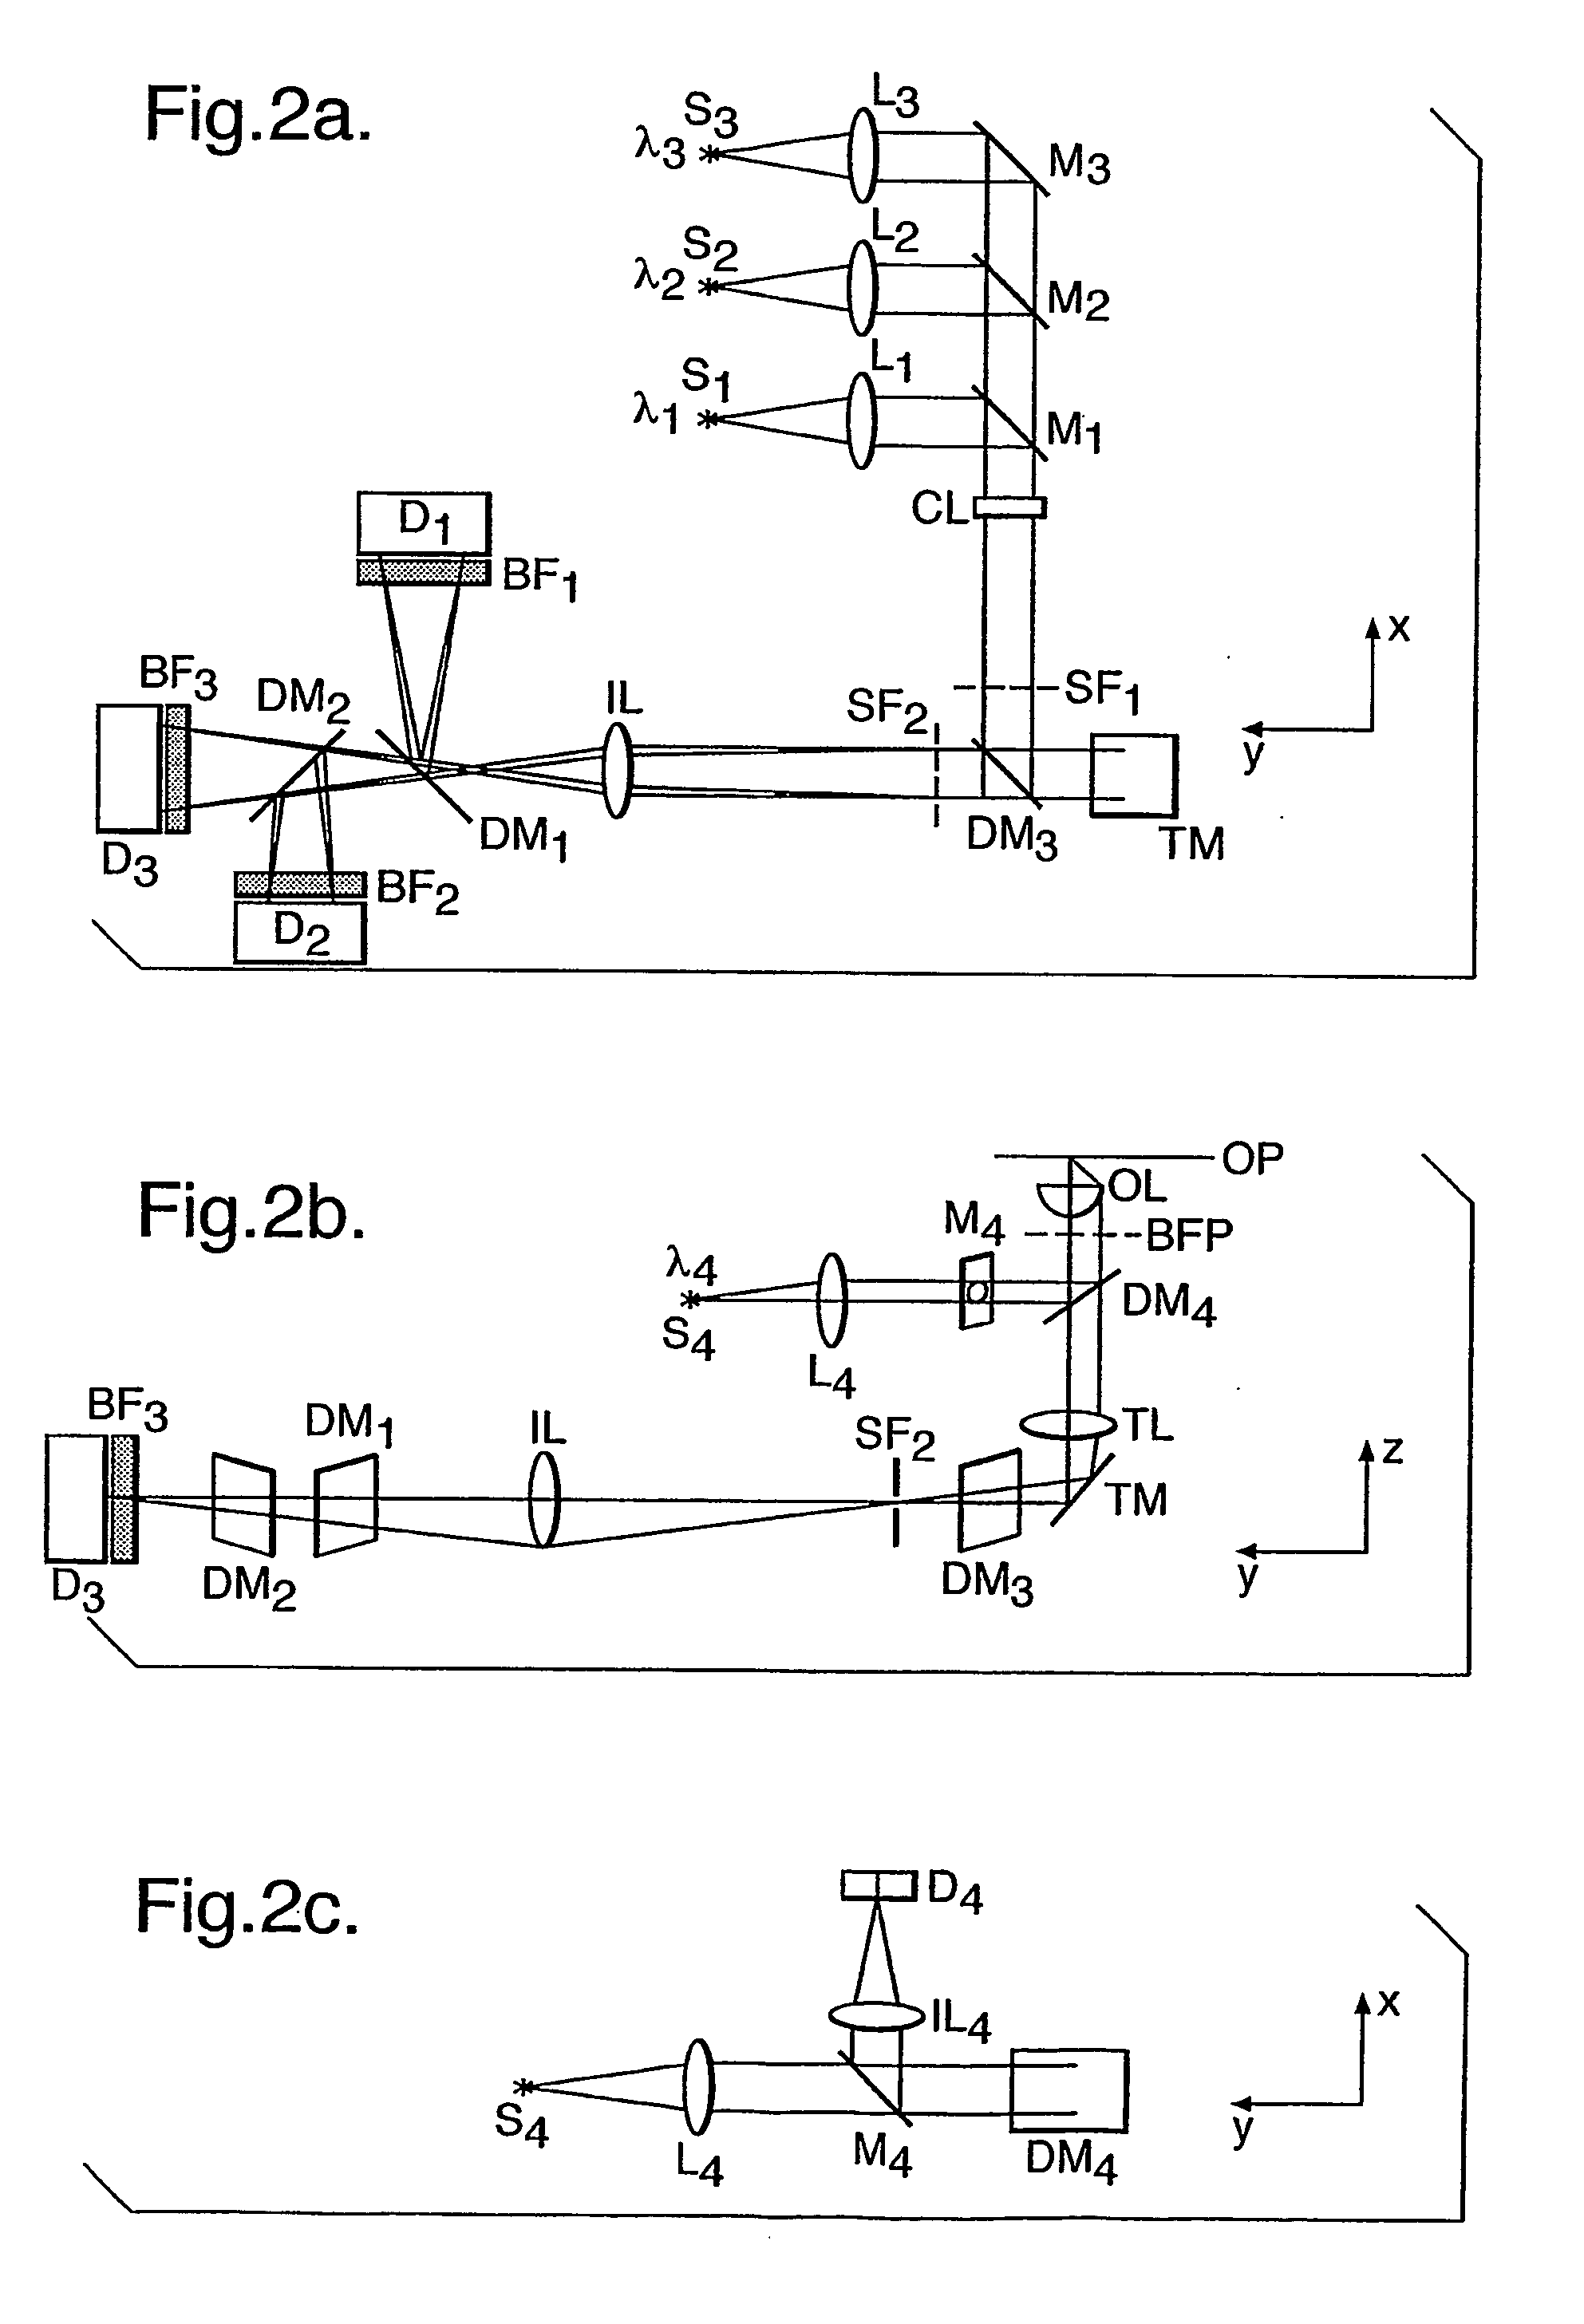
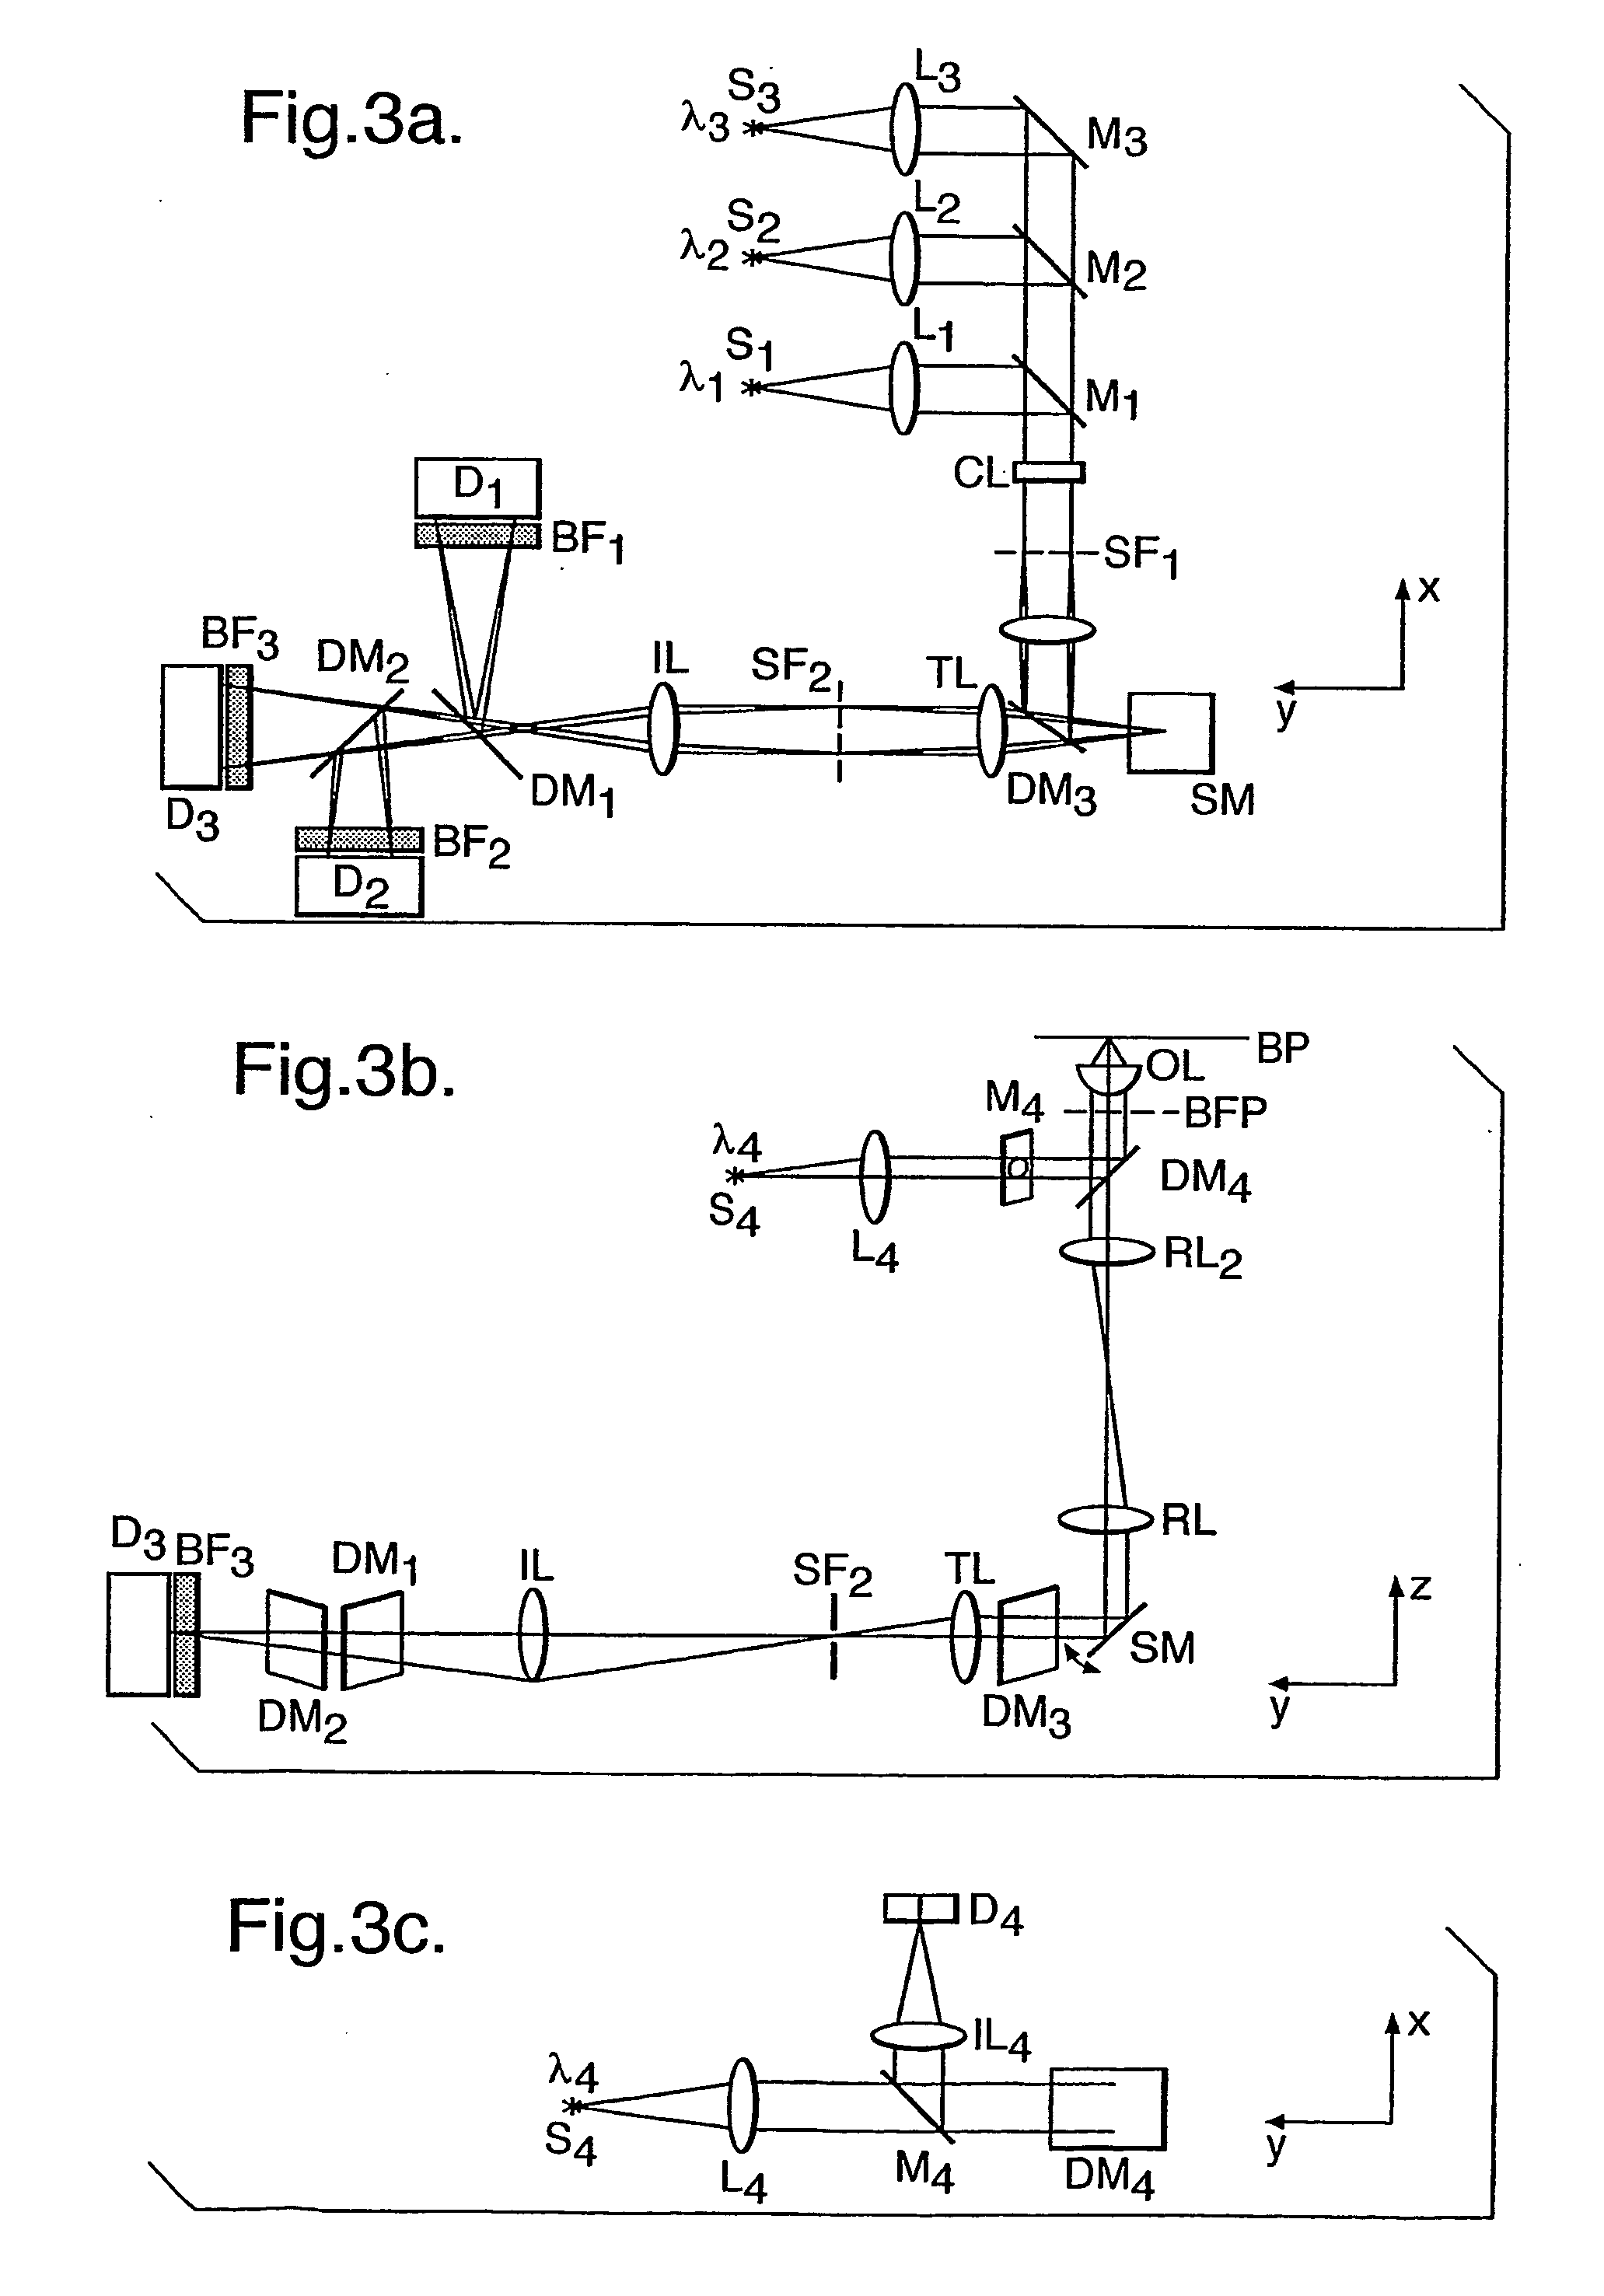
[0129] Preferably, for high detection efficiency, low noise and sufficient read-out speed, the detectors used are CCD cameras. In FIG. 5, a rectangular CCD camera is depicted having an m×n array of detector elements where m is substantially less than n. The image of the fluorescence emission covers one row that is preferably proximate to the read register. This miniinses transfer time and avoids accumulating spurious counts into the signal from the rows between the illuminated row and the read-register.
[0130] In principle, one could set the magnification of the optical system so that the height of the image of the slit SF2 on the CCD camera is one pixel, as depicted in FIG. 5.
[0131] In practice, it is difficult to maintain perfect alignment between the illumination line and the camera row-axis, and even more difficult to maintain alignment among three cameras and the illumination in the multi-wavelength embodiment as exemplified in FIGS. 2 and 3. By binning together a few of the detector elements, exemplarily two to five, in each column of the camera the alignment condition can be relaxed while suffering a minimal penalty in read-noise or read-time.

Problems solved by technology

Microbial biofilms cause widespread problems in industry, fouling machinery, clogging piping and adhering to the hulls of marine equipment and shipping.
Biofilms are also a significant problem in medicine, being implicated in a large number of human infections such as dental caries, periodontitis and cystic fibrosis pneumonia (Costerton et al., 1999, Science, 284, 1318-1322).
Bacteria in biofilms often display markedly different phenotypes compared to their free-swimming planktonic counterparts which can give rise to serious problems in industry and medicine.
The control of microbial biofilms thus poses significant challenges for many industries, including the food, health, consumer products, engineering and pharmaceutical industries.
In the last decade considerable efforts have been marshalled to address this issue but attempts to discover and develop novel antimicrobial agents effective against biofilms have been hampered by a lack of a suitable screening assay.
While planktonic microbes are readily amenable to high throughput screening technologies, the growth and assessment of biofilm sensitivity to inhibitors, quorum-sensing signal mimics or agonists is laborious, time consuming and beset with technical difficulties.
However, this technique is time consuming, can cause structural distortions through the preparation process and is not amenable to high throughput screening.
However, such studies are time consuming and have been highly specific in nature, concentrating on only one or two specialised biofilm structures.
While LSCM provides an excellent tool for investigating biofilm morphology, structure and composition, it is not an obvious choice as a platform for high throughput screening because the imaging and data capture process is very slow.
These data capture and analytical methods, together with the use of ‘glass flow cells’ for biofilm growth, severely limit the applicability of this approach to automation and high throughput screening.
Of particular note, however, are the problems highlighted in automating any assay using confocal microscopy.
However, nowhere within this application is there any disclosure of the use of the system to characterise microbiological populations, to create 3D images thereof, or to analyse biofilm development.
Furthermore, the image analysis algorithms described in WO 99 / 47963 are only suitable for analysing data from a single plane and not a plurality of planes.

Method used


Image

  • Method for assessing biofilms
  • Method for assessing biofilms
  • Method for assessing biofilms

Examples


example 1

Visualisation of Bacterial Biofilm by Fluorescence Staining

[0171] A non-fluorescent strain of Escherichia coli (E. coli, JM109) was allowed to adhere to the wells of a Packard microtitre plate (cf Packard catalogue number 6005182) at 37° C. for 3 hours. Unattached bacteria were removed by washing and the attached cells allowed to grow overnight at 37° C. in standard Luria media (Amersham Biosciences). The bacteria were then visualised by the addition of the fluorescent DNA stain Hoechst 33342 (1 μM; Sigma). On visualisation in the imaging system, the bacteria showed a dense, but not uniform, pattern of staining indicative of growing in patches (see FIG. 15). A scan of the fluorescence intensity into the depth of the biofilm indicated that the film was several micrometers in depth.

example 2

3D Visualisation of Adhered Population of E. coli Constitutively Expressing GFP

[0172] A second experiment was conducted growing E. coli in a microtitre plate as in Example 1 above, except that the E. coli JM 109 constitutively expresses a GFP, having the GFP-F64L-S175G-E222G mutation. After removal of unattached cells by washing, the remaining cells were incubated for approximately 10 hours at 37° C. with no agitation. A well-developed biofilm, that was neither over-grown nor only one-cell thick, was scanned as it was considered representative of a typical sample. Scanning was conducted at 488 mn to visualise the GFP.

[0173] The images shown in FIGS. 16A-D cover an area of 0.75×0.75 mm. Depth information was obtained by moving the focal plane of the instrument into the biofilm in 1 μm steps. The three images shown in FIGS. 16A, 16C and 16D represent slices taken and the respective z-position within the biofilm. The image shown in FIG. 16B is a 3-D rendered image, combining 30 imag...

example 3

Differential 3D Analysis of Adhered E. coli Cultures

[0175]E. coli CL182 possesses a low copy number vector (pGEX-6P-1) that confers ampicillin resistance and expresses the GFP (F64L, S175G, E222G) from the IPTG responsive tac promoter. E. coli XL1-blue is a standard strain that possesses transposon 10, conferring tetracycline resistance. The strains were mixed and grown in the presence of selective antibiotics (tetracycline, ampicillin or chloramphenicol) and the effects were visualised using the IN Cell Analyzer.

[0176]E. coli cultures were grown in batch culture at 37° C. for 16 hours under selective pressure. Cells were pelleted by centrifugation, washed and resuspended in cold PBS. OD600 mn was normalised (to 1) for both cultures and solutions were diluted ten fold in cold PBS. Cells (100 μl) were allowed to settle and adhere to the surface of a Packard microtitre plate (Packard #6005182) at 4° C. for 1 hour. Adhered E. coli were washed twice with PBS (100 μl). Luria broth (10...


PUM

PropertyMeasurementUnit
wavelengthsaaaaaaaaaa
depthsaaaaaaaaaa
wavelengthaaaaaaaaaa

Abstract

An automated method for measuring the development of a biofilm, containing one or more fluorescent moieties, on a plurality of surfaces using a confocal imaging system including: a) a radiation source system for forming a beam of electromagnetic radiation including one or more wavelengths; b) an optical system for directing and focusing said beam onto one or more planes of the object; c) a detection system for detecting electromagnetic radiation emitted from the object and producing image data; and d) a scanning system for scanning the object in a plurality of planes with the electromagnetic radiation, the method comprising the steps of: i) growing said biofilm on said plurality of surfaces; ii) detecting the presence of said one or more fluorescent moieties within the biofilm by scanning the biofilm with electromagnetic radiation in a plurality of planes and collecting fluorescent emissions to produce a plurality of images; and iii) analysing said images by means of a data processing system under the control of computer software to determine the structure of the biofilm.

Description

TECHNICAL FIELD [0001] The present invention relates to a method for automatically measuring the development of a microbial biofilm using a confocal imaging system and to methods for determining the effect of test chemicals on microbial gene expression and biofilm development. BACKGROUND TO INVENTION [0002] Microbial biofilms consist of homogeneous or heterogeneous microbial populations adhering to surfaces or interfaces, usually embedded in an extracellular matrix of polysaccharides (Costerton et al., 1995, Annual Review of Microbiology, 41, 435-464). These biofilms can form rapidly on almost any wet surface and represent the normal mode of colonisation of microbes in the environment (Wood et al., 2000, Journal of Dental Research, 79, 21-27). Although bacteria are frequently associated with biofilm development, many microbes including fungi and algae also form biofilms. [0003] Microbial biofilms cause widespread problems in industry, fouling machinery, clogging piping and adhering ...

Claims


Application Information

Patent Timeline
Patent Type & Authority Applications(United States)
IPC IPC(8): G01N33/554C12Q1/34C12Q1/42C12Q1/26C12Q1/04G01N21/64G02B21/00G02B21/24
CPCG01N21/6428G01N21/6452G01N21/6458G02B21/245G01N2021/6421G02B21/0076G02B21/008G01N2021/6419G01N21/64G02B21/00
Inventor GOODYER, IAN DAVIDLABARBE, RUDIRUEHLMANN, DIETRICHSTUBBS, SIMON
Owner GE HEALTHCARE LTD
Why Eureka
Try Eureka