

Pulsed cavitational ultrasound therapy
- Summary
- Abstract
- Description
- Claims
- Application Information
AI Technical Summary
Benefits of technology
Problems solved by technology
Method used
Image

Examples
example 2
Optical and Acoustic Feedback and Monitoring of Bubble Cloud Dynamics
[0176] Optical Detection: The optical attenuation method detects light absorption and scattering by the bubbles when a bubble cloud is created. A laser beam is projected through the ultrasound focus in front of the tissue and the light intensity is monitored continuously by a photodetector. Optical attenuation detection is capable of monitoring real-time bubble cloud dynamics without interference from the tissue or disturbing the ultrasound field, yet simple and of low cost. The temporal resolution of the optical attenuation method depends on the response time of the photo-detector. It can easily reach nanoseconds or better with very reasonable cost equipment. This enables almost continuous monitoring of the bubble cloud compared to the time scale of acoustic therapy pulse (on the order of μs and above). Using this detection scheme, we expect to gain much fundamental knowledge of the temporal dynamics of the bubbl...
example 3
Selection of Parameters to Detect Initiation of Variable Acoustic Backscatter
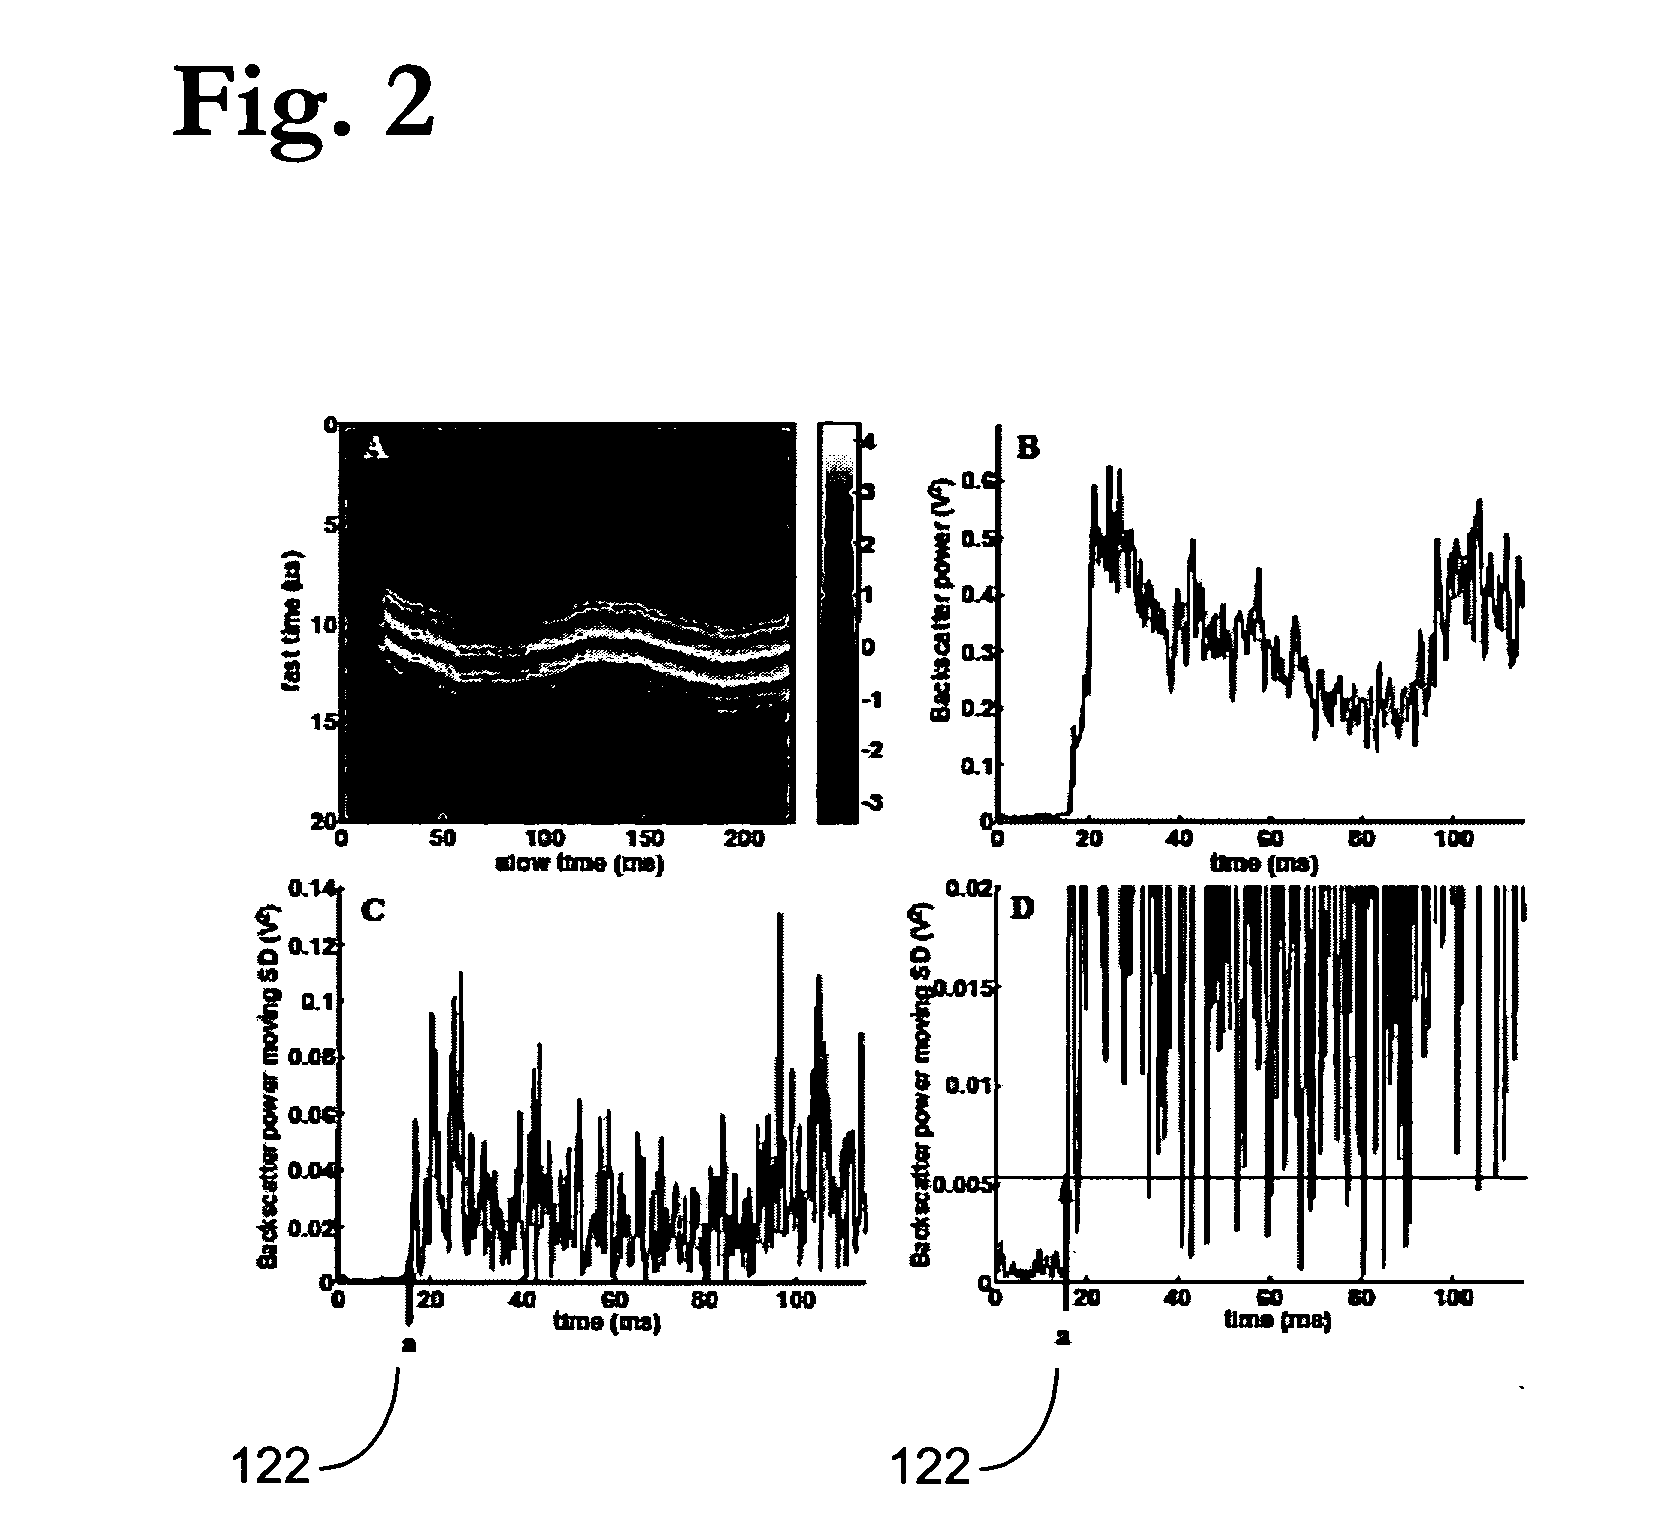
[0201] To identify points of initiation and extinction based on variability in the backscatter signal, we applied a common technique from the area of statistical quality control of industrial processes, the Shewhart chart [G. B. Wetherill and D. W. Brown, Statistical Process Control Theory and practice: Chapman and Hall, 1991]. Depending on the data, different Shewhart charts are used to identify changes in a time series process. For our particular situation, we used the s-chart, where the sample standard deviations (SD) of the backscatter power at point i in the time series is used as the measure of variability. Because only a single measurement of the backscatter power was made at each time point in a given experiment, the SD at a single point can not be directly estimated. For such “one-at-a-time” data, a moving SD approach is employed to estimate the acoustic backscatter variability at certain time poi...
example 4
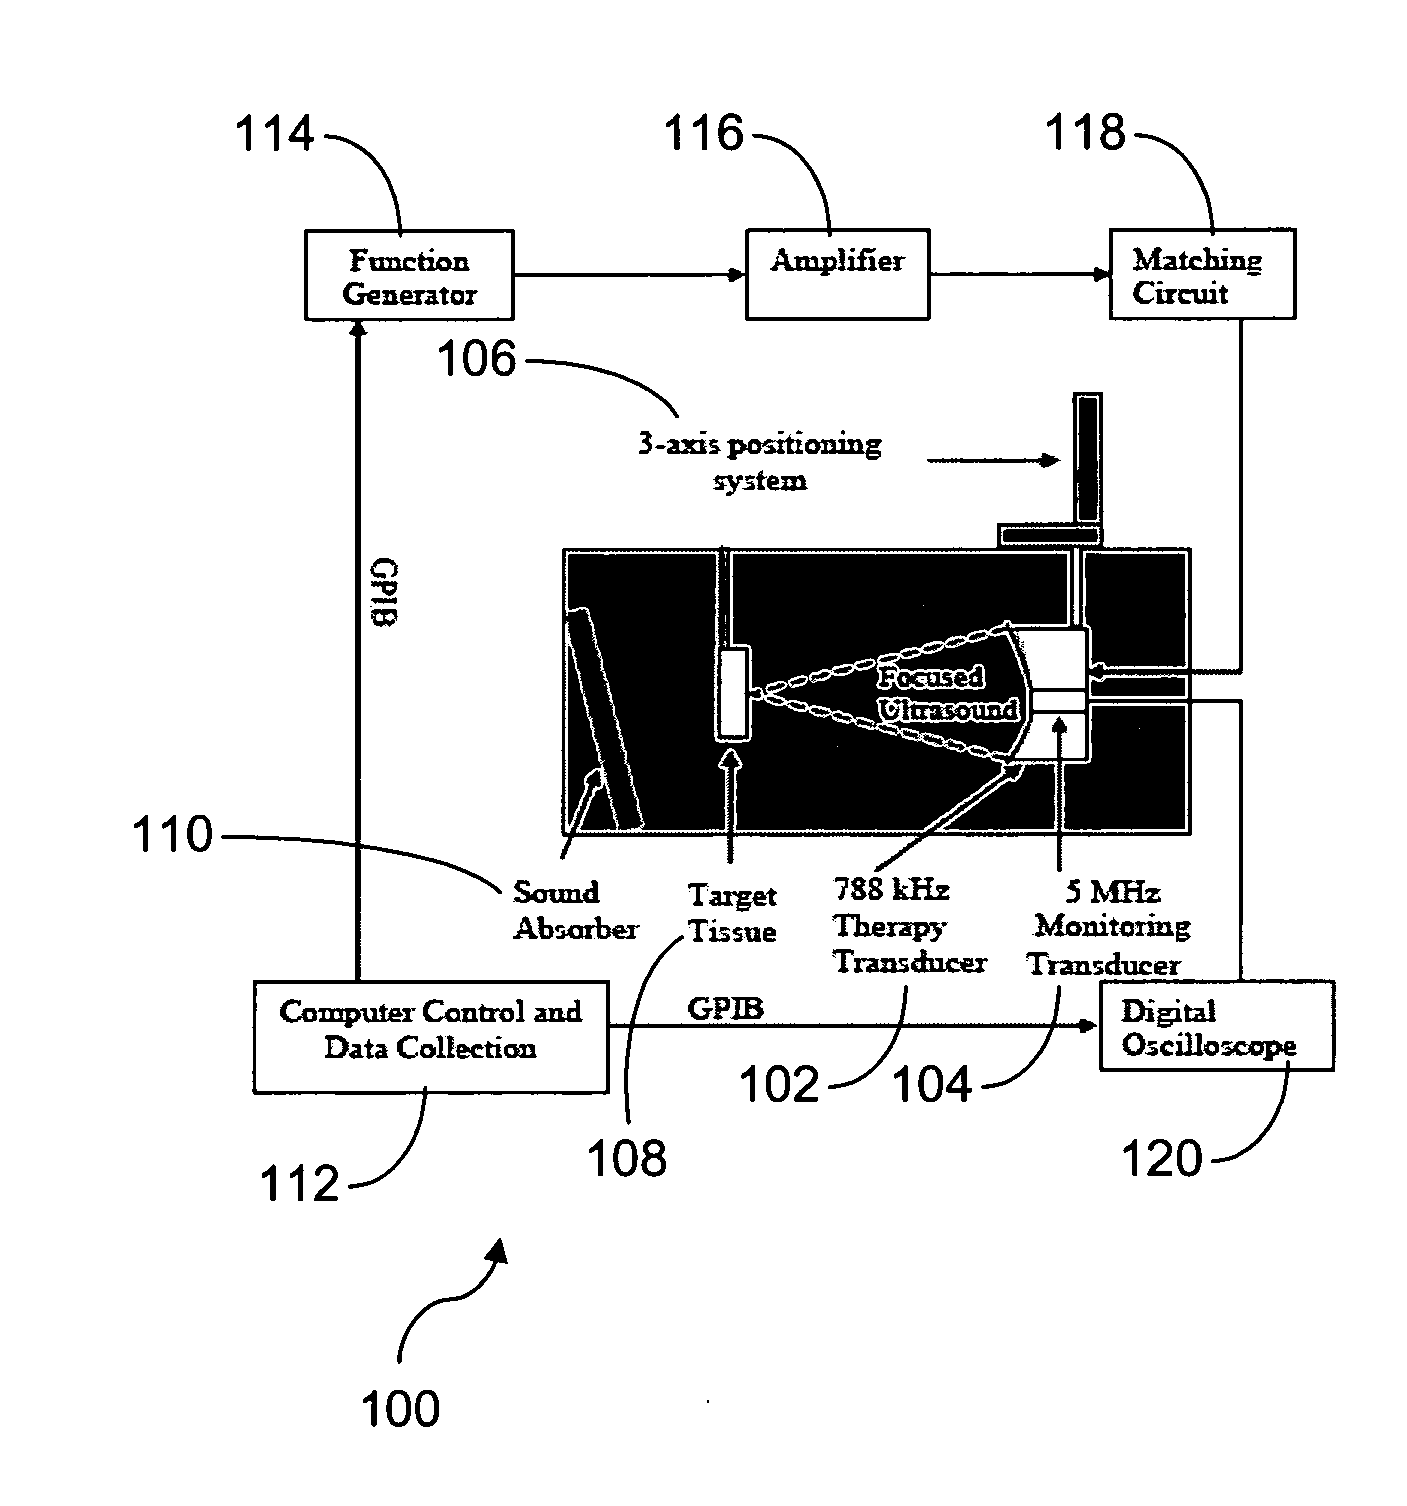
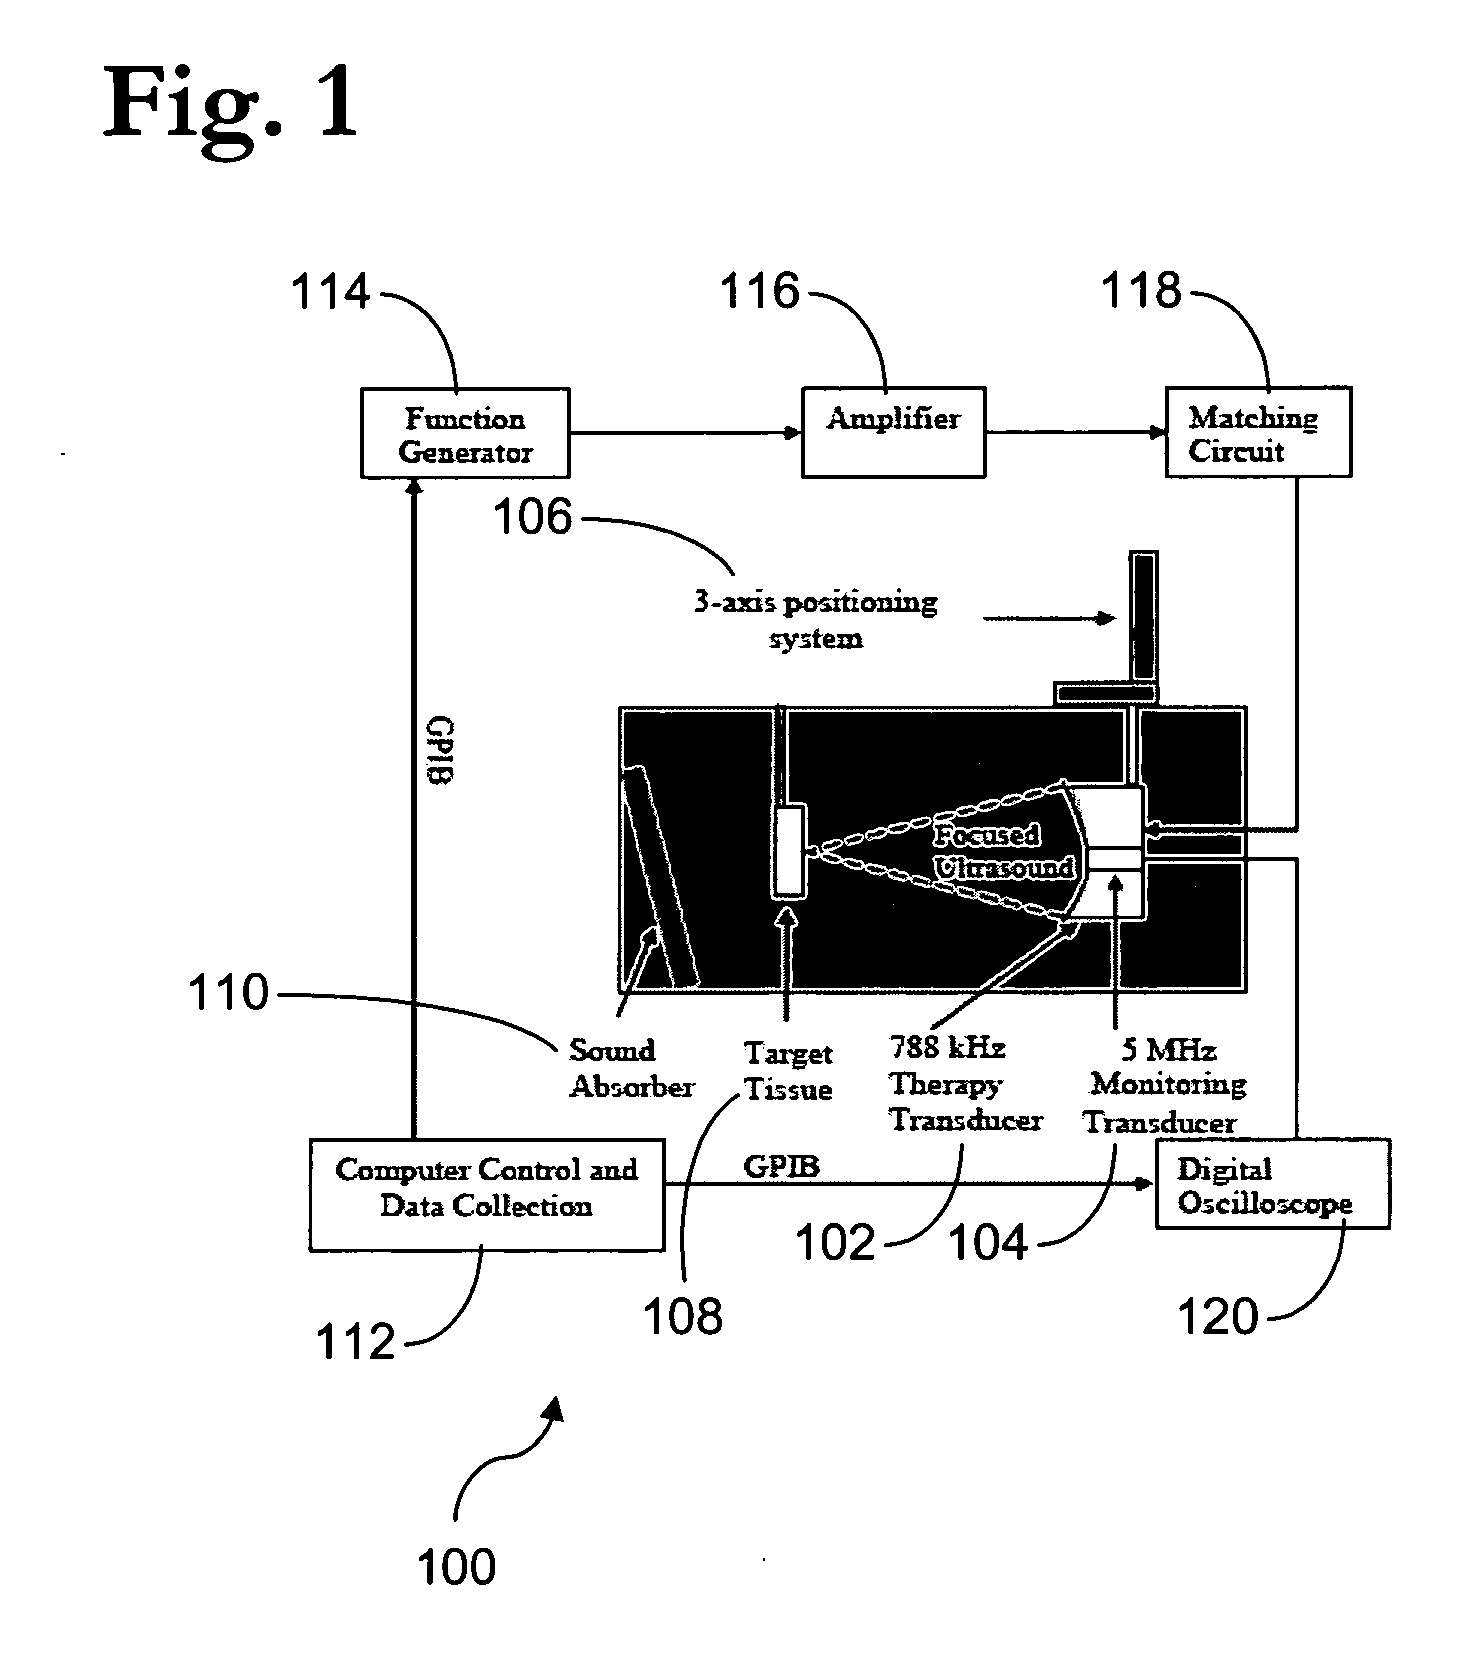
[0226] Ultrasound Apparatus: The therapeutic ultrasound unit, shown in FIG. 16, consisted of a large, high power annular 18 element piezo-composite phased transducer array (750 kHz, 145 mm diameter, 100 mm focal length) [Imasonic, Besançon, FR]. A commercial diagnostic 2.5 MHz imaging probe (General Electric Medical Systems, Milwaukee, Wis.) was coaxially aligned through the central hole of the phased-array and operated in a 1.8 MHz octave mode (harmonic imaging) with a nominally 30 Hz frame rate. The imaging probe was offset from the back of the therapeutic transducer by 40 mm resulting in an imaging distance of 60 mm. This provided sufficient image quality without substantially blocking the path of the therapeutic transducer. The transducer system was mounted on a brass frame tilted 20 degrees from vertical (to reduce reverberations from the animal skin surface) and placed at the bottom of a tank filled with degassed water. The focal pressure field could ...
PUM
 Abstract
Description
Claims
Application Information