System and method for selecting a multiparameter reagent combination and for automated fluorescence compensation

a multi-parameter reagent and automatic technology, applied in the field of flow cytometry, can solve the problems of less efficient excitation at wavelengths, reduced intensity of emitted fluorescence, and inhomogeneous wavelengths, and achieve the effect of rapid design or modification

Active Publication Date: 2011-11-17
THE BOARD OF TRUSTEES OF THE LELAND STANFORD JUNIOR UNIV
View PDF0 Cites 28 Cited by
  • Summary
  • Abstract
  • Description
  • Claims
  • Application Information

AI Technical Summary

Benefits of technology

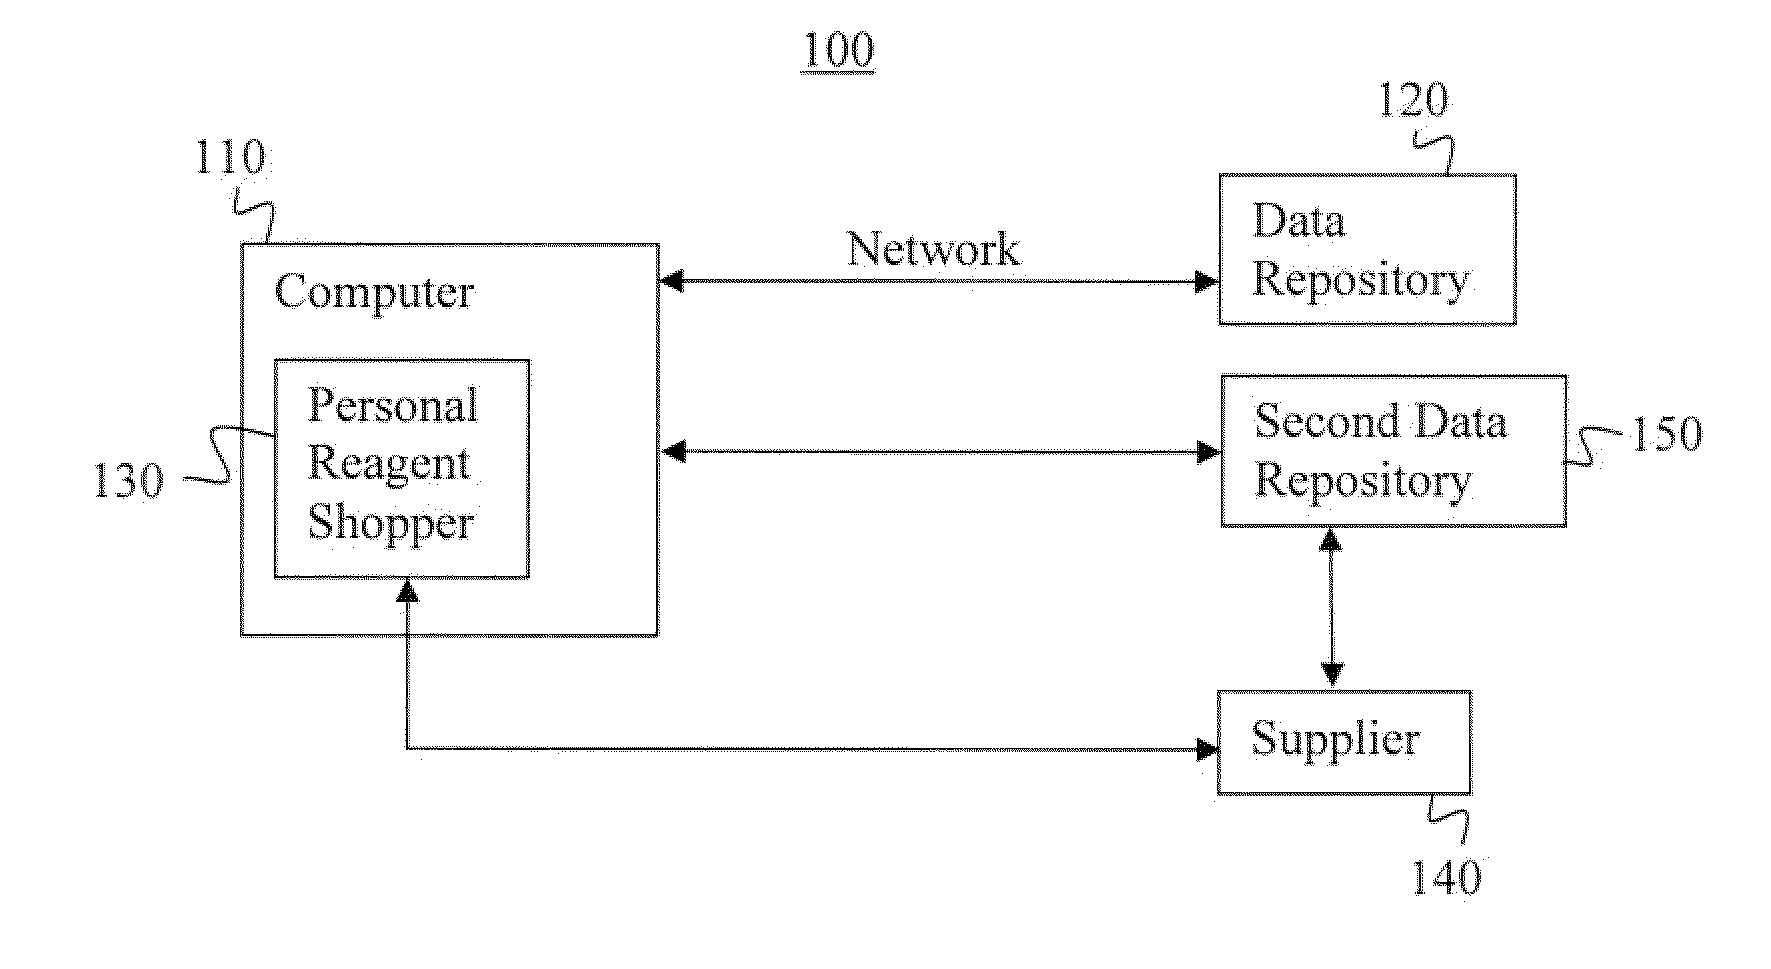
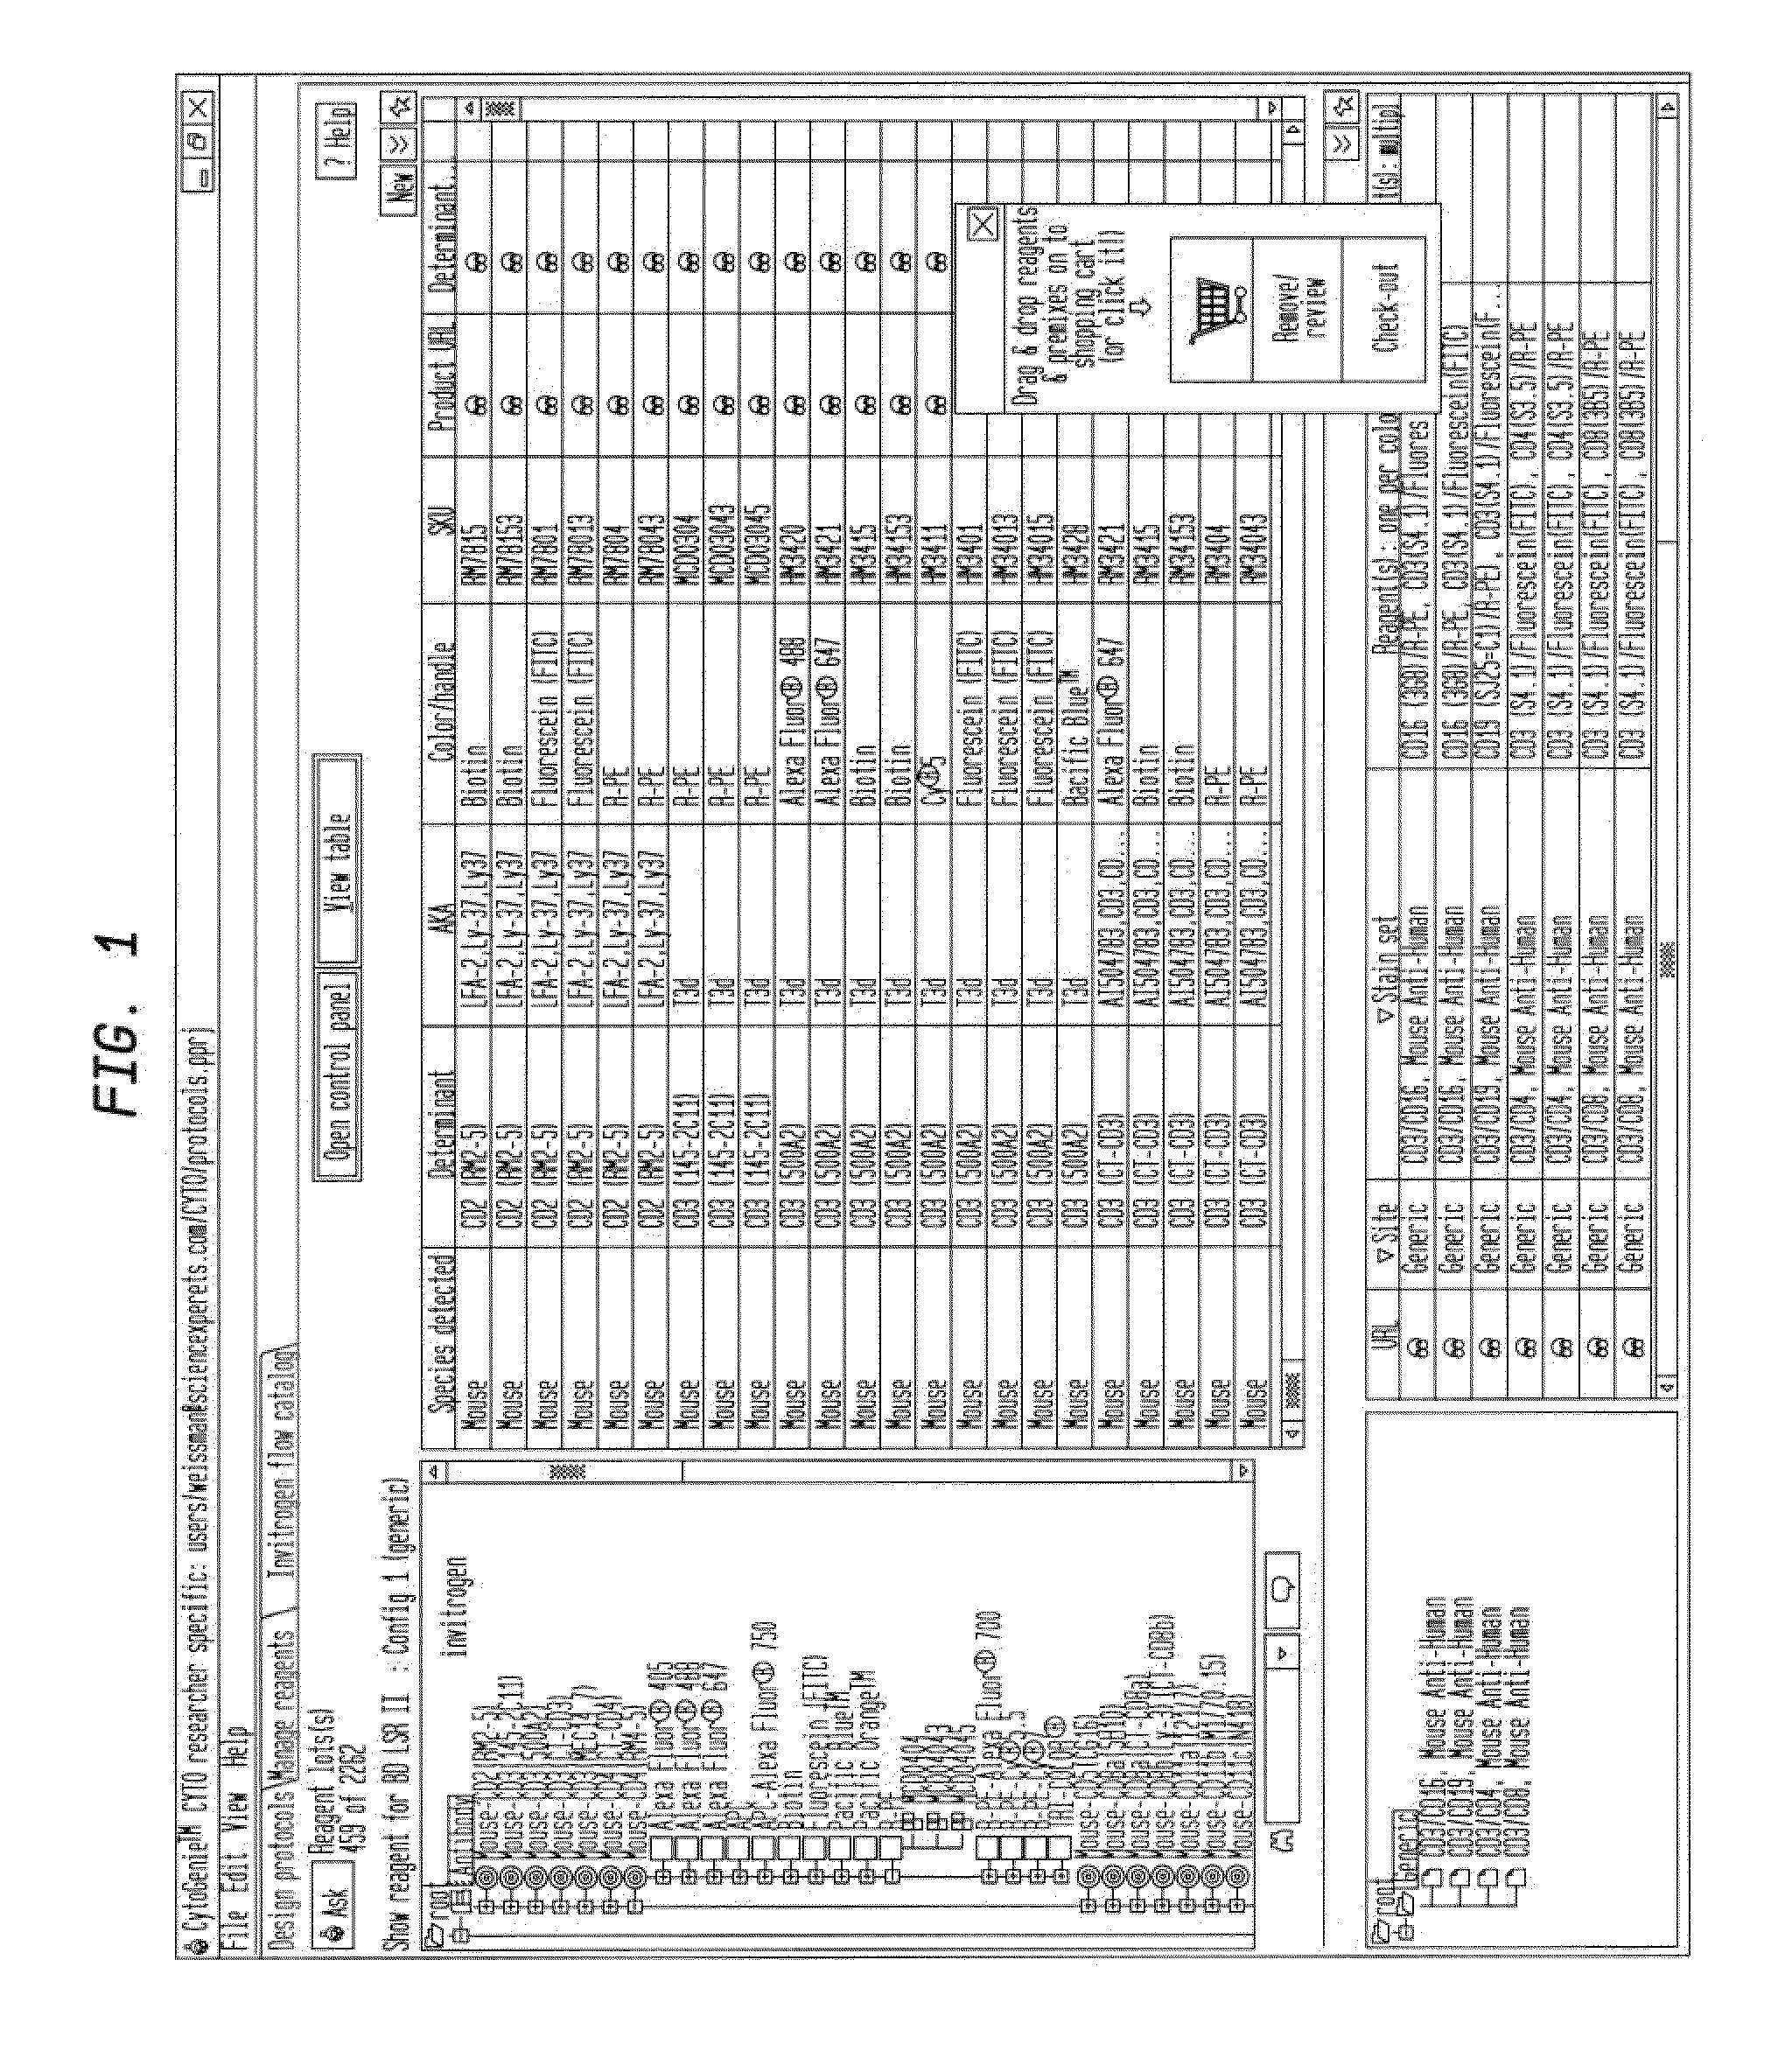
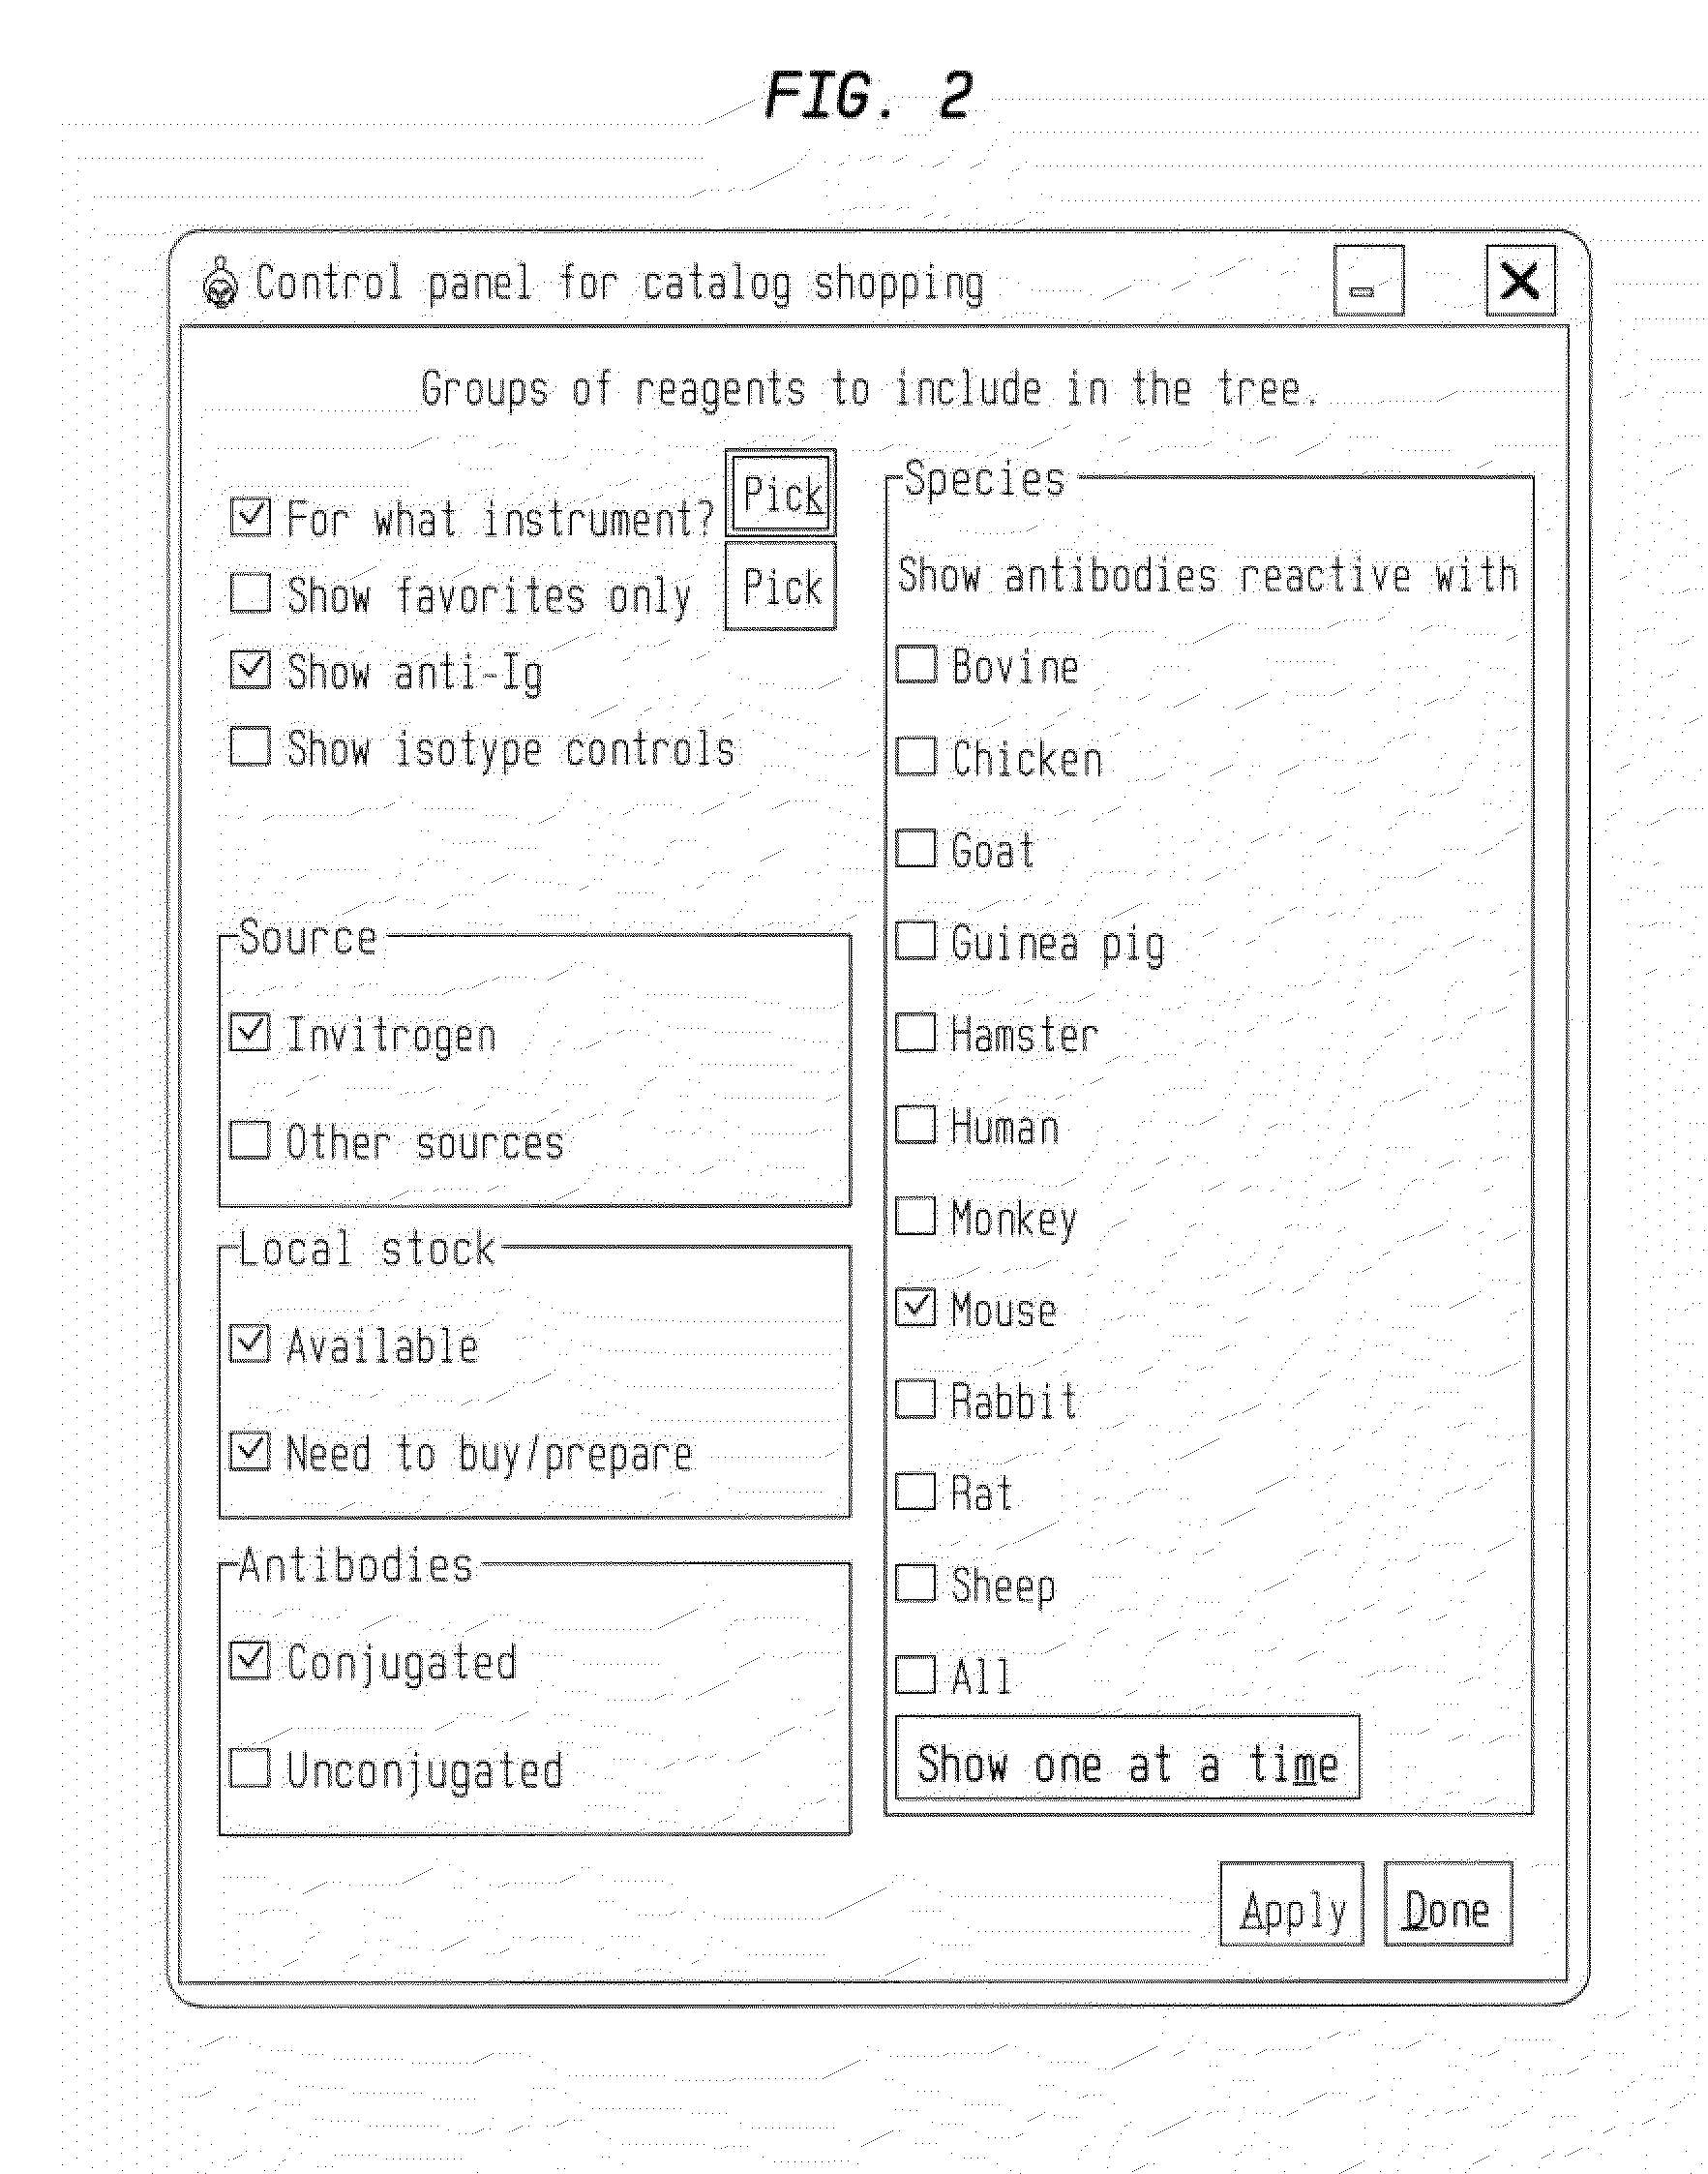
[0068]According to one embodiment of the method, at least one of steps (a), (b), and (c) is performed using a computer. According to another embodiment, at least one of steps (a), (b), and (c) is performed automatically. According to another embodiment, step (a) further comprises the steps: (i) specifying a plurality of reagents that can detect or participate in the detection of one or more of the plurality of markers; (ii) specifying at least one fluorescent dye or other instrument-measurable atom or molecule associated with each reagent; (iii) specifying plurality of measurement instruments and the properties or measurement capabilities of each measurement instrument. According to another embodiment, at least one of steps (i), (ii) and (iii) is performed by a computer. According to another embodiment, step (c) further comprises the step of selecting an optimal reagent combination. According to another embodiment, at least one user-defined or system-defined criterion is at least one of spectral interactions, detectors on an instrument, illumination sources on an instrument, amount of reagent on-hand, known reactivities of reagents in each reagent combination; known cross-reactivities of reagents in each reagent combination, properties of each reagent in each reagent combination, available analysis capabilities, and species of an instrument. According to another embodiment, the method further comprises generating an annotated experiment plan based on at least one type of cell and the optimal reagent combination, the method comprising at least one of steps by using the computer for text entry, (i) pointing-and-clicking or dragging-and-dropping subjects, samples, and keywords for the experiment; (ii) generating a ready-to-use pipetting plan based on the subjects, samples, and keywords; and (iii) printing the ready-to-use pipetting plan. According to another embodiment, at least one of steps (i), (ii) and (iii) are performed by a computer. According to another embodiment, the generated experiment plan of step (i) is transferred to an instrument where the experiment plan is displayed via software on the instrument, and wherein the generated experiment data and the generated experiment plan are automatically linked and / or stored in the same directory. According to another embodiment, the generated experiment plan is transferable to a DiVa data collection software on the instrument; According to another embodiment, the DiVa software displays sample names, keywords, reagent labels, and at least one fluorescent dye while the experiment data is being generated; wherein the DiVa software labels the generated experiment data; and wherein the generated experiment data is stored in data files. According to another embodiment, the data files are automatically transferable to a well-managed online archive; wherein the archive automatically catalogs the data files; and wherein the archive includes a server computer to allow a user to access the data files via a computer network. According to another embodiment, the method further comprises step: (i) generating analysis results based on the generated experiment data and the generated experiment plan, wherein the analysis results are stored in the same directory as the generated experiment data and the generated experiment plan. According to another embodiment, the method comprises steps: (i) generating at least one hyperlink to the data files on the archive to access the data files via a computer network; and (ii) storing at least one hyperlink on the computer, wherein at least one hyperlink is automatically linked to the generated experiment data and the generated experiment plan, and wherein at least one hyperlink is stored in the same directory as the analysis results. According to another embodiment, step (i) further comprises steps: (a) determining a dilution of the reagent combination; (b) calculating a volume of the reagent combination; (c) calculating a volume of a sample population of cells; and (d) determining a quantity of at least one fluorescent dye for use in creating a multimarker Hi-D stain set for flow cytometry or fluorescence microscopy. According to another embodiment, at least one of steps (i), (ii), and (iii) is performed by a computer. According to another embodiment, the computer allows a user to rapidly design or modify the multimarker experiment data. According to another embodiment, the multimarker experiment data includes a multimarker stain set that combines twelve or more reagents. According to another embodiment, ranking step (c) identifies at least one type of cell or to segregate at least one type of cell from the population of cells. According to another embodiment, ranking step (c) is performed manually according to user generated preferences. According to another embodiment, ranking step (c) is performed automatically according to a predetermined efficacy with regard to at least one type of cell. According to another embodiment, the method further comprises steps: (i) using a personal reagent shopper to search a data repository via a computer network to determine whether at least one ingredient for at least one of the reagent combinations are available from at least one supplier; and (ii) ordering a quantity of at least one ingredient from at least one supplier. According to another embodiment, a user can search the plurality of reagent combinations to find a particular reagent combination. According to another embodiment, step (c) the best dye combination provides for a minimal an amount of correction needed due to overlap of fluorescent dyes.

Problems solved by technology

Less efficient excitation can occur at wavelengths near the excitation maximum; however, the intensity of the emitted fluorescence is reduced.
Although the fluorophore molecules all emit the same intensity of light, the wavelengths, and therefore the colors of the emitted light, are not homogeneous.
However, the range of wavelengths emitted from each LED is still relatively broad and also may require the use of a filter to narrow the bandwidth.
Stray light arising from sources other than the emitting fluorophores (for example, from the excitation source) interferes with the detection of the fluorescence emission.
The term “FACS” is not a generic term for flow cytometry, although many immunologists inappropriately use the term FACS for all types of sorting and non-sorting applications.
This spectral overlap may compromise data and analysis.
Background fluorescence, which may originate from endogenous sample constituents (autofluorescence) or from unbound or nonspecifically bound reagents, may compromise fluorescence detection severely.
Although narrowing the fluorescence detection bandwidth increases the resolution of E1 and E2, it also compromises the overall fluorescence intensity detected.
Unfortunately, it is not simple to find single dyes with the requisite combination of a large extinction coefficient for absorption (meaning a parameter defining how strongly a substance absorbs light at a given wavelength, expressed per mass unit or per molar concentration) and a large Stokes shift (meaning the difference (in wavelength or frequency units) between positions of the band maxima of the absorption and emission spectra of the same electronic transition, see infra).
However, simply increasing the probe concentration can be counterproductive and often produces marked changes in the probe's chemical and optical characteristics.
Additionally, the increased labeling of proteins or membranes ultimately leads to precipitation of the protein or gross changes in membrane permeability.
This becomes more problematic upon inclusion of two or more interacting parameters; the presence of multiple fluorescent signals must be accommodated within any fluorescence detection system for accurate quantification and analysis.
It generally is believed that this was not a result of inadequacies in optical filters, but a fundamental limitation in the chemical physics of the dyes leading to emission of some light over a range of wavelengths broader than the peak emission zone.
However, if compensation settings were incorrect during the run, they could not be revised.
Computed compensation starting with uncompensated measurements could be carried out after the fact and, if necessary, revised, but its use on cytometers themselves initially was limited by the available computing power.
Correct compensation for more than two colors almost never can be achieved using the standard interface of adjusting compensation coefficients (rather than spillover coefficients), because of the interdependence of these values.
Studies have reported that even properly compensated data may appear to be undercompensated.
It generally is believed that it is not possible to properly set compensation by visual methods (i.e., relying on dot plots or histograms); nor is it possible to accurately analyze data using quadrant gates or control samples based on isotype controls in all channels.
Importantly, this holds true irrespective of the use of newer digital electronics that obviate the use of log amplifiers (a significant source of measurement error).
A fundamental measurement error that never can be overcome is one arising from counting statistics.
These measurement errors contribute to the spread in compensated parameters.
Thus, this visualization artifact cannot be corrected by overcompensating the data, because compensation is a linear process.
It generally is believed that no electronics can overcome the fundamental counting error inherent in measuring signal levels.
This nonlinear error contribution in the data always will be present and lead to the spread of compensated data.
However, the spreading of compensated data may continue to impact significantly the analysis and interpretation of data.
For example, where this error is present, the use of linear “quadrant gates”, or any gate based on a completely unstained sample, would lead to erroneous results, since at higher intensities, the autofluorescence distribution will spread up into the “positive” gate.
There are several problems with existing methodology for estimating fluorescence compensation.
Additionally, existing methods of estimating coefficients rely on subjective human evaluation for validation of the quality of the resulting measurements, and fail to provide errors of estimates for the coefficients.
However, they have yet to achieve their full potential, largely because the complex knowledge and functions skills needed to perform the assays effectively restricts their current use to large medical centers and research institutions and deters development of new assays that could provide even greater benefit.

Method used


Image

  • System and method for selecting a multiparameter reagent combination and for automated fluorescence compensation
  • System and method for selecting a multiparameter reagent combination and for automated fluorescence compensation
  • System and method for selecting a multiparameter reagent combination and for automated fluorescence compensation

Examples


example 1

Estimation of Fluorescence Compensation

[0341]For an initial fitting of the model to compensation control data, outliers were removed and a linear least squares criterion was applied to select the best fit spectral overlap value for each secondary measurement relative to each primary dye signal. The outliers removed were those with offscale measurements in any fluorescence channel, and events with fluorescence less than two standard deviations above the mean of unstained cells.

[0342]Table 1 shows that for a four-color set of compensation controls, the conventional hand gating for the compensation analysis in FlowJo and the model fitting method of the invention provided similar spectral overlap matrices, especially when considering that the least squares evaluation used in the fitting is likely to be affected by small numbers of events that are well outside the main population.

TABLE 1FlowJo Hand GatingModel FittingFL-A (100%)11.7%2.32%0.30% (100%)11.8%2.33%0.27%PE-A2.27% (100%)22.8%2....

example 2

Evaluating Photoelectron Scaling Using Single Stain Samples

[0347]The variation of data values around the fit line for a particular control sample viewed in the primary dye measurement dimension versus a spectral overlap dimension (see FIG. 8, left panels) derives from the Poisson distributed values in each data dimension based on the signal levels of the data events and the photoelectron scaling in each dimension. The effective variation in the secondary dimension is a composite of the Poisson scale effects in both measurement dimensions, and the details depend on the distribution of data events along the primary axis. Except in the case of measurements on particles with very uniform dye content, the separate photoelectron scales for the two measurement dimensions cannot be estimated separately using data from a single sample. However, in cases where two dyes have substantial spectral overlap each way (as illustrated in FIG. 8), an estimate of both photoelectron scales can be derive...

example 3

Reference Methods for Photoelectron Estimation

[0352]In typical flow cytometry, the accuracy of each fluorescence measurement fundamentally is limited by the uncertainty due to the finite number of photoelectrons generated at the PMT cathode. If a repeated measurement on highly uniform cells or particles resulted in a mean of N photoelectrons, it would be expected that the actual measurements follow a Poisson distribution for mean N in which the standard deviation equals the square root of N. In its simplest form, uniform light pulses with a suitable pulse shape, usually produced with a light-emitting diode (LED), are presented to a cytometer's fluorescence detectors, and the distribution of measured signals is analyzed. The coefficient-of-variation (CV) equal to (standard deviation) / (mean) often is used to characterize such distributions, and the photoelectron estimate is just 1 / CV2. Thus, a distribution with a mean signal of 1000 units and a standard deviation of 100 units would ha...


PUM


Abstract

The invention provides a system and method for selecting an optimal multimarker reagent combination for the identification and/or quantification of molecules in or on cells with or without reference to fluorescence or other properties of at least one fluorescent dye or other instrument-measurable atom or molecule associated directly or indirectly with the reagent combination. The method includes specifying, using a computer, a plurality of markers to be detected by a plurality of reagents, generating, using a computer, a plurality of reagent combinations comprising the plurality of reagents to detect the plurality of markers, wherein the reagent combinations are ranked according to at least one user-defined or system-defined criterion, and selecting the optimal reagent combination or providing a rank-ordered list of combinations.

Description

CROSS-REFERENCE TO RELATED APPLICATIONS[0001]This application claims the benefit of priority of U.S. Provisional Application No. 61 / 333,381, filed May 11, 2010, and U.S. Provisional Application No. 61 / 466,836, filed Mar. 23, 2011, each of which is a continuation-in-part of U.S. application Ser. No. 12 / 467,662, filed May 18, 2009, which claims priority to U.S. Provisional Patent Application Ser. No. 61 / 053,974, filed May 16, 2008. Each of these applications is incorporated by reference herein in its entirety.FIELD OF THE INVENTION[0002]The invention relates generally to flow cytometry; automated fluorescence compensation, and reagent optimization.BACKGROUND OF THE INVENTION[0003]Flow cytometry relies on the measurement of signals from a combination of fluorescent molecules, or fluorescence-labeled reagents, to indicate the presence or amount of a single species of target molecule in a sample preparation. The fluorescence spectra of these fluorescent molecules or reagents frequently o...

Claims


Application Information

Patent Timeline
Patent Type & Authority Applications(United States)
IPC IPC(8): G06F17/30G06F15/00
CPCG01N15/1429G01N2015/149
Inventor HERZENBERG, LEONORE A.PARKS, DAVID RHODESMEEHAN, STEPHENMOORE, WAYNE A.
Owner THE BOARD OF TRUSTEES OF THE LELAND STANFORD JUNIOR UNIV
Why Eureka
Try Eureka