Method of validating a cleaning process

a cleaning process and validation method technology, applied in the field of spectroscopic evaluation of a substance or product on a surface, can solve problems such as manufacturing downtime, equipment cannot be used, drawbacks and challenges

Active Publication Date: 2013-09-05
JONES IAN
View PDF4 Cites 9 Cited by
  • Summary
  • Abstract
  • Description
  • Claims
  • Application Information

AI Technical Summary

Benefits of technology

[0101]This is primarily because the sample can remain stationary and the field of view would be comparable with that currently used during conventional swabbing techniques (circa 25 cm2).
[0102]This method is of particular interest within the pharmaceutical industry for sample an...

Problems solved by technology

Significant manufacturing downtime may result, as the manual swabbing procedure and subsequent analytical activity testing may take up to three days to generate approved results, and the equipment cannot be used until approved results are available.
As a result, there are several drawbacks and challenges associated with such a cleaning validation process.
Manual swabbing introduces the risk of human error by way of incomplete or inaccurate sampling of the cleaned surface.
The time taken to generate approved results can also have a serious impact on cycle time for the pharmaceutical equipment.
There is also the regulatory burden on the user of conducting and maintaining cleaning validation activities on all product contact equipment on site.
The above outlined current approach to cleaning procedure development and validation is a time consuming and costly process that significantly inhibits clinical trial manufacture activities (because of once-off swabbing requirements following each mini-batch manufactured) and on-going commercial manufacturing activities (because of the burden associated with cleaning procedure validation).
Forsyth et al identified the following risks and limitations when using VRL'sThe potential that dirty equipment passes visual inspection and the subsequent manufactured formulation is adulterated.
It was acknowledged that the closer the VRL is to the ARL, the greater the risk becomes;To date, VRL determinations have been limited to stainless steel surfaces.
The consistency of VRL assessments from transparent equipment materials may be considerably more challenging;VRL approaches also have limitations with respect to assessing microbiological control;The subjectivity of observers and the variability of interpretation of ‘visually clean’ is also identi...

Method used


Image

  • Method of validating a cleaning process
  • Method of validating a cleaning process
  • Method of validating a cleaning process

Examples


example 1

[0125]The first experiment carried out was with a lactose sample in a water and alcohol dilution series, which was placed on 10 cm×10 cm perspex coupon.

Materials and Methods

Solution

[0126]0.1000 g of lactose was dissolved in 20 ml of water and mixed with 80 ml of ethanol.

Coupon Preparation

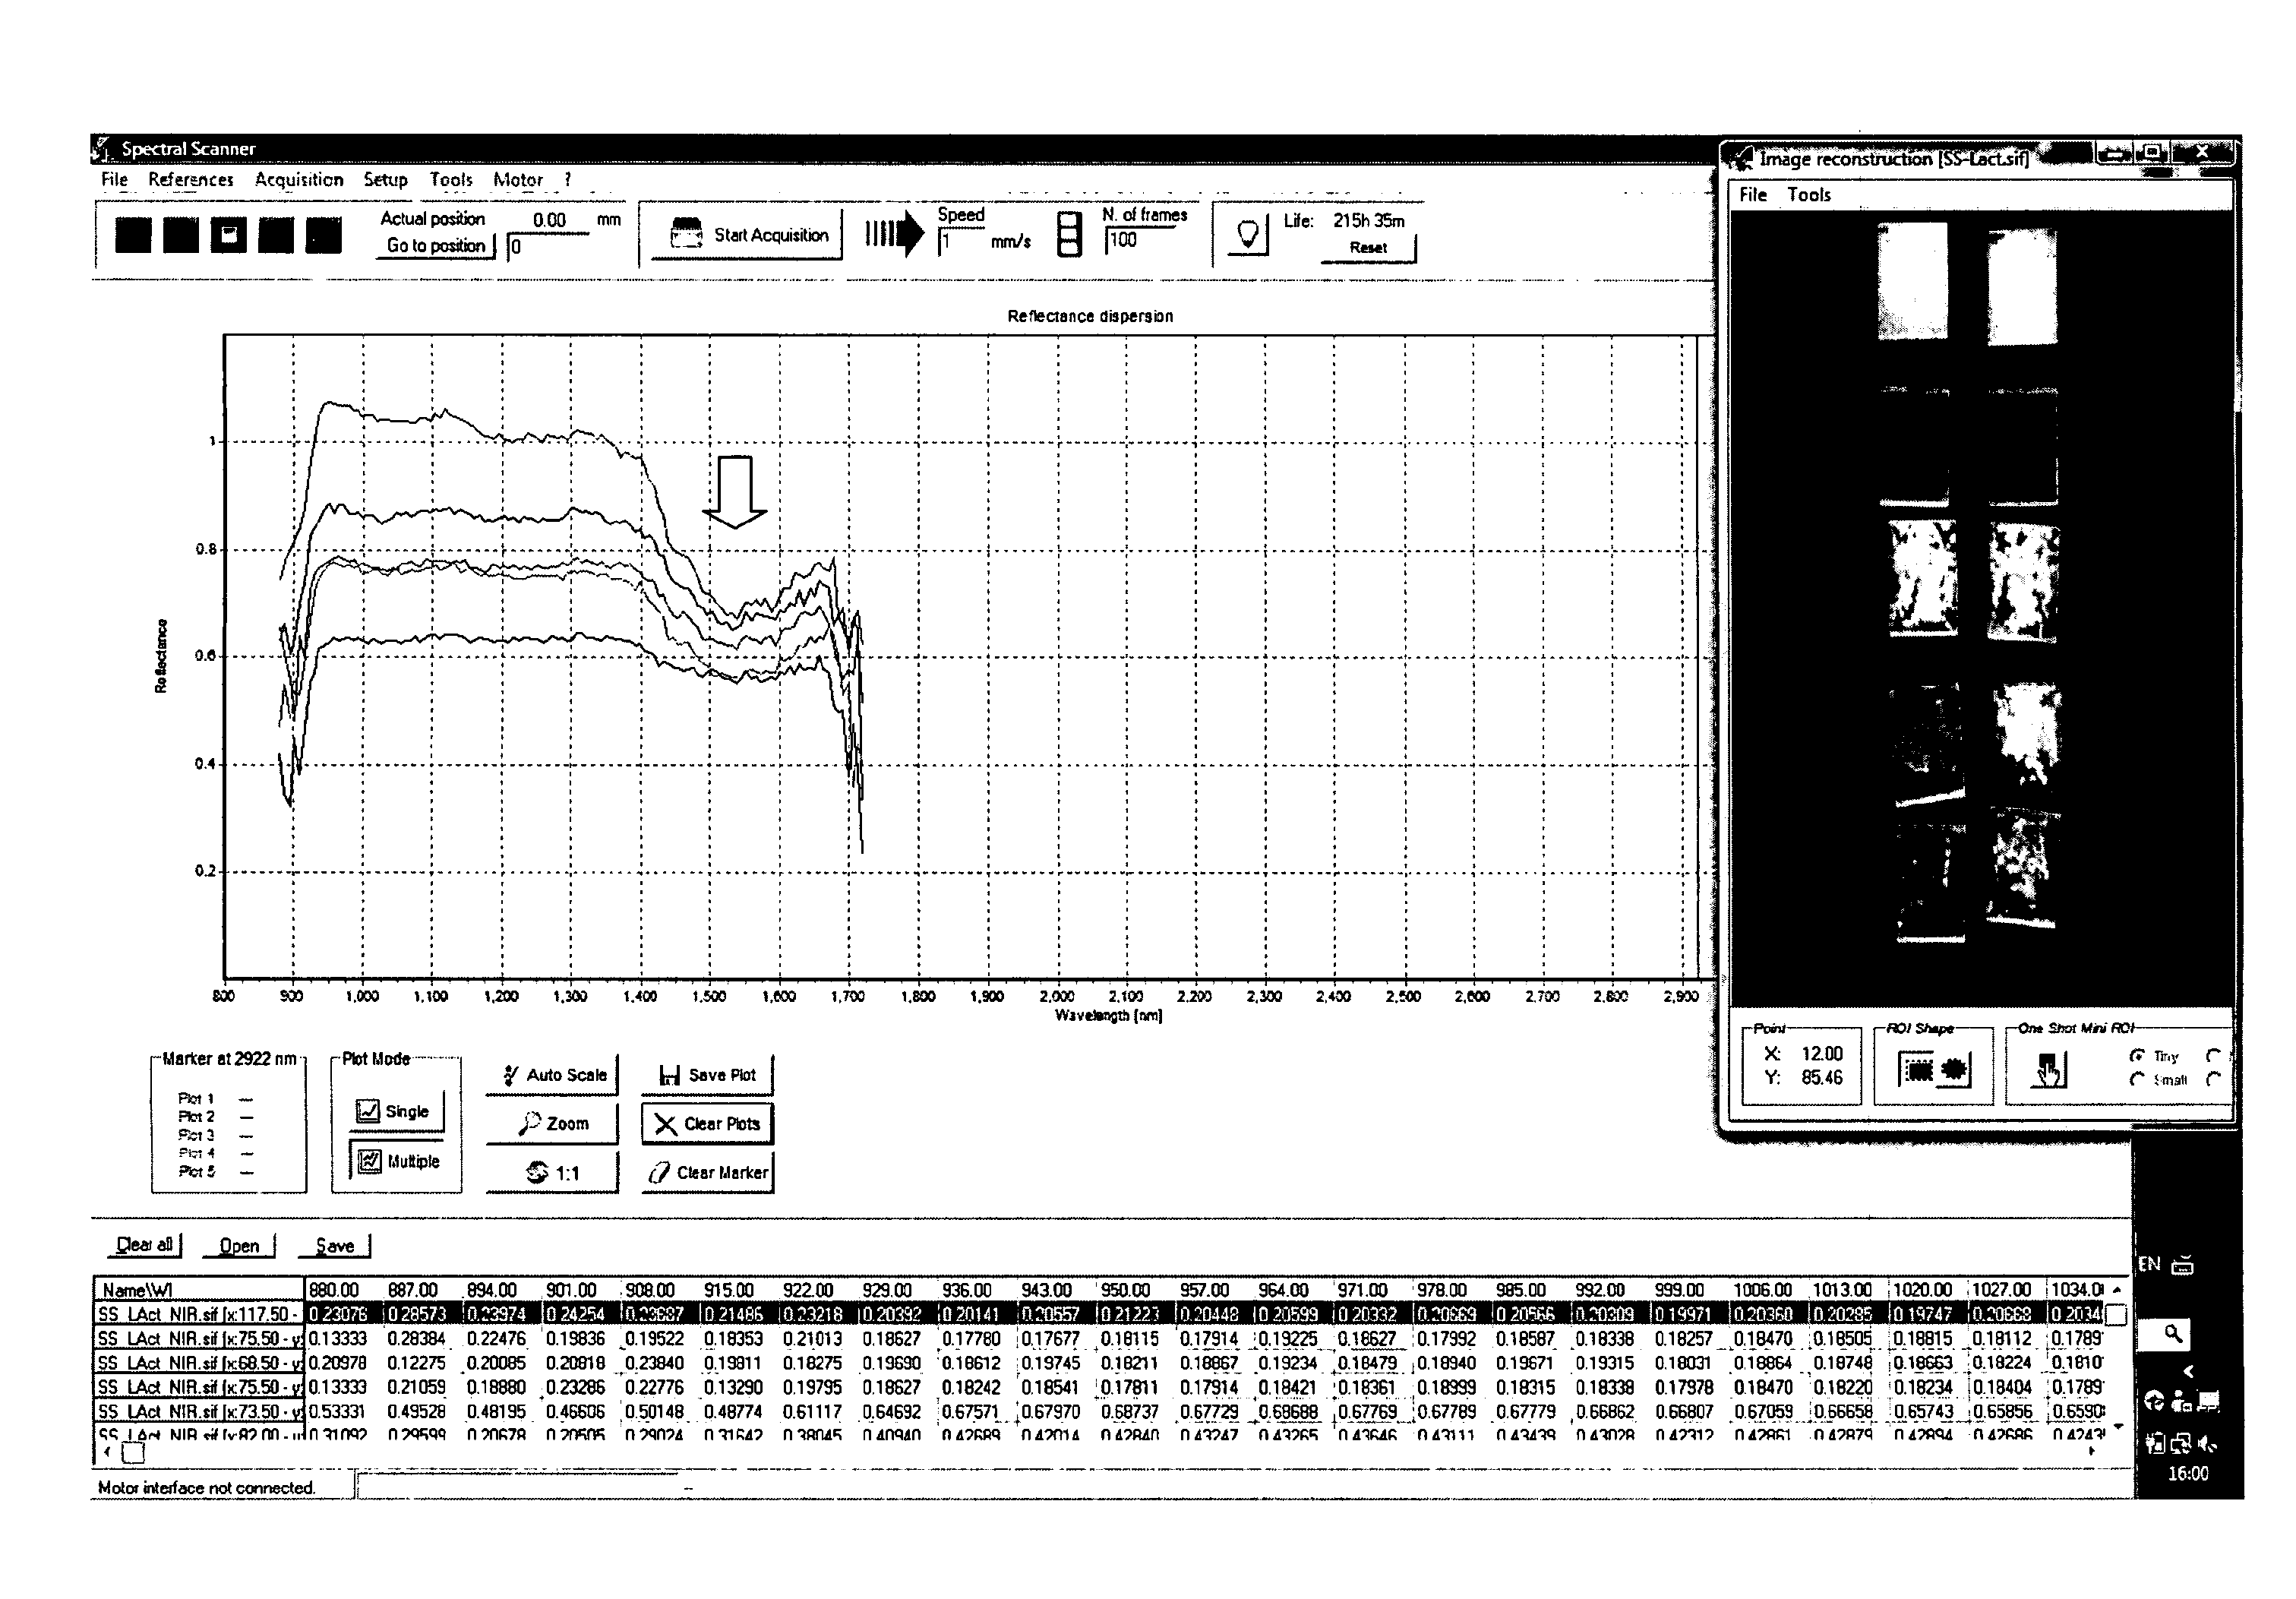
[0127]Coupons were washed with hot water and dried[0128]Blank was sprayed twice with a 80% ethanol solution and left dry[0129]Concentrations C1 to C8 were achieve by successive cycles of spraying lactose solution over the coupon and drying, i.e. once to C1, twice to C2, three time to C3, . . . , and eight times to C8.[0130]Hyperspectral images were acquired.[0131]Data analysis

[0132]Concentration over the coupon was estimated according with the following equation:

Concentration(μg50cm2)=d*b*e*50c*a

aCoupon100cm{circumflex over ( )}2AreabFactor0.5cDensity0.8g / mldEach spray0.332gmasseSolution1000g / mlconcentration

[0133]Cleaning validation coupons, 316 stainless steel, #4 finish, 10 cm×10 cm SS316-#4

[0134]...

example 2

[0136]The second experiment carried out was with a lactose sample in a water and alcohol dilution series, which was placed on 10 cm×10 cm stainless steel coupon.

Results

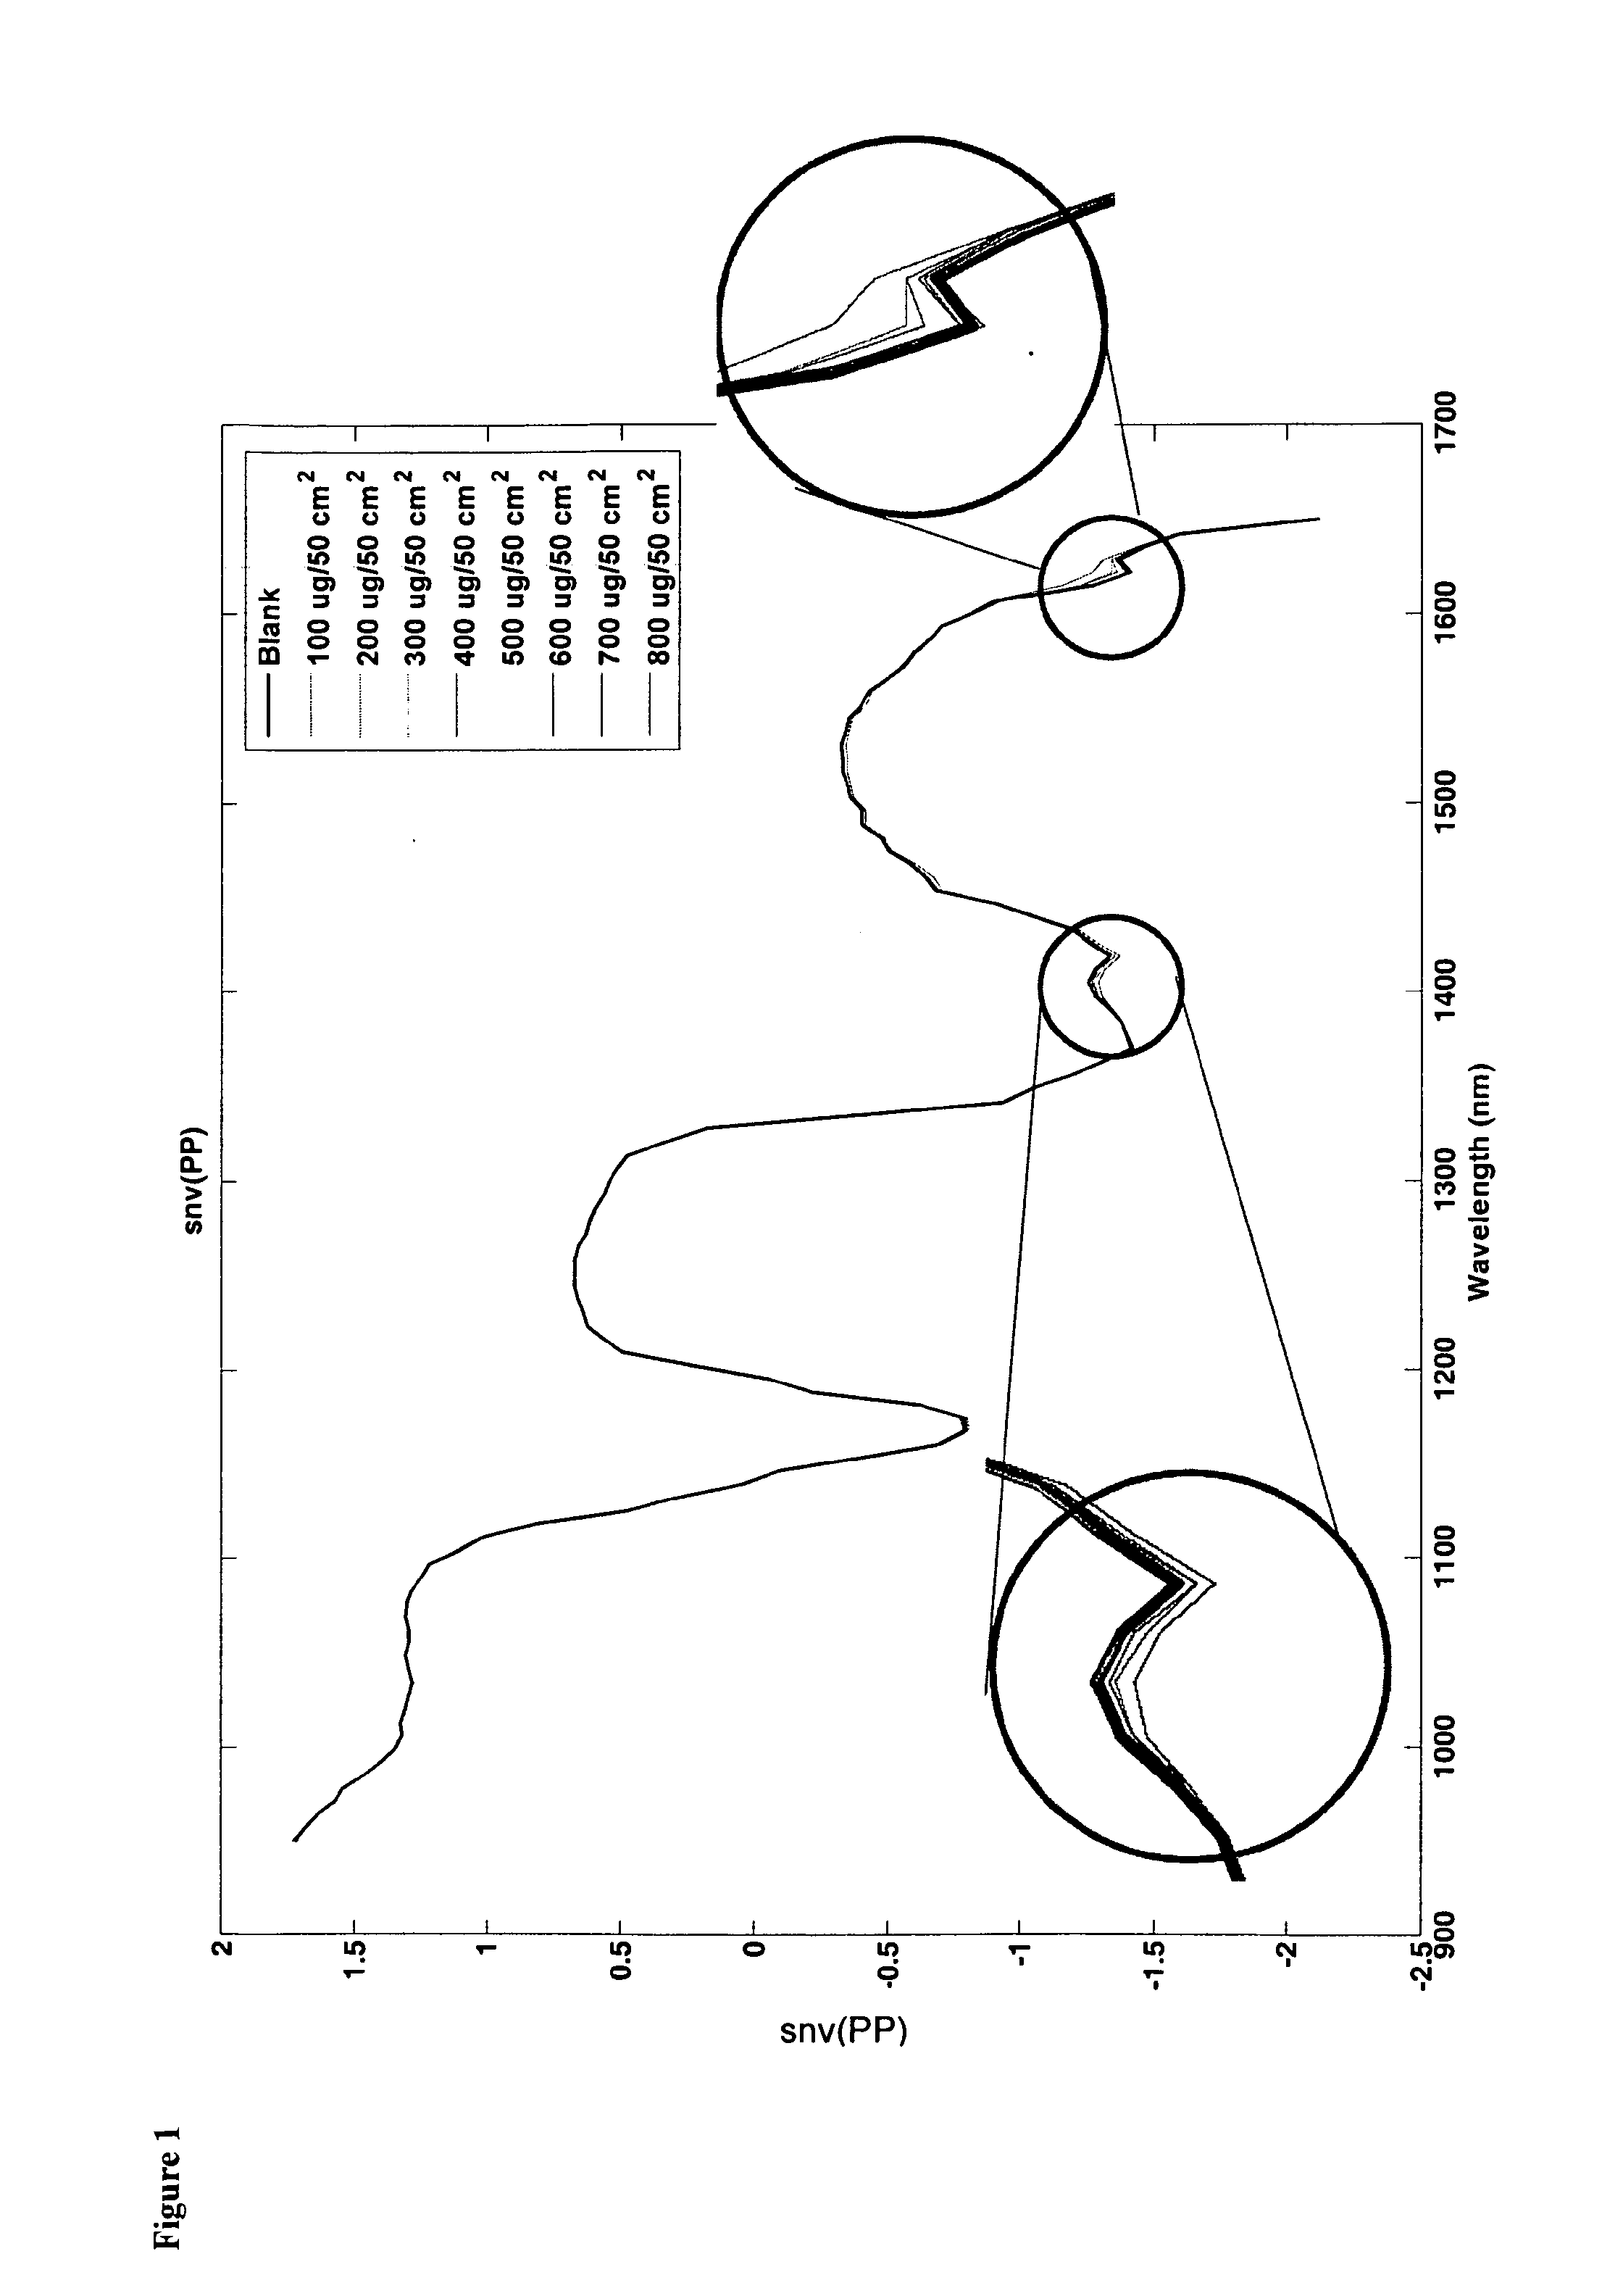
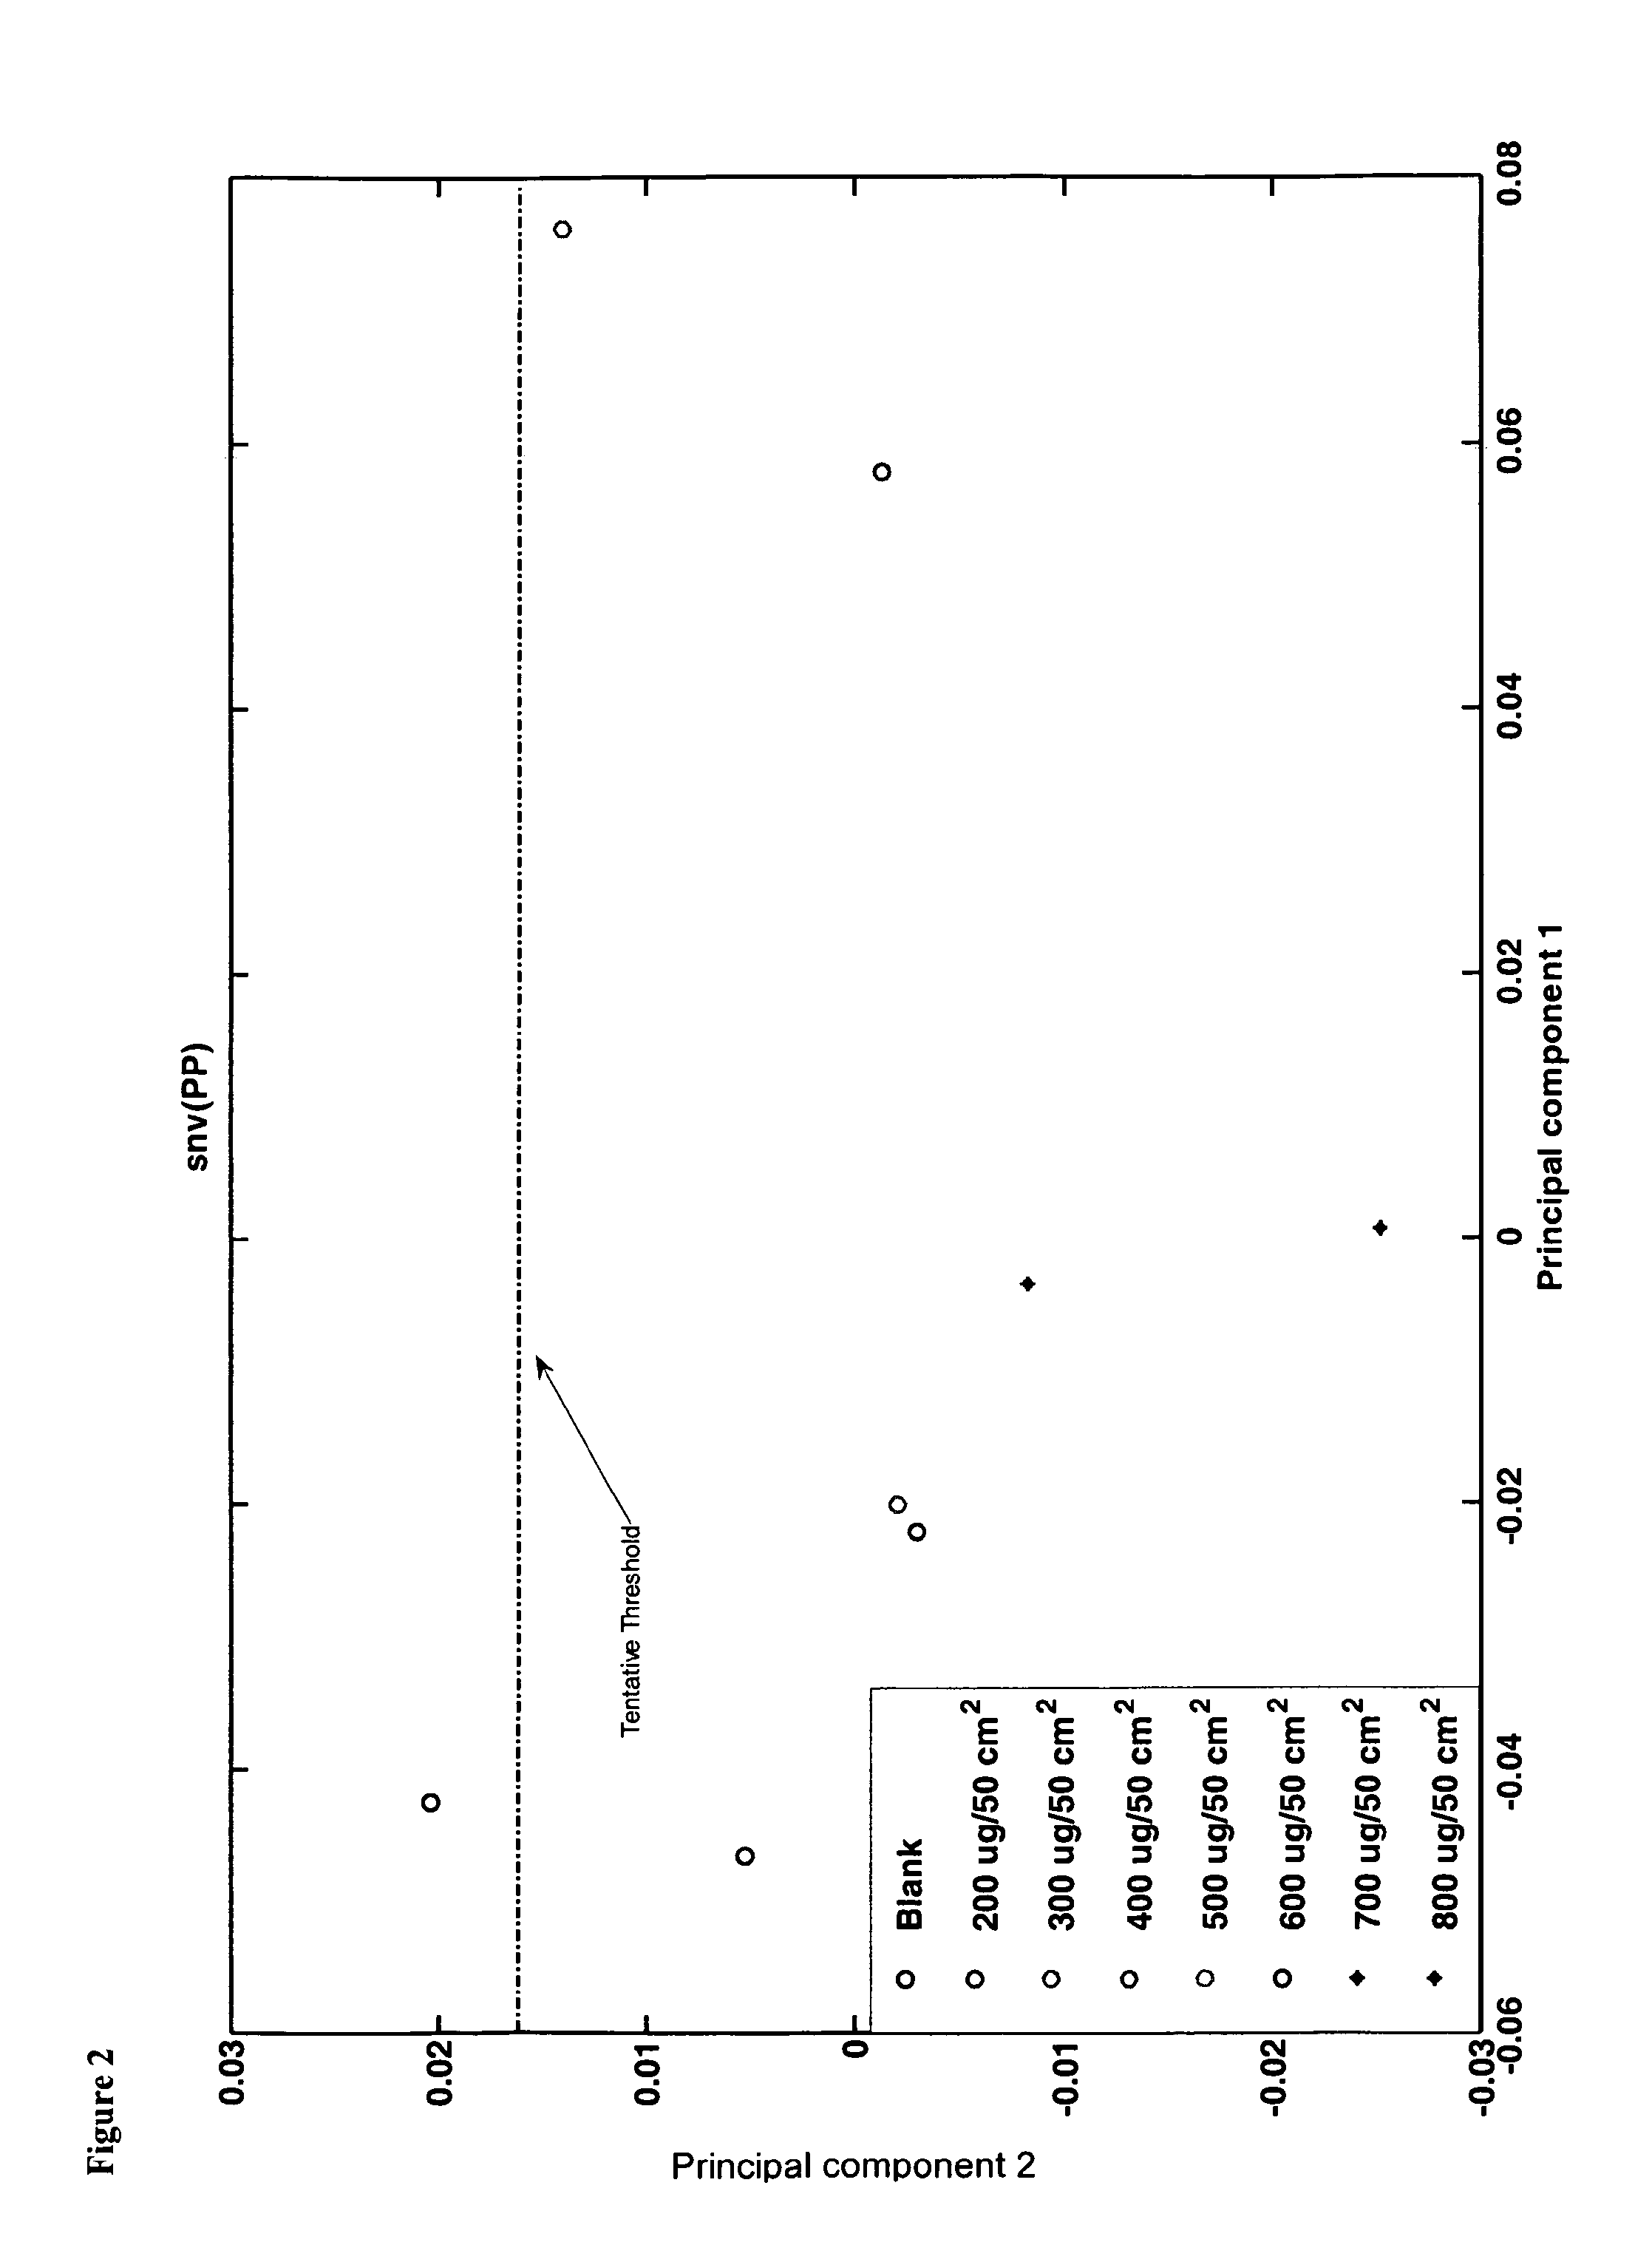
[0137]There was an identifiable peak present at 1340 and 1620 nm as illustrated by FIG. 3. Both peaks appeared to exhibit an increase in strength as the concentration of the sample increased. There was excellent separation of spectra per concentration sample. This study confirms the ability of the technology used in the method of the invention to quantify lactose concentrations as low as 100 ug / 100 cm2 from Stainless Steel material. Such results are difficult to achieve using prior art methods due to low signal to noise issued on steel. FIG. 4 illustrates the principle component score plot of Standard Normal Variate (SNV) of reflectance spectra for lactose on stainless steel.

Conclusion

[0138]In conclusion, the experimental work was successful in confirming that NIR-CI used in the method of the invention is an appropria...

example 3

[0139]This experiment was carried out using a lactose sample in an alcohol dilution series, which was placed on 2 cm×2 cm stainless steel tiles.

Materials and Methods

[0140]1) Dilute series of lactose samples in alcohol.[0141]5 g lactose in 50 ml water or 10% dilution. Then dilute down into a 5%, 2.5% and 1.25% dilution.[0142]2) Pipette dilutions onto the stainless steel slides in 0.1 ml samples.[0143]3) Air dry slides.[0144]4) Remove slides and scan to get the spectra for the lactose.[0145]5) Obtain hyperspectral images using a pushbroom line-scanning HSI instrument (DV Optics Ltd., Padua, Italy), operating in the NIR (950-1700 nm) wavelength range.

Results

[0146]A variance was identified in the spectra of samples, which should have given uniform spectra (FIG. 7). There was also a variance in the background spectra, as illustrated by FIG. 6. These variances were down to the fact that the stainless steel tiles were all separate and the cut edges of the stainless steel were giving off sl...


PUM


Abstract

A method of validating or verifying a process for cleaning a surface contaminated with at least one chemical substrate, comprising the steps of: capturing an infrared image of the surface using infrared chemical imaging; utilising at least one algorithm to interpret the captured image to extract an infra-red signal from the at least one chemical substrate to determine the amount of the at least one chemical substrate present on the surface; and determining if the amount of the at least one detected chemical substrate exceeds a threshold value, thereby indicating that a repeat cleaning process is required or thereby indicating that no further cleaning is required.

Description

FIELD OF THE INVENTION[0001]The present invention relates to the spectroscopic evaluation of a substance or product on a surface. In particular, the present invention relates to use of such evaluation in a method of validation or verification of a cleaning process of a surface. The surface may be that of pharmaceutical manufacturing equipment and the method comprises spectroscopic evaluation of a substance or product on a surface.BACKGROUND TO THE INVENTION[0002]In many manufacturing processes, and in particular, in the pharmaceutical manufacturing industry, the removal of potentially harmful contaminants from all product contact equipment is of vital importance. It ensures the safety, efficacy and quality of all products that are manufactured using the equipment.[0003]The cleaning procedure utilised in such industries must be validated to verify its effectiveness, based on pre-determined acceptance criteria. Cleaning process validation is thus executed on all product manufacture co...

Claims


Application Information

Patent Timeline
IPC IPC(8): H04N5/33
CPCG01N21/35G01N21/359G01N21/3563H04N5/33G01N21/3577G01N21/94
Inventor JONES, IAN
Owner JONES IAN
Why Eureka
Try Eureka