
Phosphonate additives for nonaqueous electrolyte in rechargeable cells
a rechargeable cell and additive technology, applied in the field of alkali metal electrochemical cells, can solve the problems of limited choice of electrolyte solvent systems, permanent capacity loss, and general cathode limitation of lithium ion cells
- Summary
- Abstract
- Description
- Claims
- Application Information
AI Technical Summary
Benefits of technology
Problems solved by technology
Method used
Image

Examples
example ii
After the initial cycle, the cycling of the six cells continued for a total of 10 times under the same cycling conditions as described in Example I. The discharge capacities and the capacity retention of each cycle are summarized in Table 2. The capacity retention is defined as the capacity percentage of each discharge cycle relative to that of the first cycle discharge capacity.
The data in Table 2 demonstrate that the group 2 cells with the dibenzyl phosphonate additive consistently presented higher discharge capacities in all cycles. In addition, this higher capacity was not realized at the expense of lower cycle life. The group 1 and 2 cells had essentially the same cycling capacity retention throughout the various cycles.
example iii
After the above cycle testing described in Example II, the cells were charged according to the procedures described in Example I. Then, the cells were discharged under a 1000 mA constant current to 2.75 V then a five minute open circuit rest, followed by a 500 mA constant current discharge to 2.75 V then a five minute open circuit rest, followed by a 250 mA constant current discharge to 2.75 V then a five minute open circuit rest and, finally, followed by a 100 mA constant current discharge to 2.75 V then a five minute open circuit rest. The averaged total capacities under each discharge rate are summarized in Table 3 and the comparison of averaged discharge efficiency (defined as % capacity of a 100 mA constant current discharge) under the various constant currents are summarized in Table 4. In Table 3, the discharge capacities are cumulative from one discharge current to the next.
TABLE 4
The data in Table 3 indicate that the group 2 cells with phosphonate additive delivered increas...
example iv
After the above discharge rate capability test, all the cells were fully charged according to the procedure described in Example I. The six test cells were then stored on open circuit voltage (OCV) at 37.degree. C. for two weeks. Finally, the cells were discharged and cycled for eight more times. The % of self-discharge and the capacity retention were calculated and are shown in Table 5.
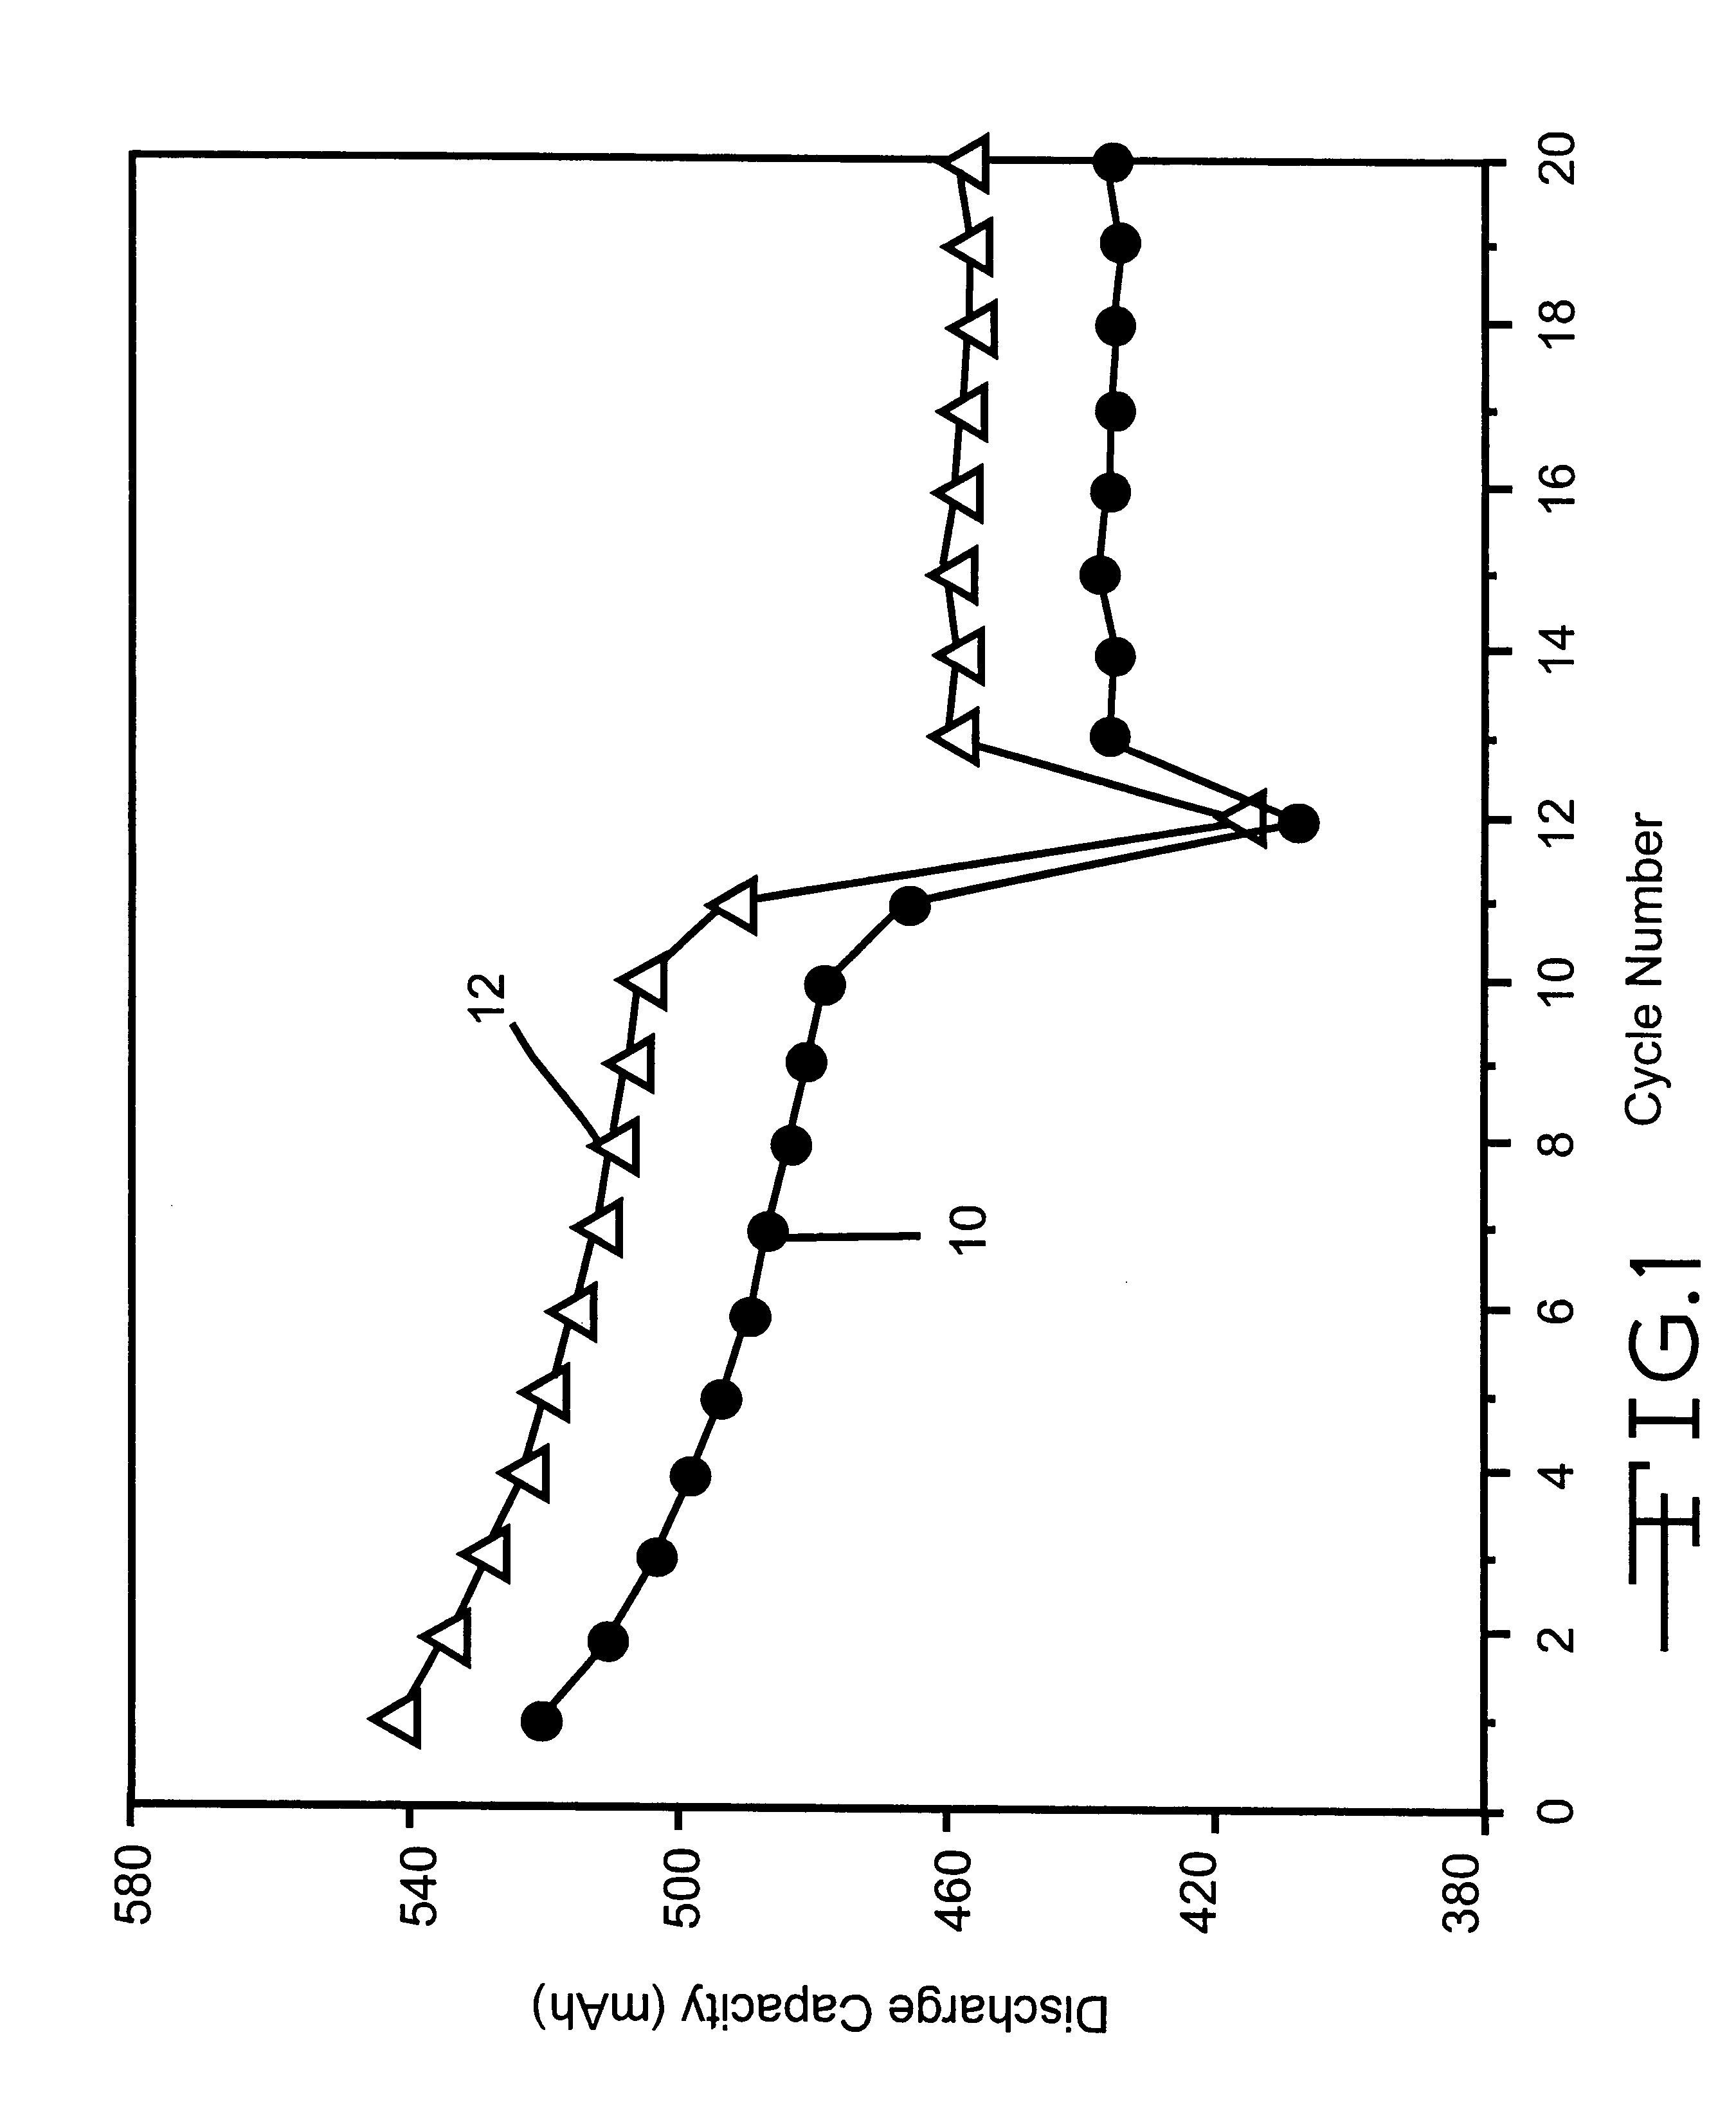
The data in Table 5 demonstrate that both groups of cells exhibited similar self-discharge rates and similar after storage capacity retention rates. However, since the group 2 cells had higher discharge capacities than that of the group 1 cells, the capacities of the group 2 cells were still higher than that of the group 1 cells, even though they presented similar self-discharge and capacity retention rates. A total of 20 cycles were obtained and the results are summarized in FIG. 1. In particular, curve 10 was constructed from the averaged cycling data of the group 1 cells devoid of the phosphonate ...
PUM
| Property | Measurement | Unit |
|---|---|---|
| temperatures | aaaaa | aaaaa |
| temperatures | aaaaa | aaaaa |
| temperature cycleability | aaaaa | aaaaa |
Abstract
Description
Claims
Application Information