Method of improving blue algae in-situ detection precision by using anti-fluorescent interference decoupling algorithm
A fluorescence intensity, cyanobacteria technology, applied in fluorescence/phosphorescence, material excitation analysis, etc., can solve problems such as labor-intensive, phycocyanin concentration results are greatly interfered by chlorophyll, and sample processing requirements are complicated and cumbersome.
- Summary
- Abstract
- Description
- Claims
- Application Information
AI Technical Summary
Problems solved by technology
Method used
Image
Examples
Embodiment 1
[0153] Embodiment 1, the fluorescence characteristic analysis of three kinds of pigments
[0154] Take the mother liquor of chlorophyll a, chlorophyll b and phycocyanin, and prepare them as 2mg / L, 1mg / L, 0.5mg / L, 0.25mg / L, 0.125mg / L, 0.075mg / L solutions respectively, and choose 15 mg / L as the dilution solvent % PBS ethanol solution.
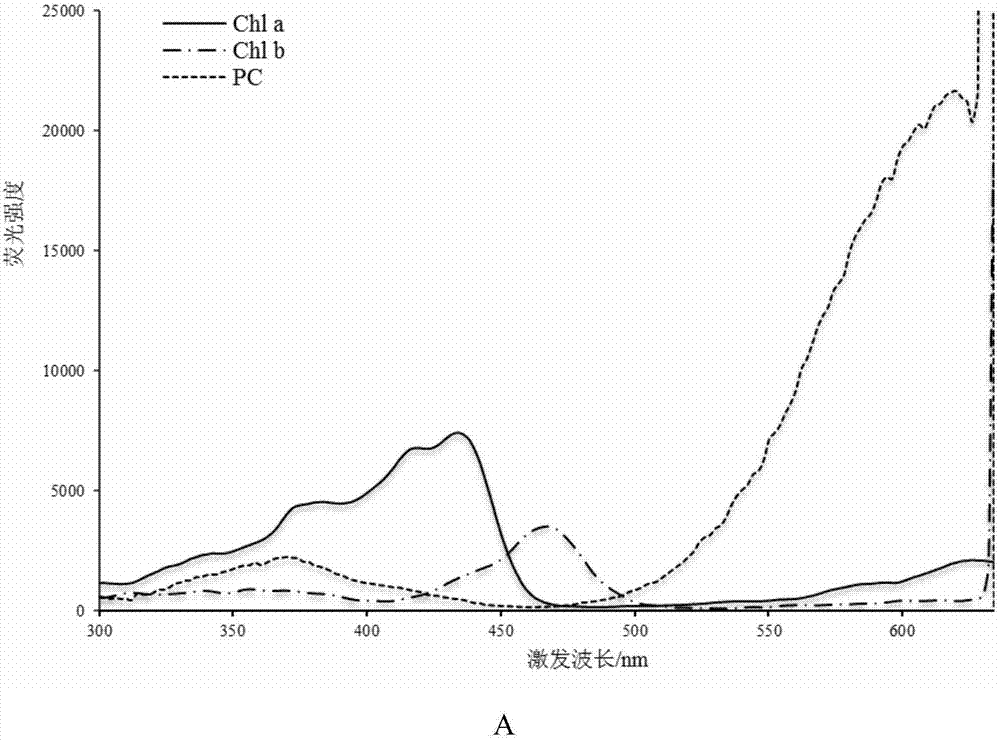
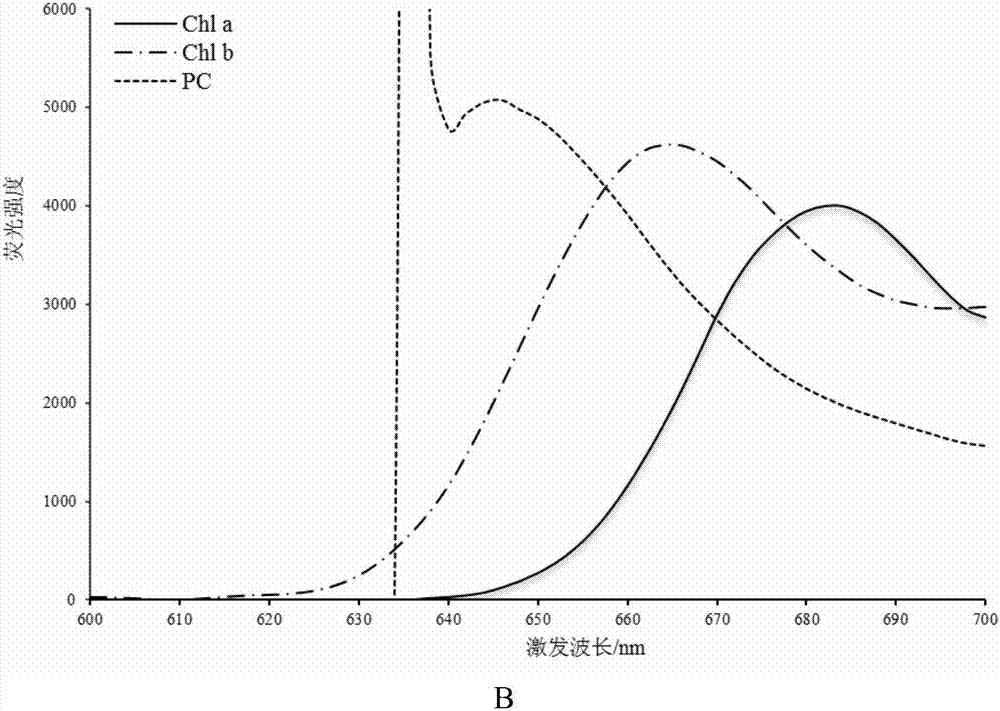
[0155] Take 200 μL of the solution in a 96-well plate, adjust the relevant parameters of the fluorescence spectrophotometer, and scan the excitation spectrum and emission spectrum. Then, according to the spectral values of different concentration gradients, the series average value of the fluorescence spectrum of the unit substance is taken, and the obtained results are shown in figure 2 .
[0156] The fluorescence characteristics of the three pigments can be obtained from the excitation and emission spectra of the three pigments:
[0157] Chlorophyll a: The excitation peak is 434nm, and the emission peak is 679nm;
[0158] Chlorophyll b: ...
Embodiment 2
[0161] Example 2, wavelength screening of three kinds of pigment coupling detection and analysis by fluorescence method
[0162] According to Example 1, it can be seen that there is obvious interference between the detection of the three pigments of chlorophyll a, chlorophyll b and phycocyanin. The purpose of this example is to screen different wavelengths of excitation light and emission light to make each other The degree of interference between them is minimal. The operation flow chart of the wavelength screening method is as follows: Figure 4 shown. For a flow chart of the data processing procedure, see Figure 5 .
[0163] The first step is to establish a fluorescence characteristic database for each pigment, see Table 1-Table 3.
[0164] Table 1 Database of fluorescence characteristics of chlorophyll a under different excitation and emission wavelengths
[0165]
[0166] Table 2 Database of fluorescence properties of phycocyanin under different excitation and em...
Embodiment 3
[0190] Example 3. Verification experiment of wavelength screening to realize the separation of three kinds of pigment interference
[0191] According to the establishment method of the detection model proposed by the present invention, the excitation light wavelength and emission light wavelength of the spectrophotometer are respectively adjusted to the wavelength combinations obtained in Example 2 (Table 2). Dilute the three pigments respectively: 2mg / L, 1mg / L, 0.5mg / L, 0.25mg / L, 0.125mg / L, 0.075mg / L, 0.0375mg / L, 0.01875mg / L eight gradient concentrations , to detect the fluorescence intensity under the respective fluorescence conditions. Fit the linear relationship of 8 concentration gradients according to the least square method, and calculate the k under the specific wavelength combination of the three pigments ij with b i . The overall model obtained for the detection of the three pigments is:
[0192]
[0193]
[0194]
[0195] The trimmed result is:
[0196...
PUM
 Abstract
Description
Claims
Application Information
 - R&D
- Intellectual Property
- Life Sciences
- Materials
- Tech Scout
- Unparalleled Data Quality
- Higher Quality Content
- 60% Fewer Hallucinations
Browse by: Latest US Patents, China's latest patents, Technical Efficacy Thesaurus, Application Domain, Technology Topic, Popular Technical Reports.
© 2025 PatSnap. All rights reserved.Legal|Privacy policy|Modern Slavery Act Transparency Statement|Sitemap|About US| Contact US: help@patsnap.com


