Enhanced protein separation and analysis

a protein and protein technology, applied in the field of proteomics, can solve the problems of large number of spots not optimally separated, difficult to solubilize isoelectric focusing, and little information about the assembly state or functionality of individual protein complexes, and achieve the effect of dramatically improving proteome analysis

Inactive Publication Date: 2004-06-03
STATE OF OREGON ACTING BY & THROUGH THE OREGON STATE BOARD OF HIGHER EDUCATION ON BEHALF OF THE OREGON HEALTH SCI UNIV +1
View PDF3 Cites 6 Cited by
  • Summary
  • Abstract
  • Description
  • Claims
  • Application Information

AI Technical Summary

Benefits of technology

0008] The inventors have surprisingly found that proteome analysis can be dramatically improved by including a preliminary separation of samples based on their interactions with other proteins (their tertiary structure). Examples of such preliminary separation are sucrose gradients and non-denaturing gel electrophoresis. Using a preliminary separation step that does not fully disrupt the tertiary structure of protein complexes, a third dimension can be added to traditional proteomics analysis. The three separations are based on (A) association of prote

Problems solved by technology

In addition, such maps provide little information about the assembly-state or functionality of individual protein complexes.
Furthermore, a disproportionate number of proteins in the mitochondrion are membrane associated making them difficult to solubilize for isoelectric focusing.
However, there are a number of problems with this most straightforward approach.
First, the vast number of spots are not optimally separated, particularly as many components appear to be present in multiple forms due to post-tran

Method used


Image

  • Enhanced protein separation and analysis
  • Enhanced protein separation and analysis
  • Enhanced protein separation and analysis

Examples


example 1

Preparation of a Biological Sample

[0094] This example provides descriptions of how one sample type, isolated mitochondria, can be prepared from various tissues for analysis using the separation systems described herein. Other tissue, cell, or subcellular preparations also can be examined; such samples can be prepared using any conventional means.

[0095] In certain embodiments, it is beneficial that the final preparation is not substantially denatured (e.g., so that in vivo protein-protein interactions have been substantially maintained). In general, the more pure the target sample is, the better the results will be from the proteomic analysis.

[0096] Preparation of Mitochondria from Bovine Heart

[0097] All steps for purifying mitochondria were done at 4.degree. C. unless otherwise stated.

[0098] The ventricles of a fresh bovine heart were cleaned of any connective tissue and fat before being minced into small pieces. About 600 ml of a Tris / sucrose buffer (0.2 mM EDTA, 0.25 M sucrose, 10...

example 2

Non-denaturing Separation of the Biological Sample

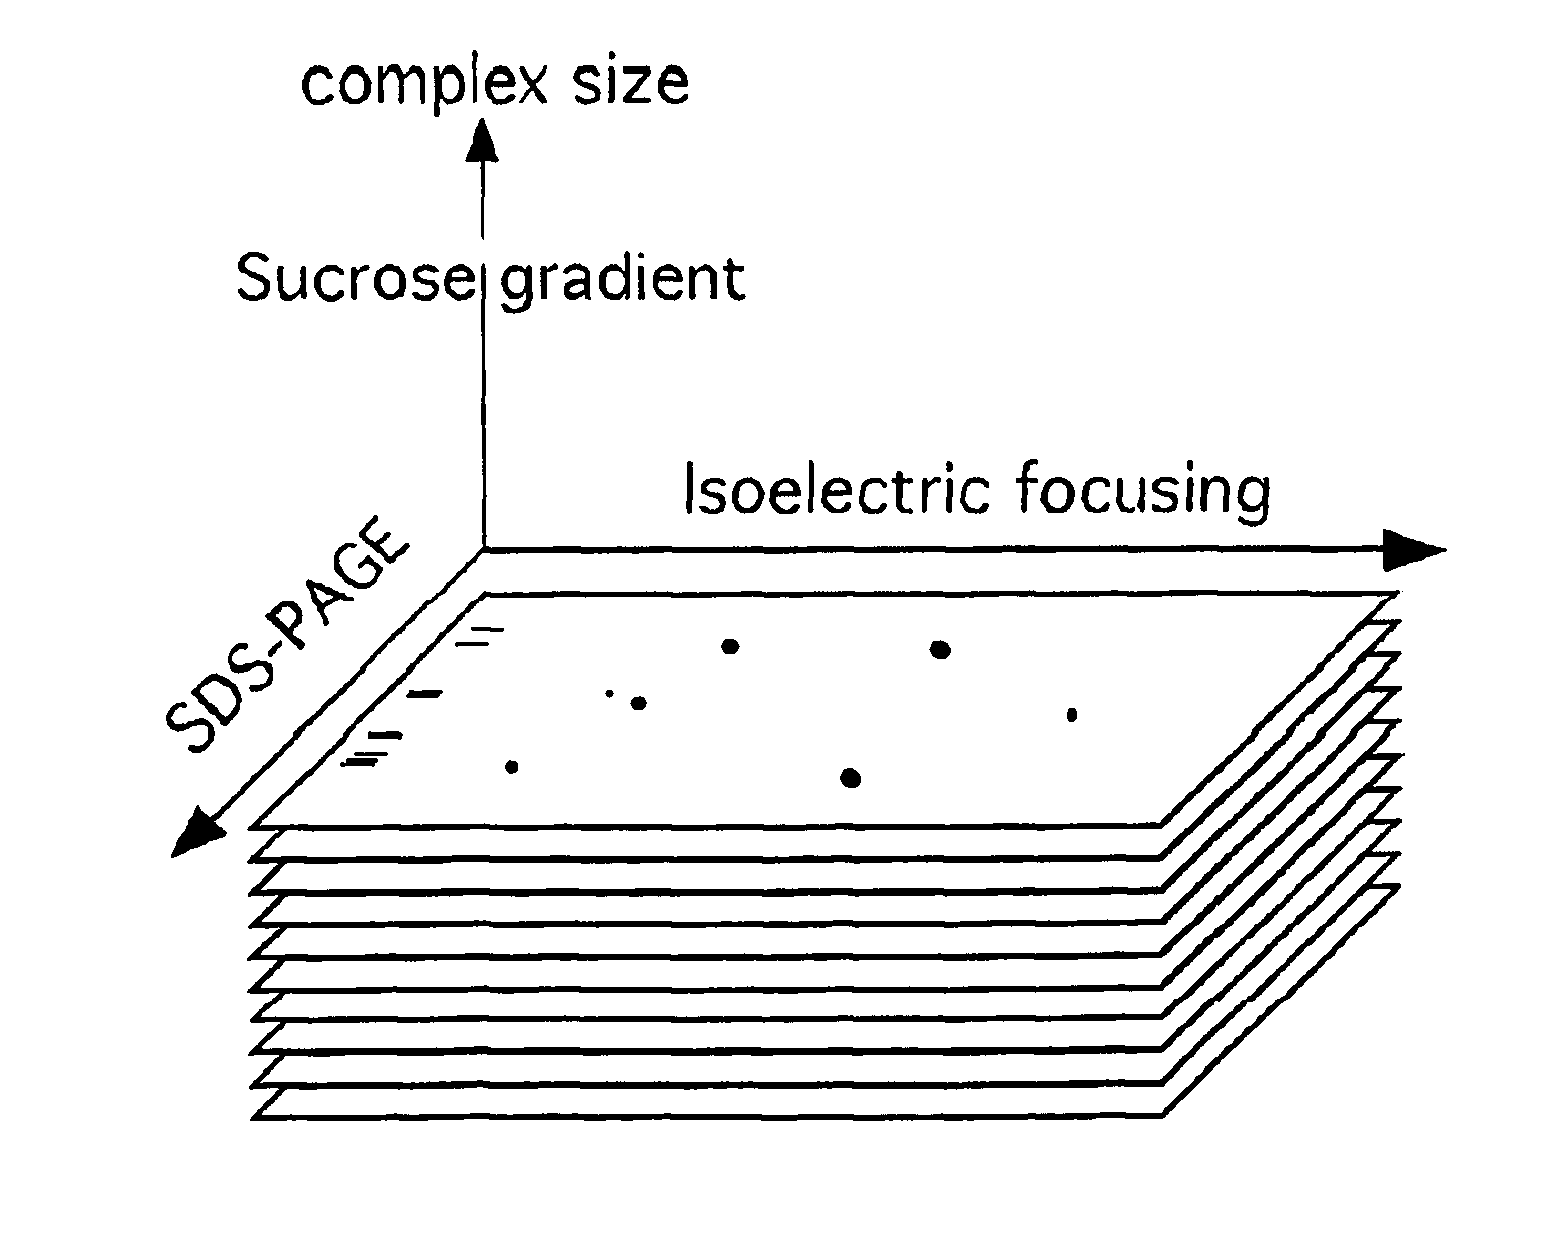
[0105] This is a representative example of a non-denaturing separation technique, discontinuous sucrose gradient analysis, which can be used to separate biological components based on their protein-protein interactions.

[0106] Separation of Mitochondrial Proteins by Sucrose Gradient Fractionation

[0107] Two slightly different sucrose gradients have been employed for the separation of mitochondrial complexes after extraction. The first gradient is optimized for the purification of the respiratory chain complex I, whereas the second is optimized for the use in 2-DE (two dimensional electrophoresis). These gradients are referred to herein as gradient A and gradient B, respectively.

[0108] Mitochondria prepared from three different sources (bovine heart, cultured MRC-5 fibroblasts, and human brain) as described above, were solubilized for analysis using 1% LM. Mitochondria (1-5 mg) were pelleted (TLA 100.2 Beckman rotor, 10,000.times.g, 10 ...

example 3

Denaturing Separation of the Biological Sample

[0109] This example provides one method for further separating proteins in fractions of a sucrose gradient, using denaturing gel electrophoresis, specifically SDS-PAGE. In some embodiments, this separation step is performed immediately after separation of the sample using a non-denaturing system (e.g., sucrose gradient fractionation). In other embodiments, fractionated samples are first subjected to isoelectric focusing gel analysis, then applied to a denaturing gel for final analysis.

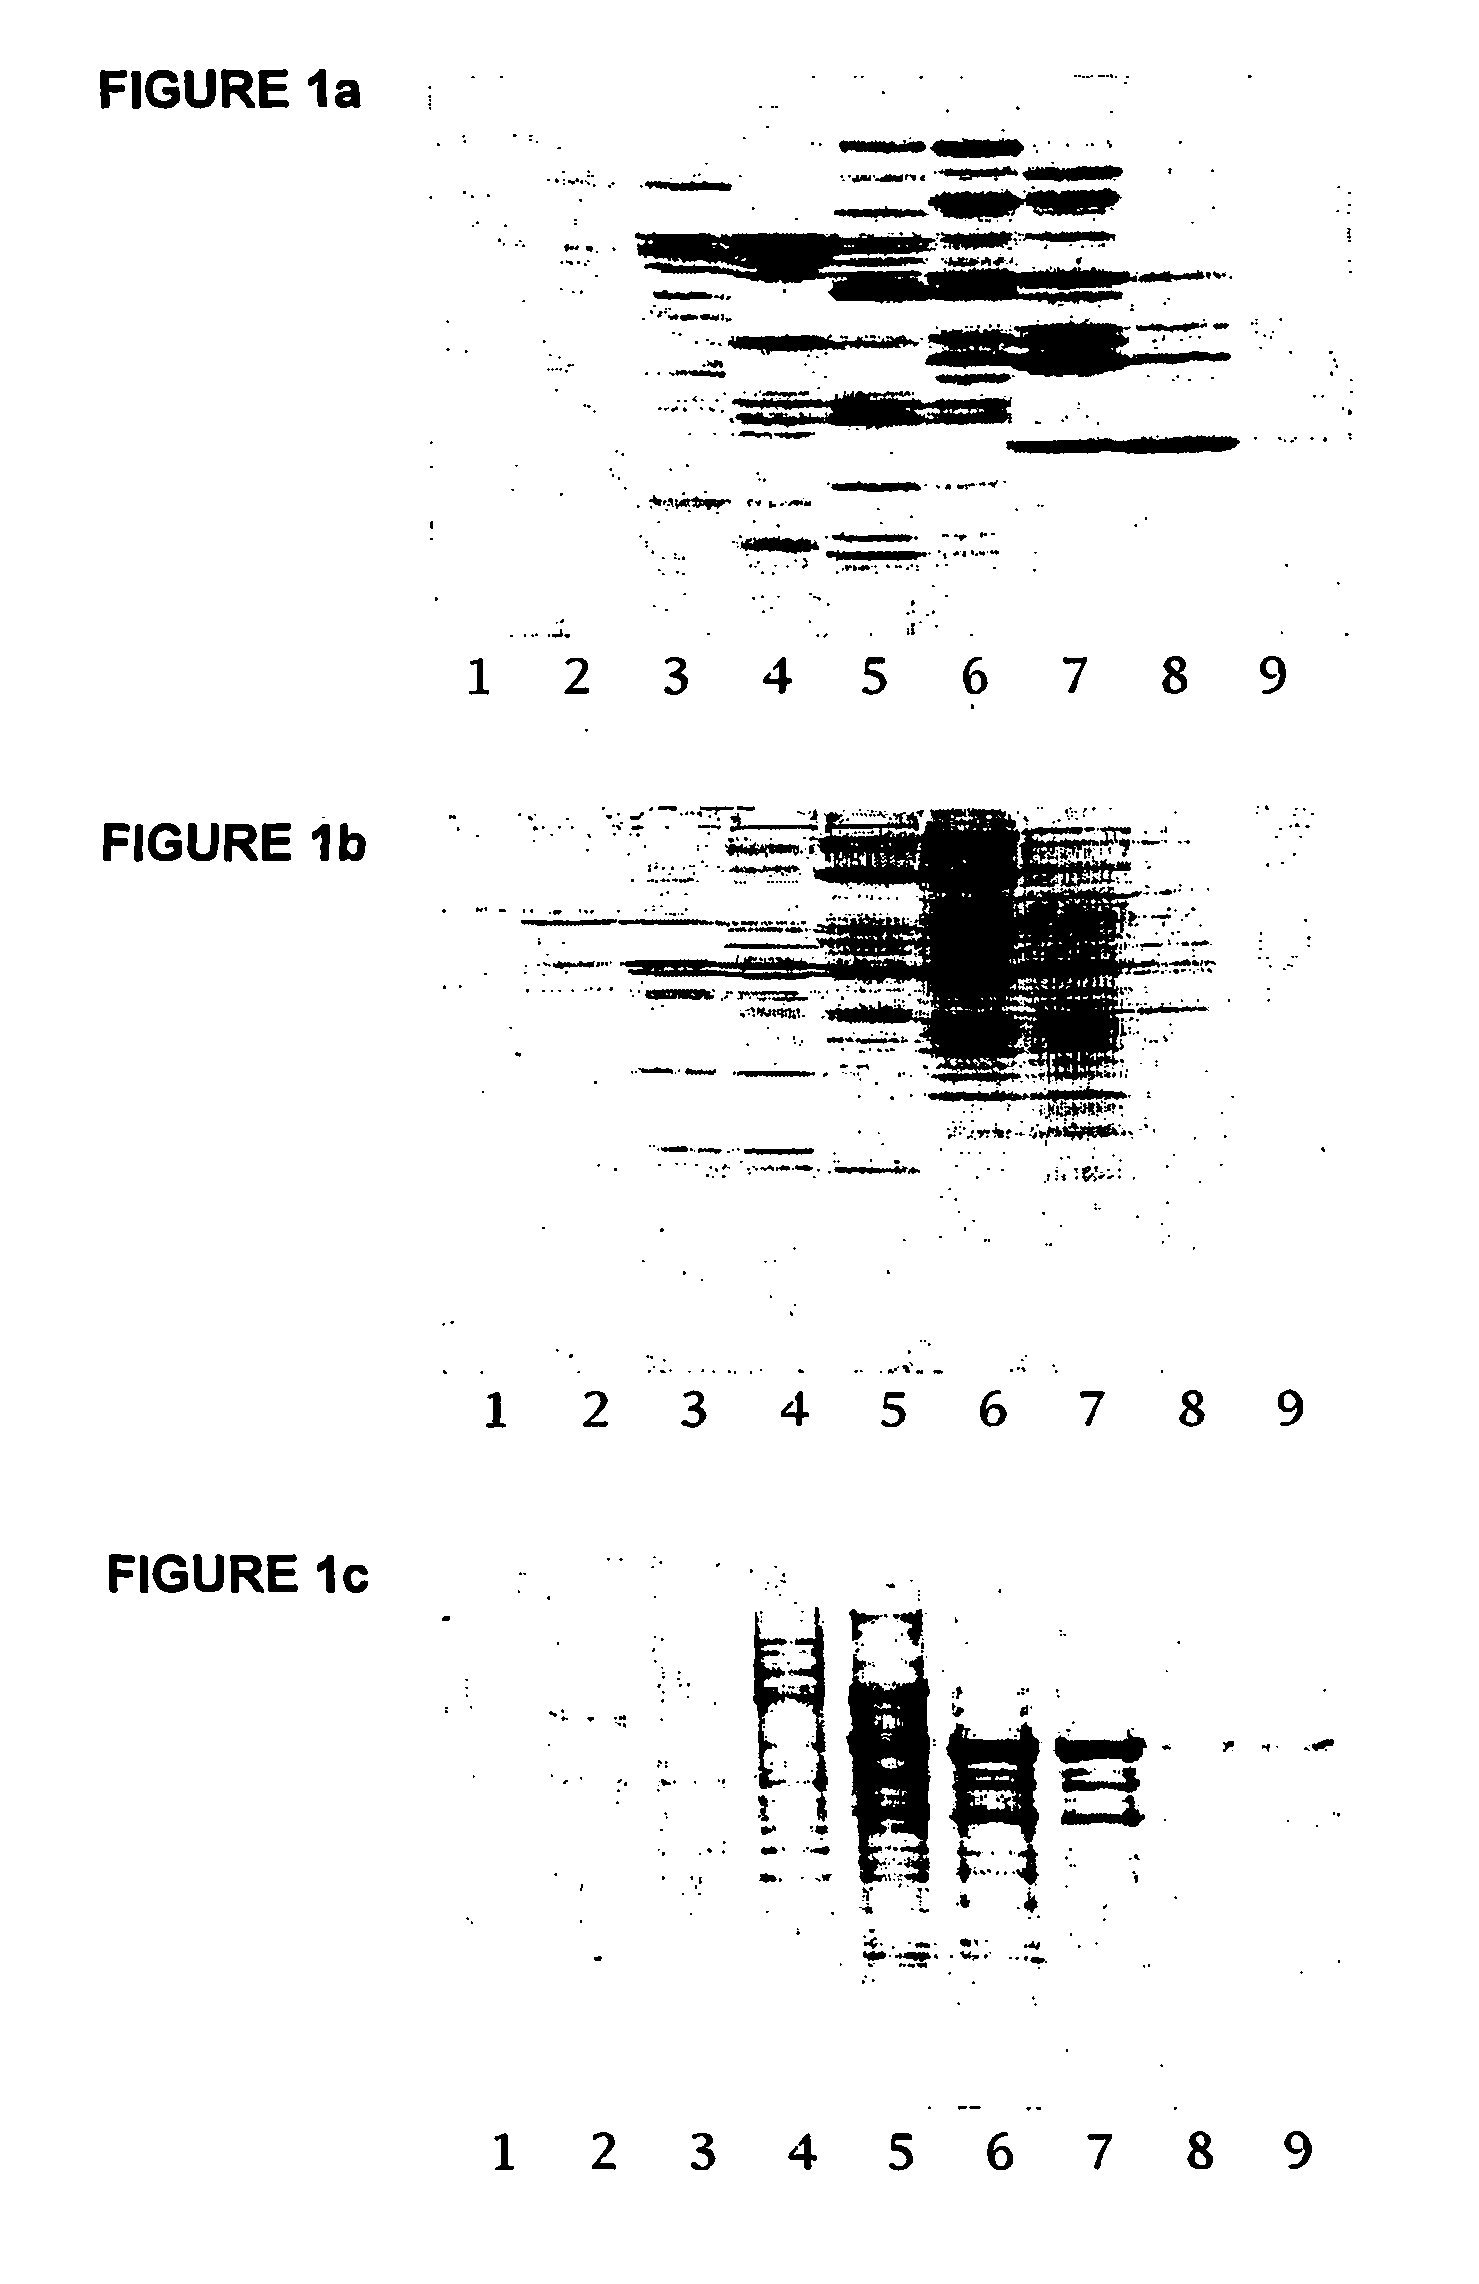
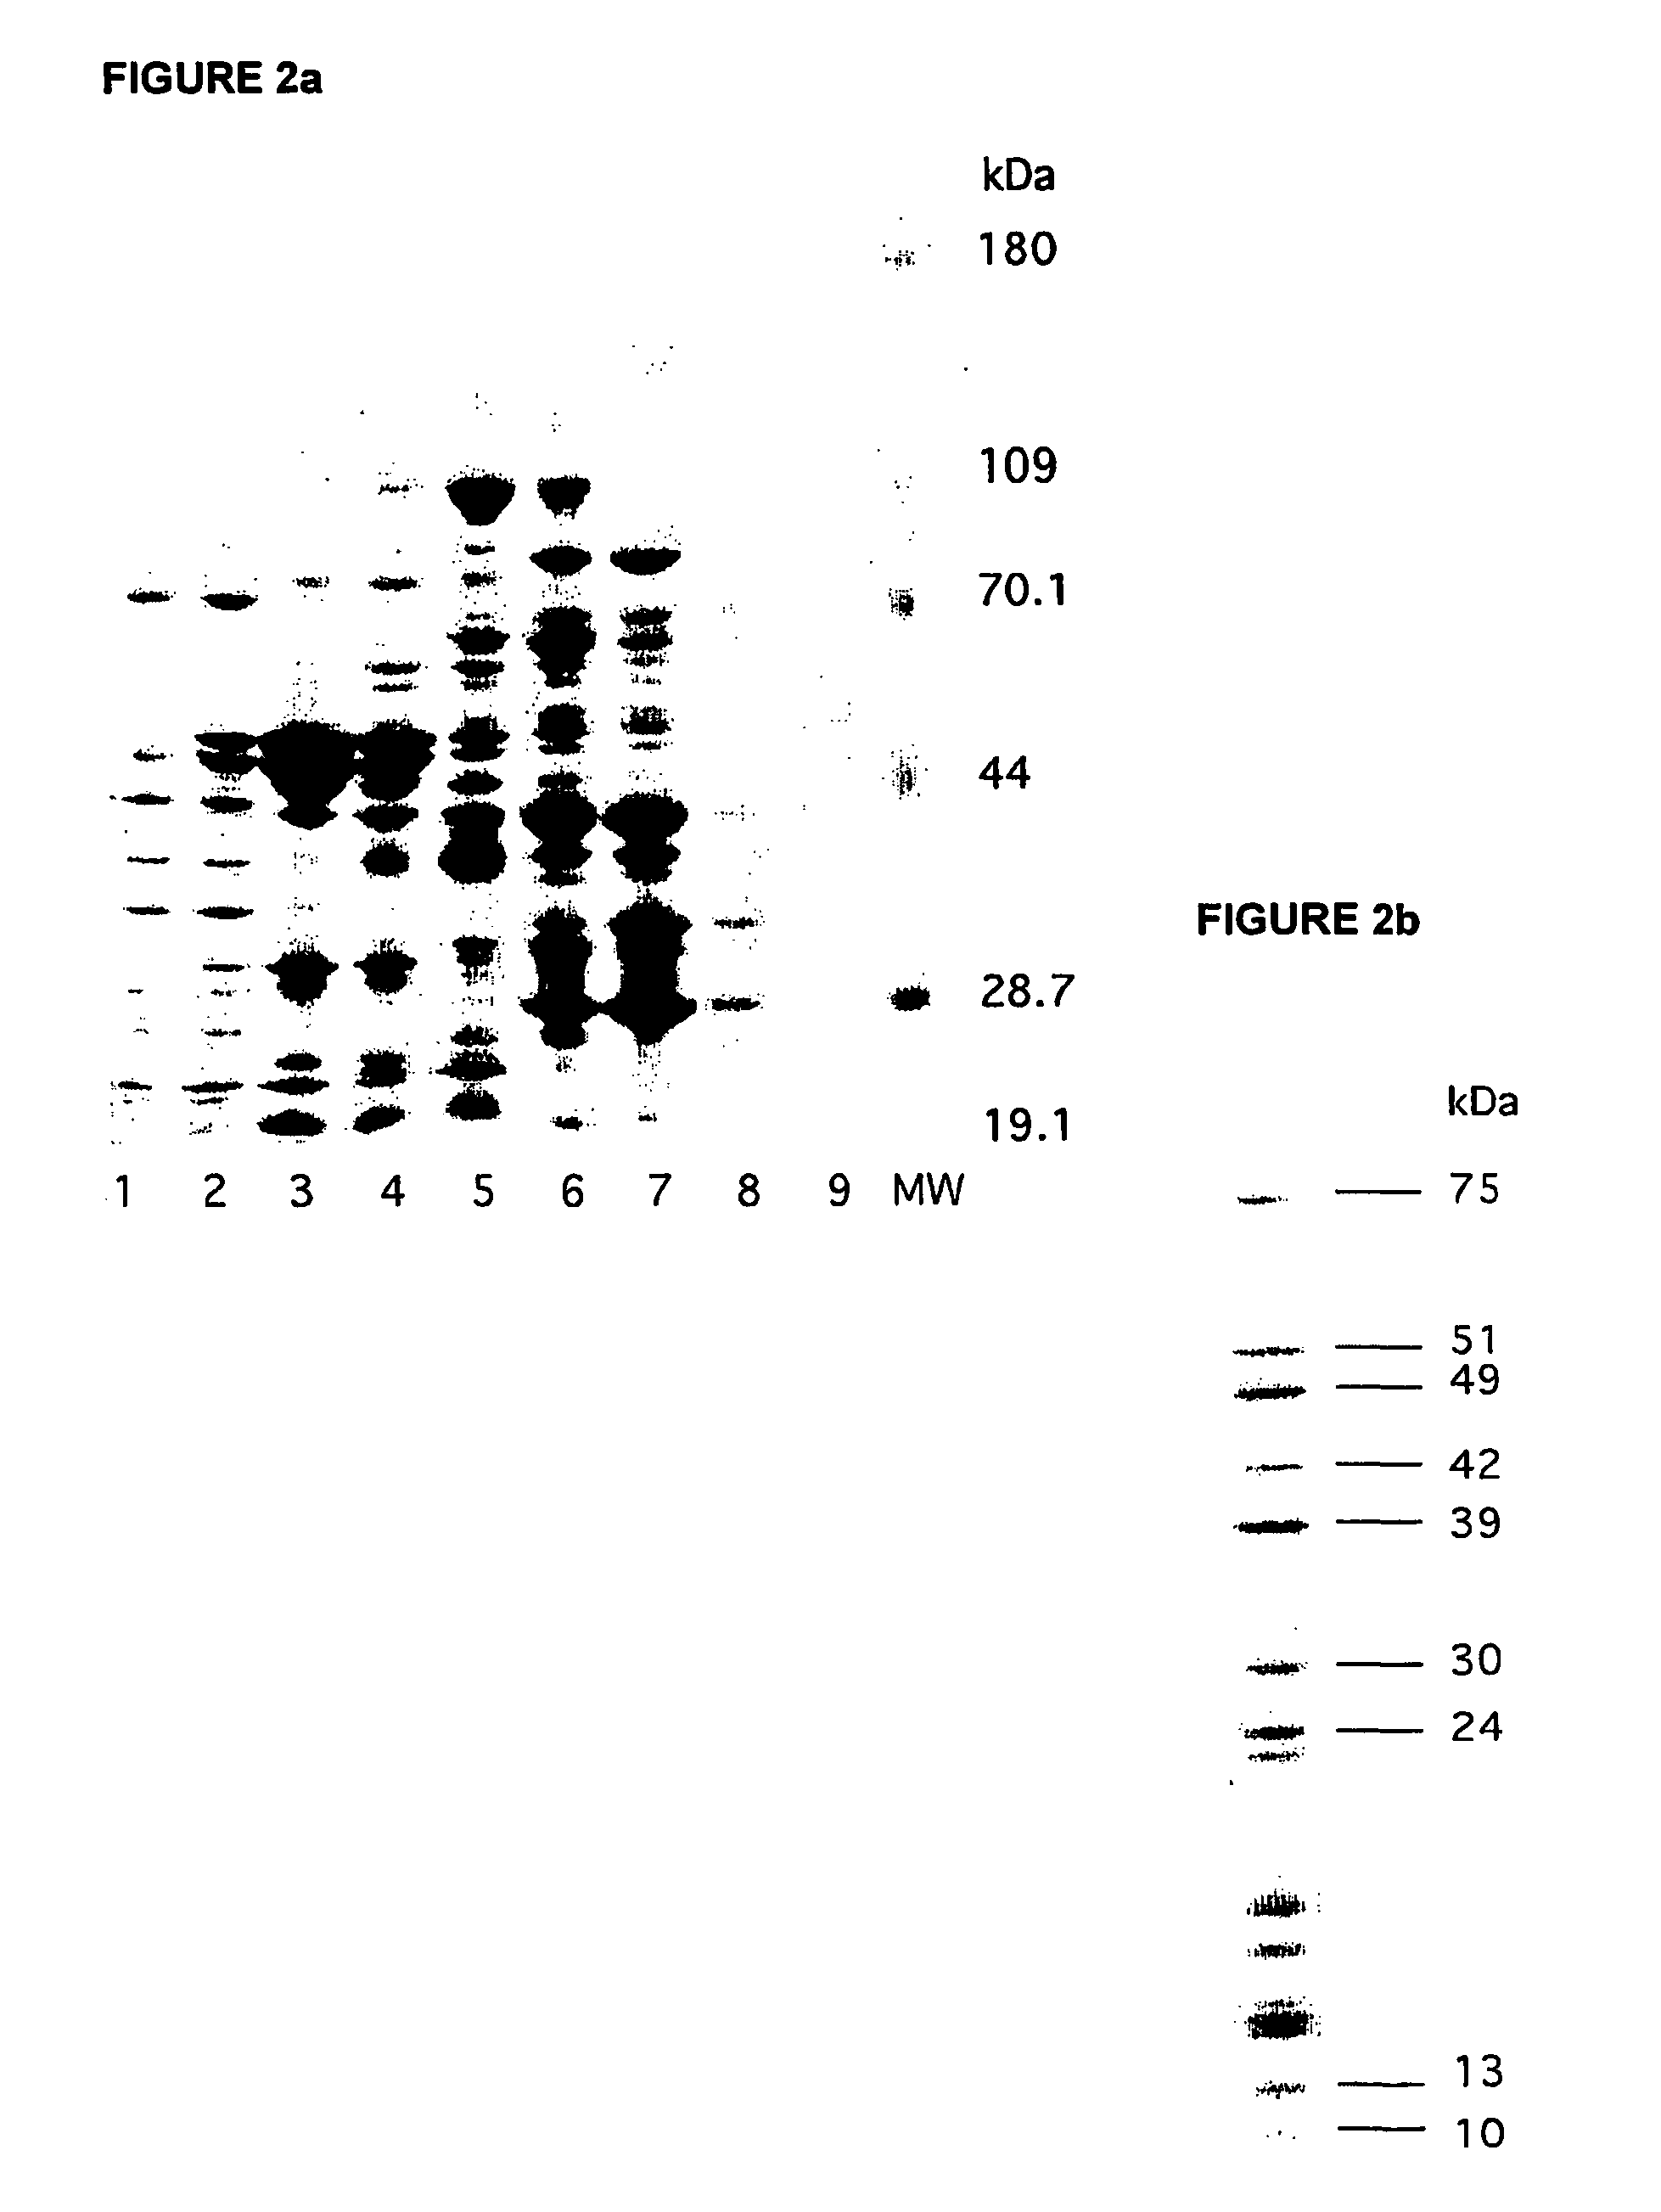
[0110] For SDS-PAGE analysis, 10-20 .mu.l of each fraction was loaded per lane. The composition of fractions after SDS-PAGE and subsequent staining with SyproRuby.TM. protein gel stain is shown in FIG. 1.

[0111] Results

[0112] There is considerable difference in the overall staining pattern between the three different tissue samples, but this is to be expected for several reasons. First, heart tissue is rich in mitochondria and the mitochondria are easily pur...


PUM

PropertyMeasurementUnit
Sizeaaaaaaaaaa
Electric chargeaaaaaaaaaa
Interactionaaaaaaaaaa

Abstract

Methods for enhancing separation and analysis of biological molecules, particularly proteins, and for characterizing tissue, cell, and subcellular (e.g., organelle) expressed protein profiles (proteomes or protein fingerprints) are disclosed. Multi-dimensional diagrams that illustrate the characteristics of the proteins in a sample, based at least in part on interactions between proteins in the system can be produced. In certain embodiments, the diagrams are three-dimensional and incorporate information on protein-protein interactions, protein charge, and protein size for substantially all of the protein species in the sample. Also described are methods of using the provided multi-dimensional diagrams to detect changes in biological systems that are for instance due to disease, drug treatment, environmental condition, and so forth. Methods are provided for correlating changes in three-dimensional proteomic diagrams to disease diagnosis and prognosis, toxicology, therapeutic compound (e.g., drug or hormone) efficacy and mode of action, and drug design.

Description

FIELD[0002] This disclosure relates to the field of proteomics, and particularly to enhanced protein separation techniques useful in the study of proteomes.[0003] The mitochondrion is one of the most complex as well as one of the most important organelles in a eukaryotic cell. It consists of multiple compartments (Frey and Mannella, TIBS, 25:319-324, 2000; Perkins et al., J. Bioenerg. Biomembr., 30:431-442, 1998; Perkins et al., J. Struct. Biol., 119:260-272, 1997) containing a vast number of proteins which must somehow be arranged to carry out a variety of processes fundamental to cell function. These processes include heme synthesis, the TCA cycle, .beta.-oxidation of fatty acids, the urea cycle, electron transport, and oxidative phosphorylation. Electron transport and oxidative phosphorylation alone require the coordinated action of five enzyme complexes, which together are comprised of an estimated 86 different structural proteins (Saraste, Science, 283:1488-1493, 1999). In addi...

Claims


Application Information

Patent Timeline
IPC IPC(8): C07K1/00C07K1/28C07K1/36C40B30/04G01N33/68
CPCC07K1/00C07K1/285G01N33/6803C07K2299/00C40B30/04C07K1/36
Inventor CAPALDI, RODERICK APATTON, WAYNE F
Owner STATE OF OREGON ACTING BY & THROUGH THE OREGON STATE BOARD OF HIGHER EDUCATION ON BEHALF OF THE OREGON HEALTH SCI UNIV
Why Eureka
Try Eureka