

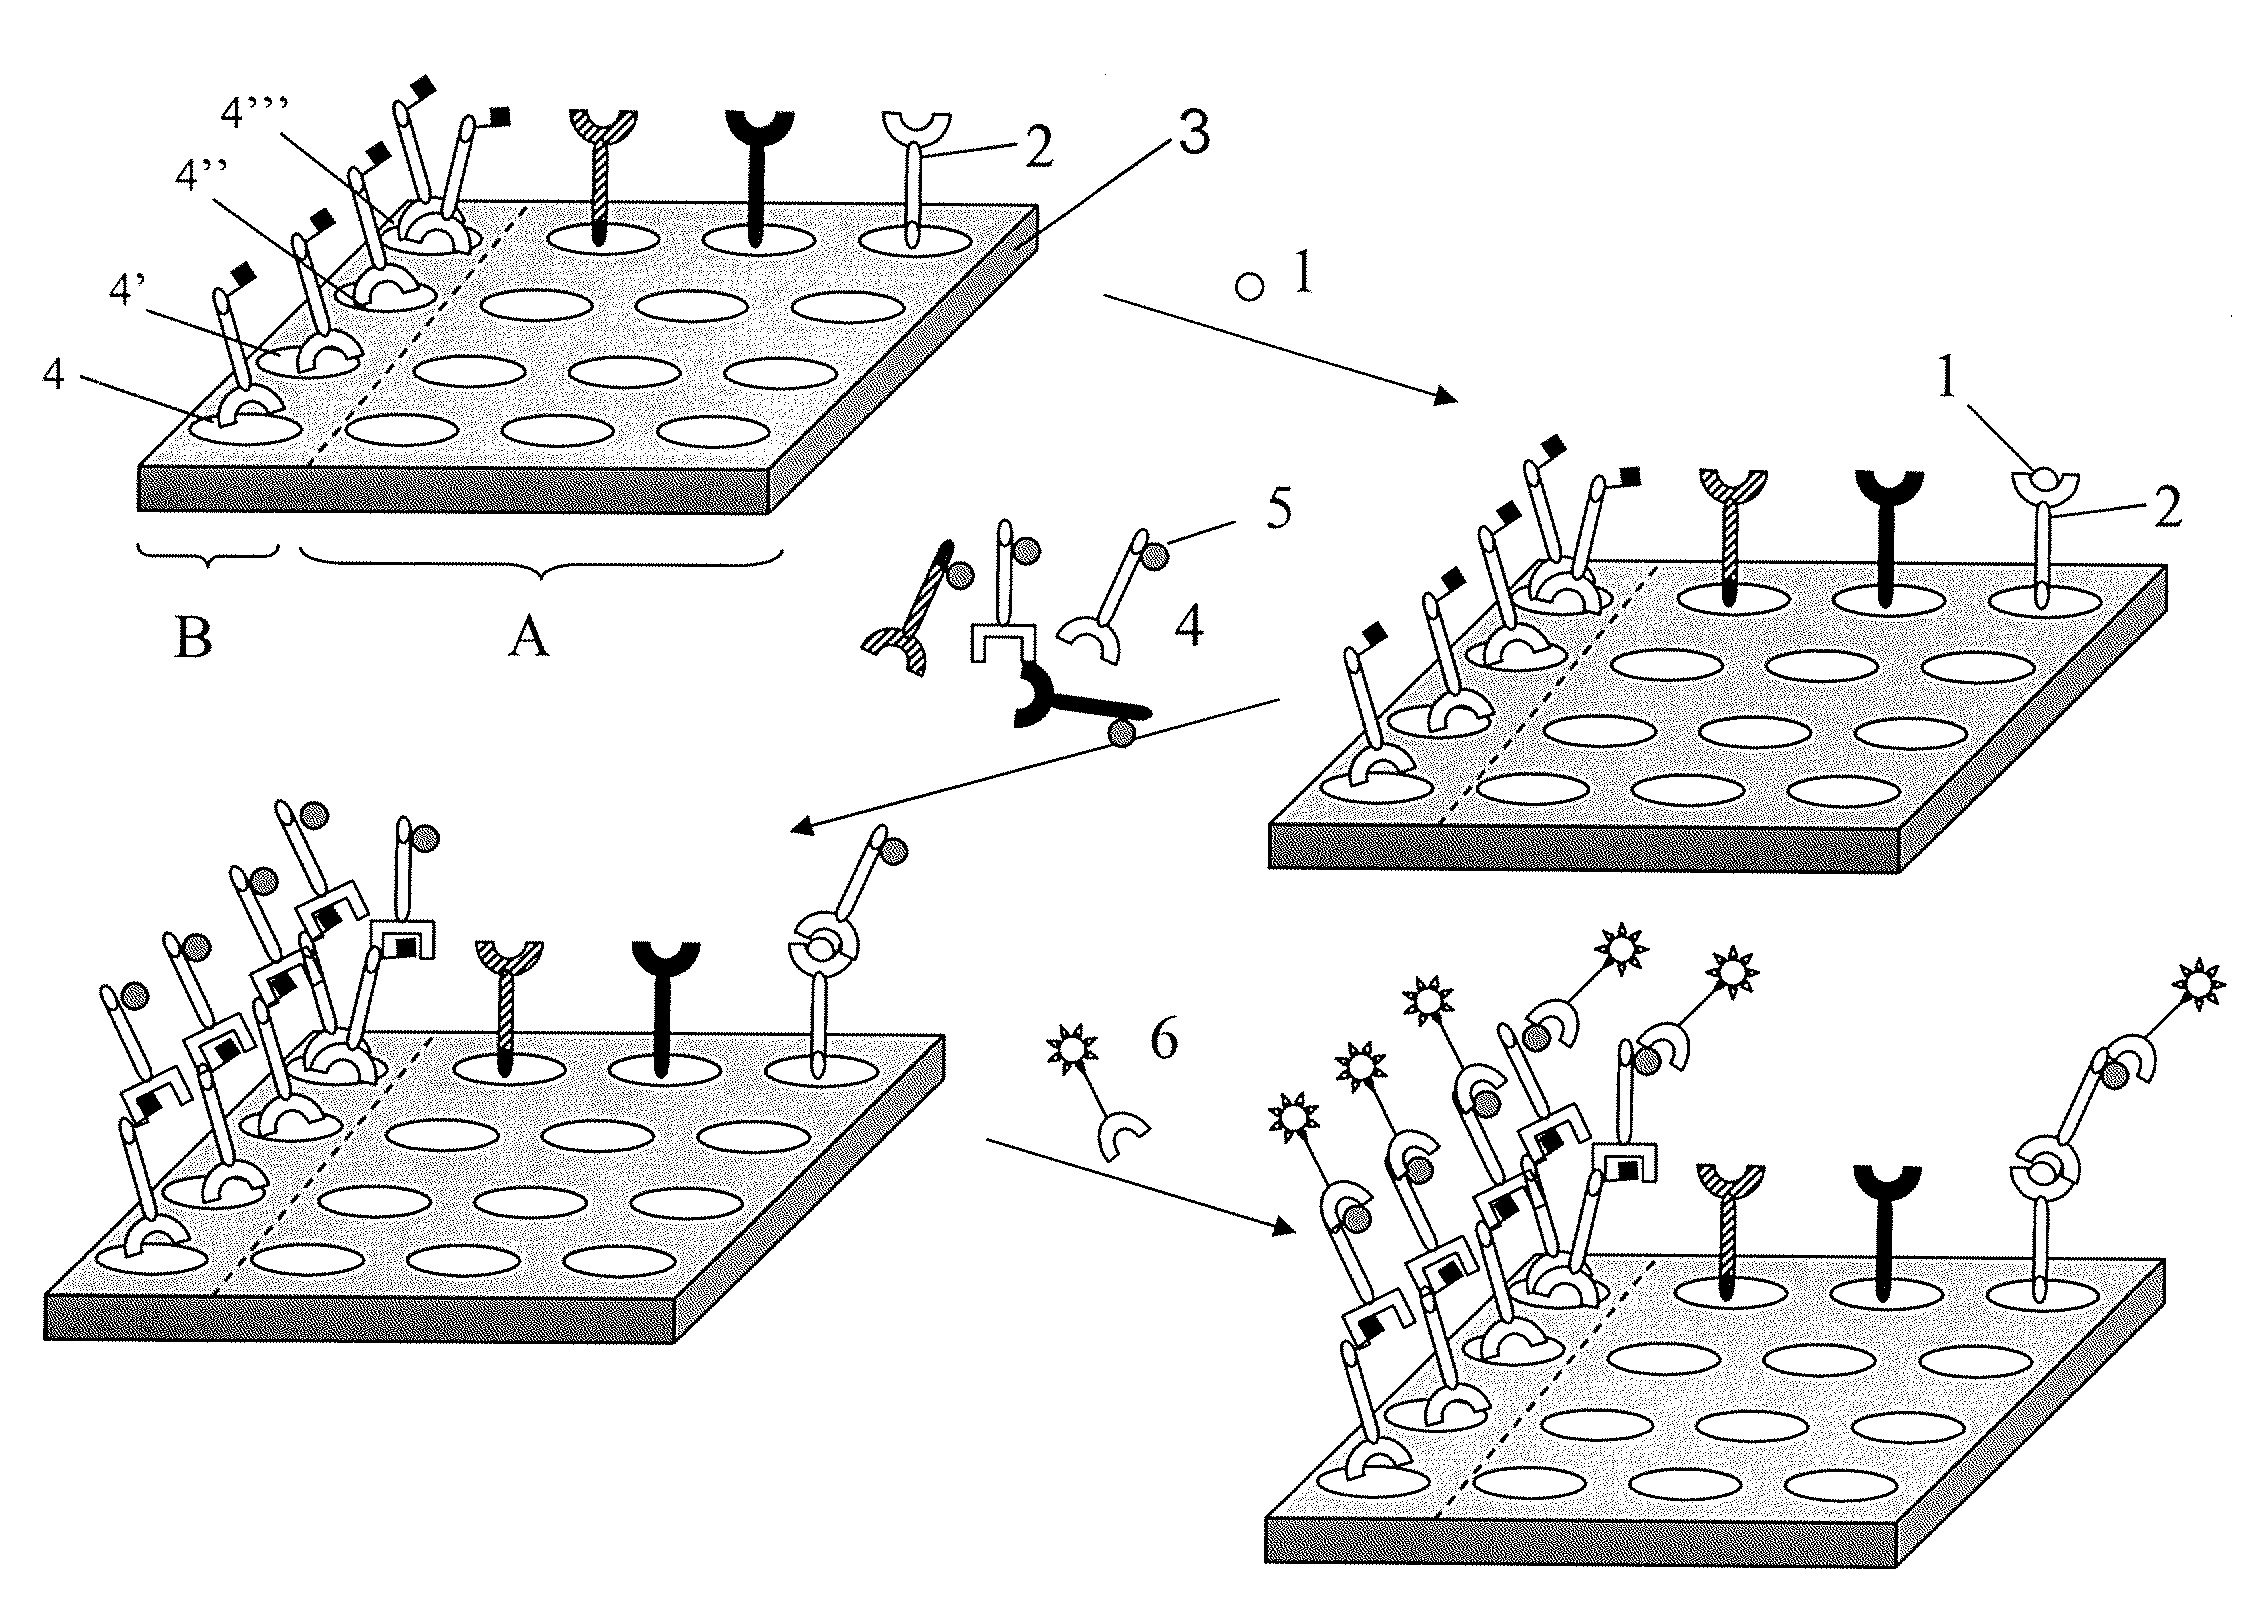
Method and system for quantification of a target compound obtained from a biological sample upon chips
a target compound and chip technology, applied in biochemistry apparatus and processes, instruments, library screening, etc., can solve the problems of insufficient incorporation of labeled nucleotides, limited methods for their detection, and low sensitivity of methods
- Summary
- Abstract
- Description
- Claims
- Application Information
AI Technical Summary
Benefits of technology
Problems solved by technology
Method used
Image

Examples
example 1
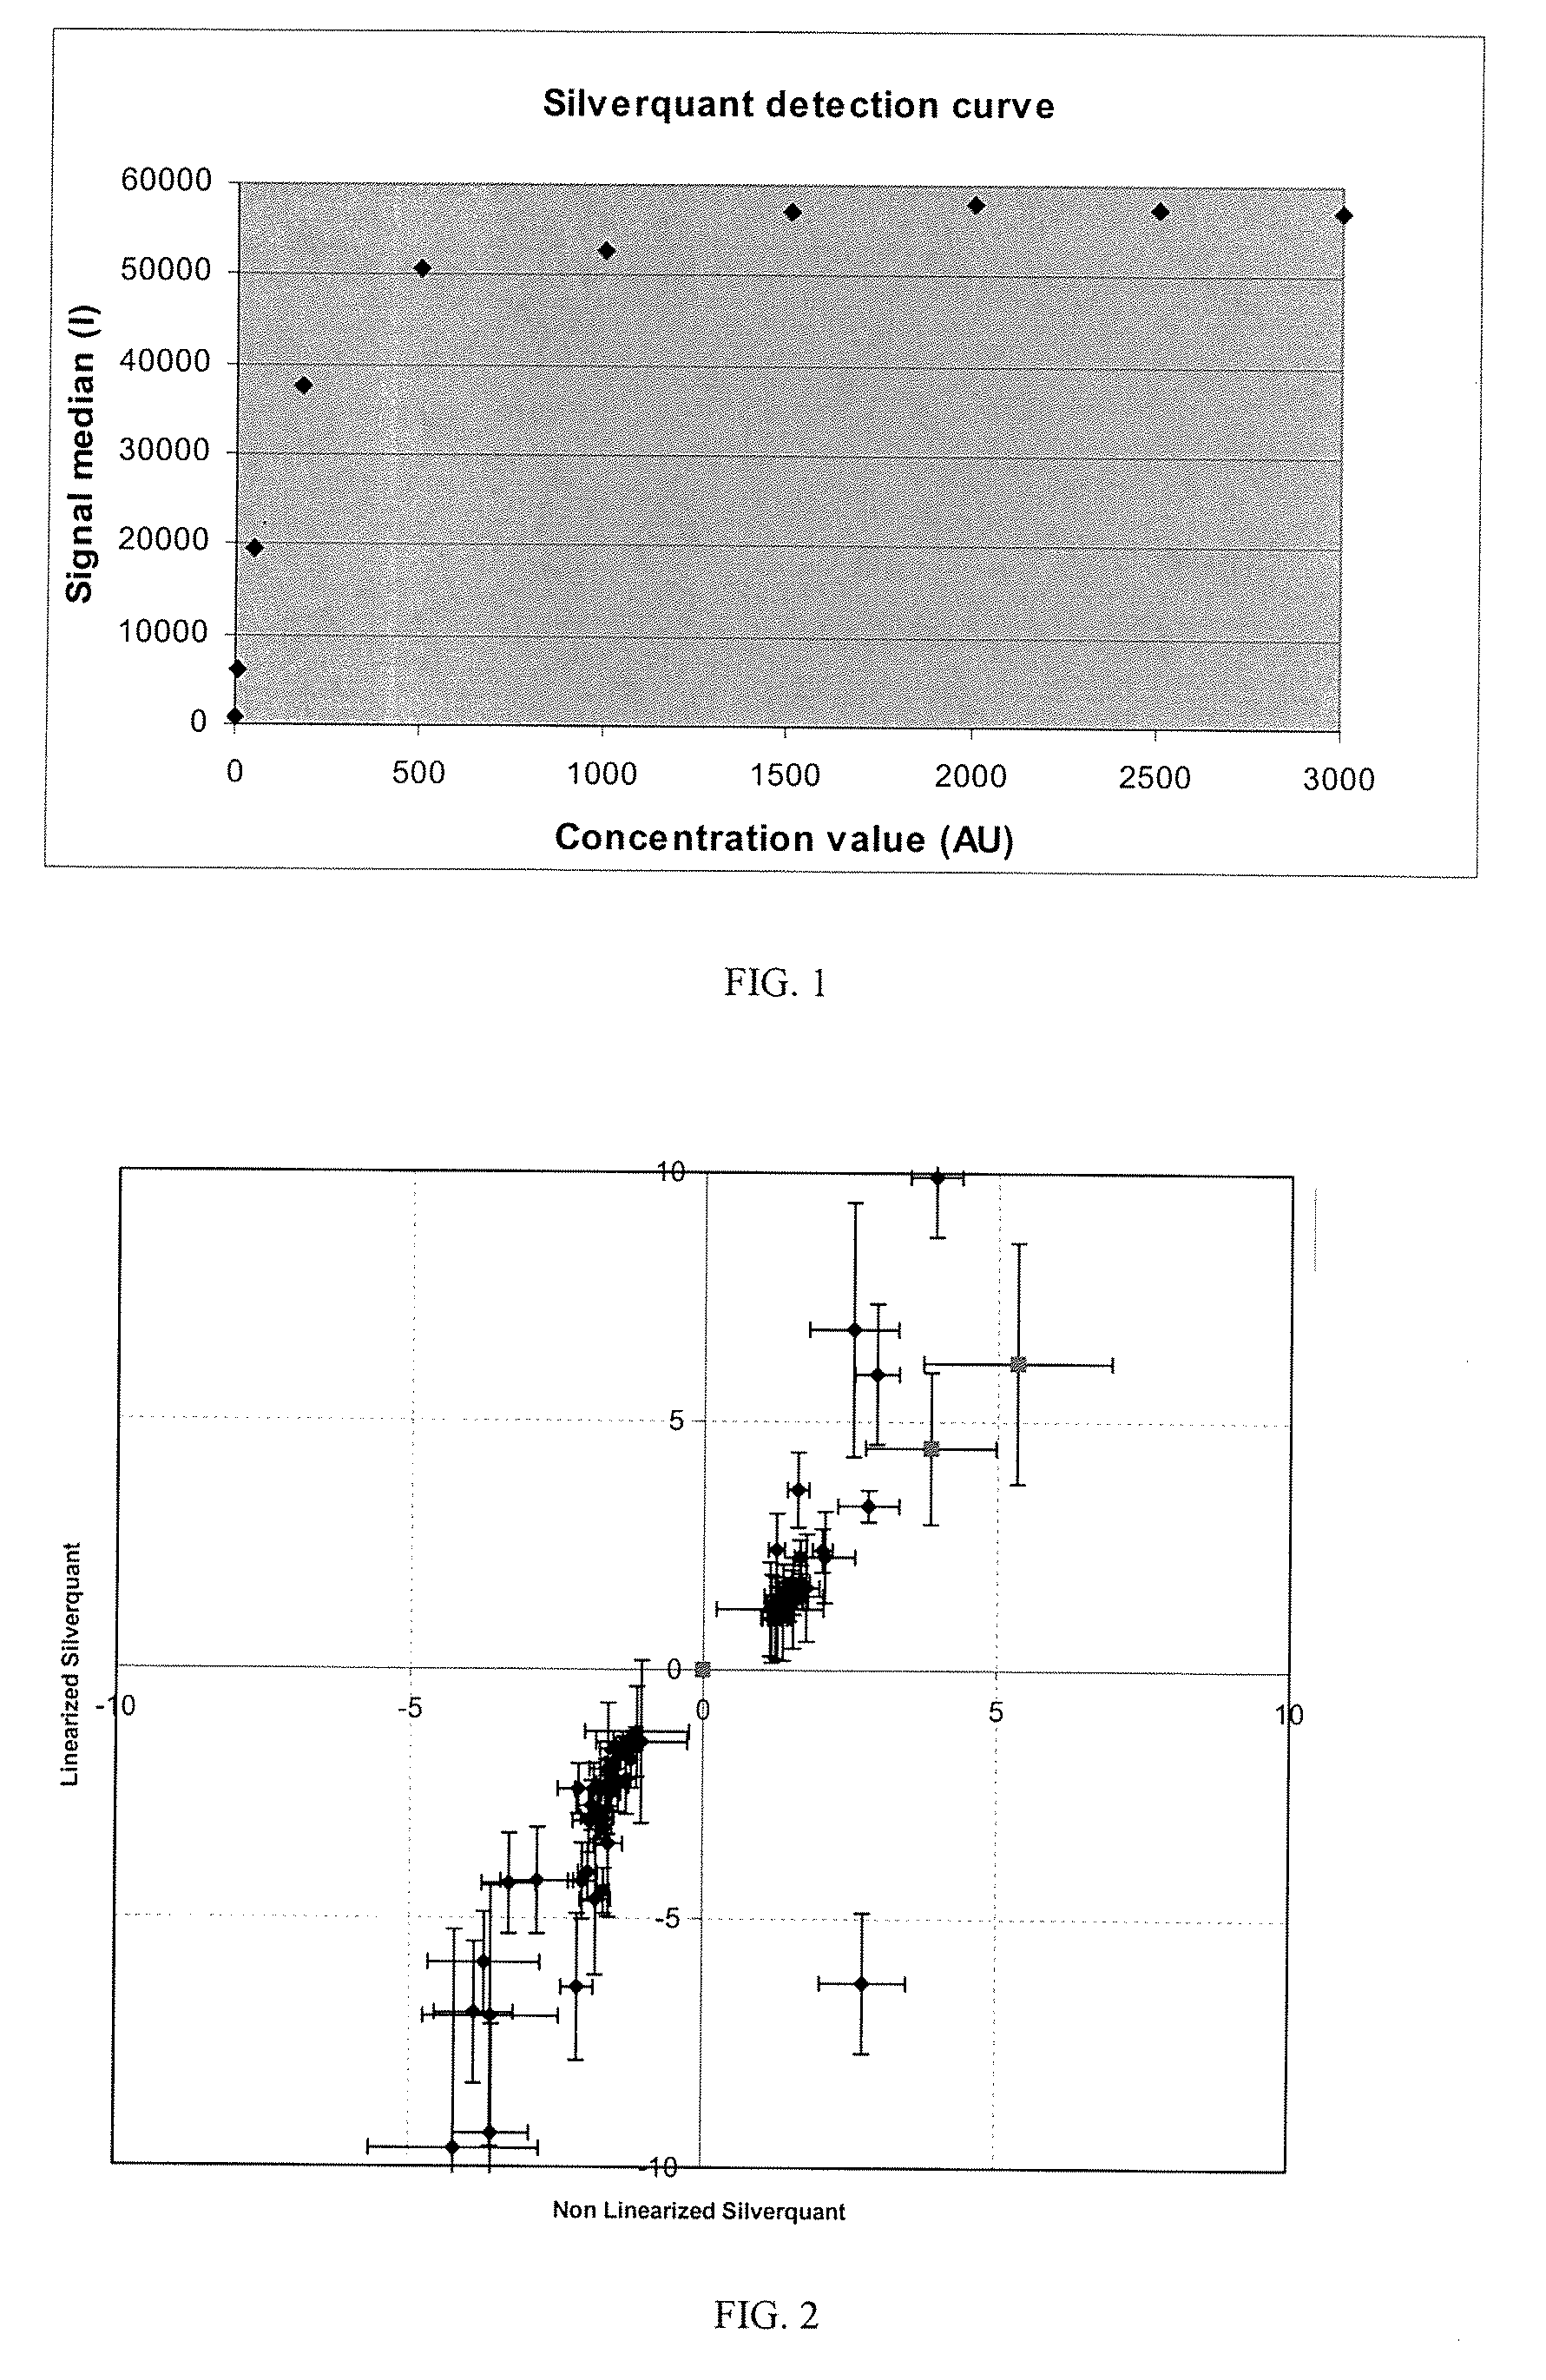
Quantification of Gene Expression on Arrays with Silverquant® Labeling and Conversion Using the Detection Curve
Total RNA Samples
[0138]Total RNA of two human tissues (liver and small intestine) were purchased from Ambion®. In order to assess the integrity, analysis of these samples was carried out by capillarity electrophoresis using on Agilent® 2100 BioAnalyser® (Agilent).
Gene Expression Analysis on DualChip
[0139]For this study, the Eppendorf DualChip® human hepato version 1.0 was chosen. Each DualChip® human hepato consists of two microarrays on one slide that has already been covered with a hybridization frame.
[0140]The DualChip® human hepato contained 151 capture probes specific for 151 human genes.
Synthesis of Labeled Target cDNA
[0141]RNA from human small intestine was used as the test sample and RNA from human liver was used as the reference sample. 10 μg of total RNA from human small intestine or human liver (1 μg / μl, Ambion) were mixed with 1 μl oligo dT Primer (1.5 μg / μl, Ep...
example 2
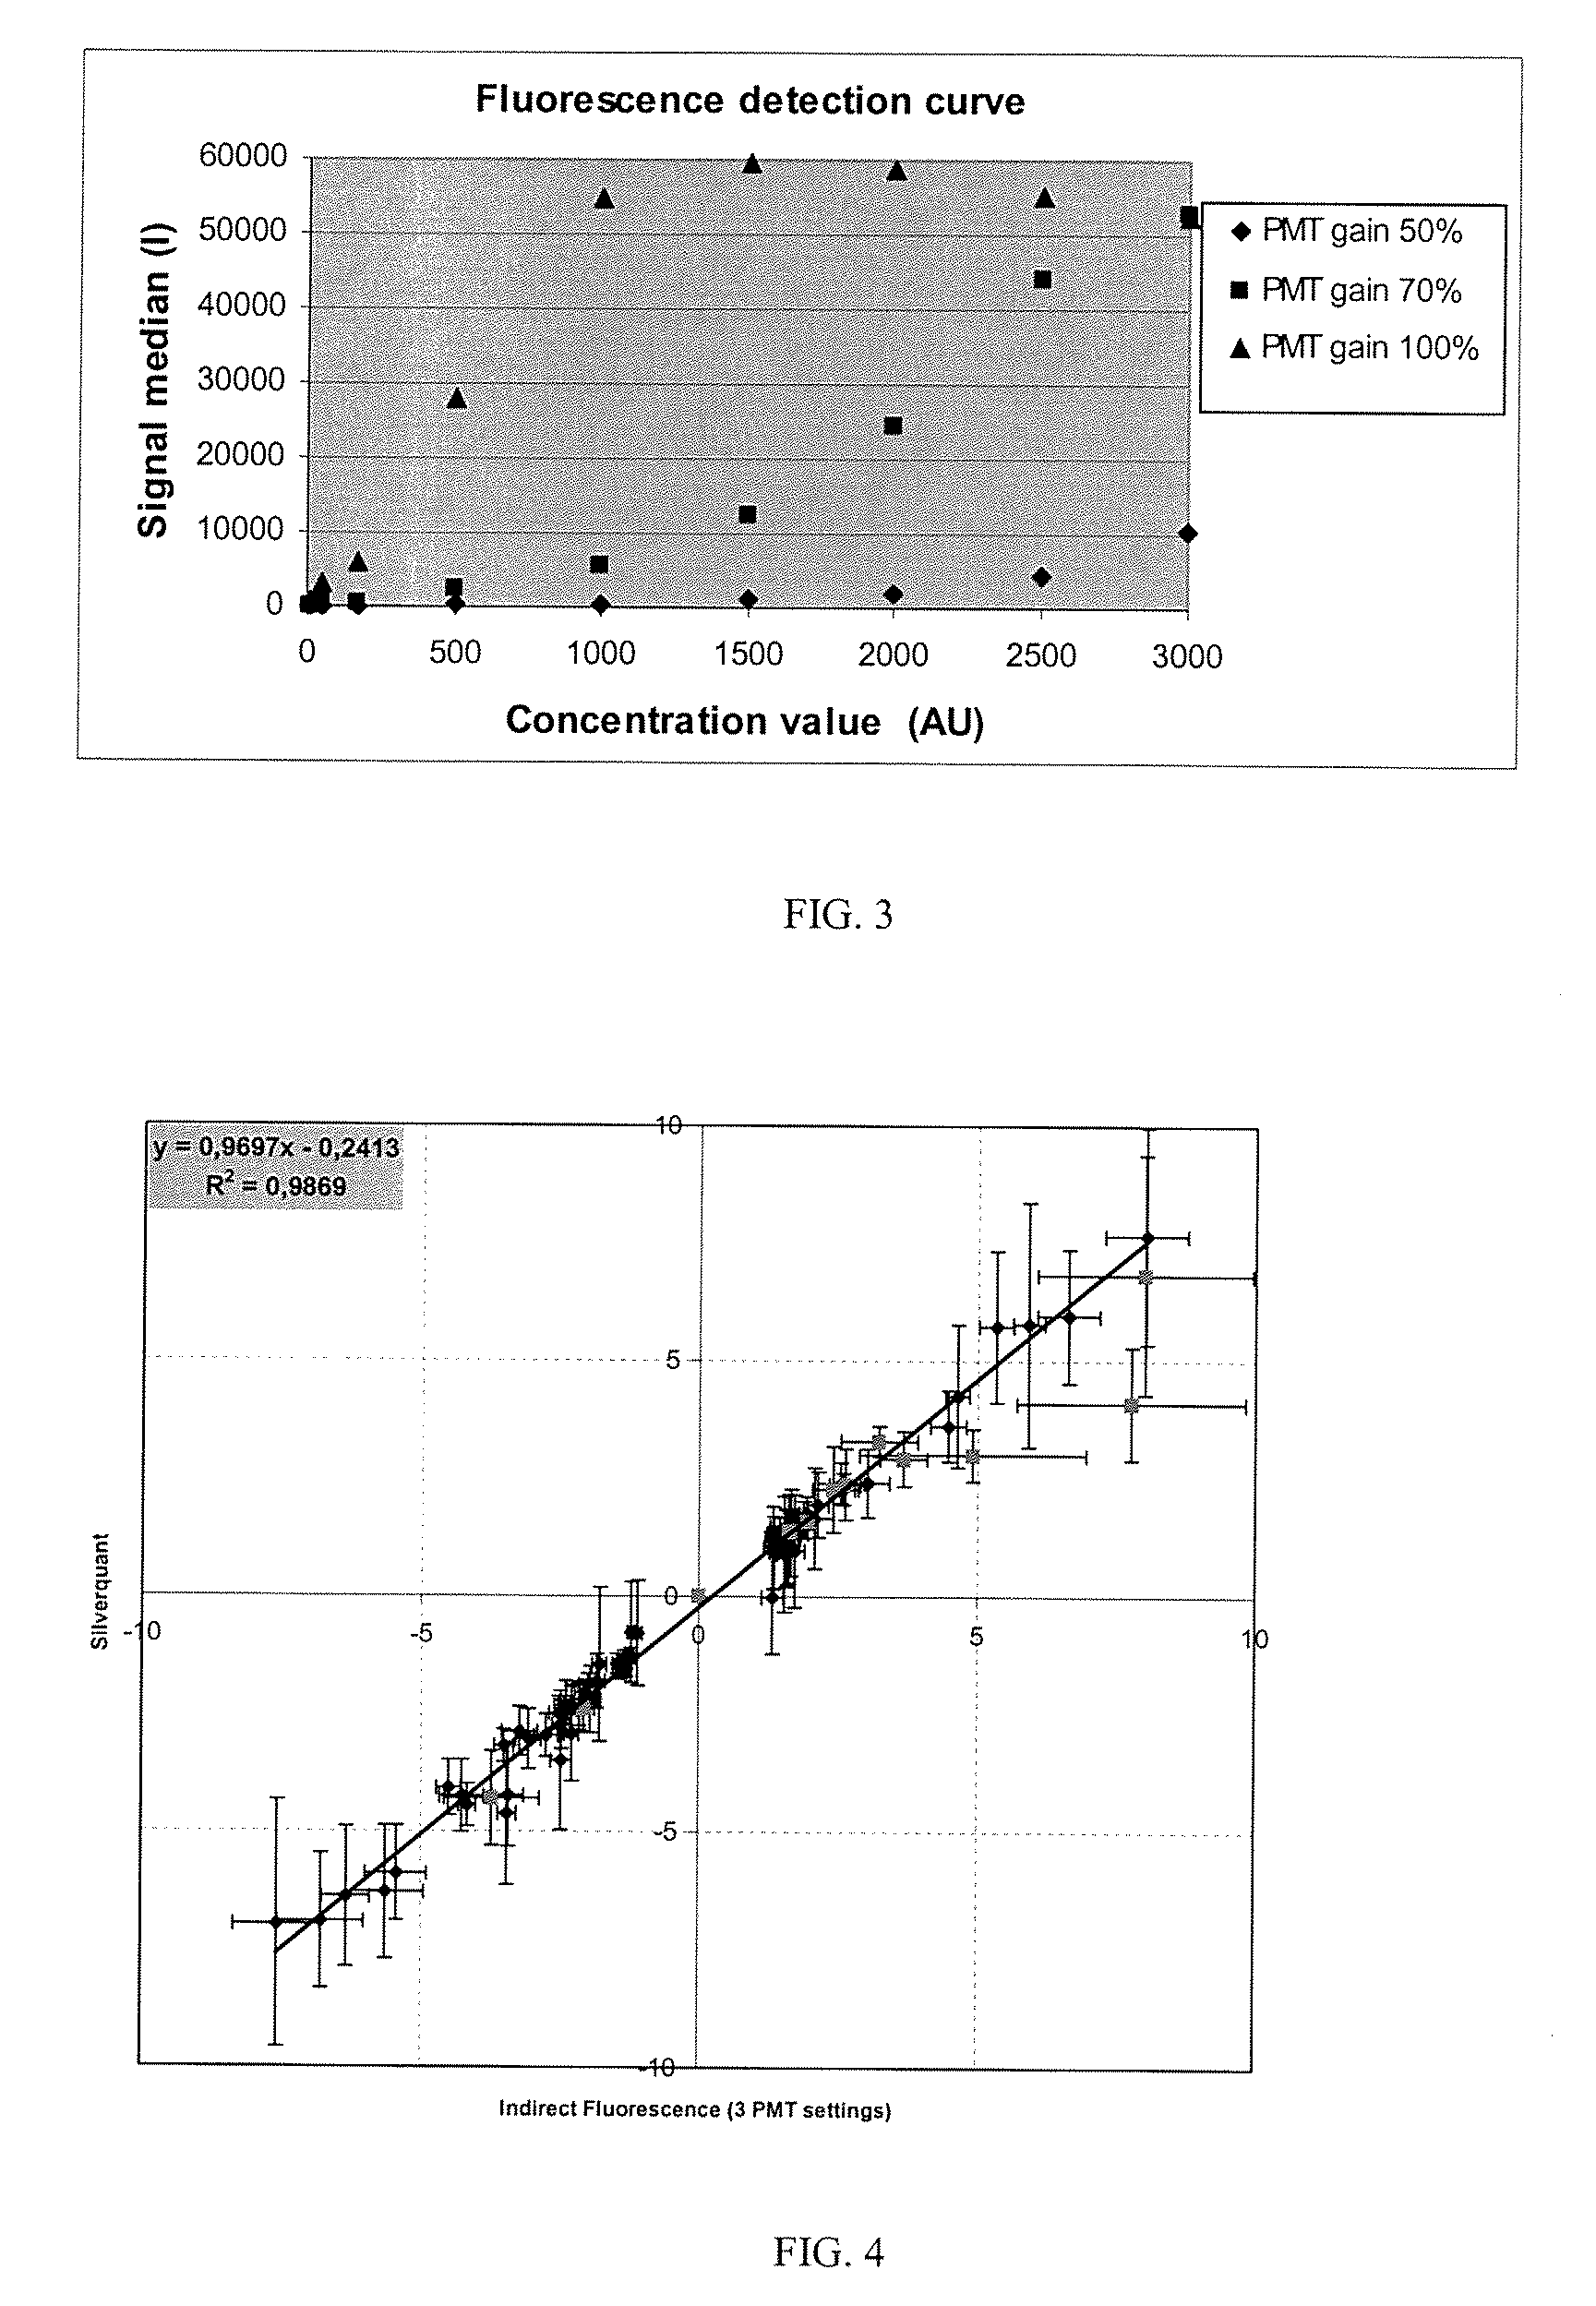
Quantification of Gene Expression on Arrays with Fluorescence Labeling and Comparison with Silverquant® Labeling (and Conversion Using the Detection Curve)
[0166]The same experiment described in example 1 was conducted, where calorimetric detection was replaced with fluorescence detection. Fluorescence detection, which uses a Cy3-labeled anti-biotin conjugated antibody, was used.
Fluorescence Detection
[0167]The micro-arrays were incubated for 45 min at room temperature with the Cy3-conjugated IgG Anti biotin (Jackson Immuno Research laboratories, Inc #200-162-096) diluted 1 / 1000×Conjugate-Cy3 in the blocking reagent. The micro-arrays were washed 4 times for 2 minutes with Washing buffer and 2 times for 2 minutes with distilled water before being dried.
Scanning and Quantification
[0168]The hybridized micro-arrays were scanned using a confocal laser scanner ScanArray® 4000XL (PerkinElmer Life Science, USA) at a resolution of 10 μm. To maximize the dynamic range of the assay the same arra...
example 3
Fluorescence Detection of Interleukin-12 Protein on Microarray with or without Correction by the Detection Curve
[0174]The experiment was performed using the SignalChip Human Cytokine kit (Eppendorf, Germany) suitable for the detection of 20 cytokines of human origin (IL-1α, IL-1β, IL-1ra, IL-2, IL-4, IL-6, IL-8, IL-10, IL-12p40, IL-12p70, IL-17, TNFα, TNF-RI, TNF-RII, IFNγ, GM-CSF, Eotaxin, MIP-1α, MIP-1β, Rantes).
[0175]Each slide contains 8 identical arrays comprising triplicate spots of capture antibodies for each cytokine to be detected (capture probes) and triplicate spots of 13 different concentrations of a control antibody irrelevant to the cytokine field (detection molecule), ranging from 0.025 to 50 μg / ml: 0.025, 0.050, 0.075, 0.10, 0.35, 0.70, 1, 3.5, 7, 10, 15, 20 and 50 μg / ml. These concentrations are equivalent to the following arbitrary units concentrations (AU): 25, 50, 75, 100, 350, 700, 1000, 3500, 7000, 10000, 15000, 20000 and 50000.
[0176]A detection curve is constr...
PUM
| Property | Measurement | Unit |
|---|---|---|
| Length | aaaaa | aaaaa |
| Concentration | aaaaa | aaaaa |
| Length | aaaaa | aaaaa |
Abstract
Description
Claims
Application Information