
Apparatus and method for determining analyte content in a fluid

a fluid and fluid technology, applied in the direction of optical radiation measurement, instruments, spectrometry/spectrophotometry/monochromators, etc., can solve the problems of gc-fid being extremely time-consuming and laborious, affecting the accuracy of fluid content determination, so as to achieve effective retention of accurate and reliable samples

Active Publication Date: 2009-07-09
ORONO SPECTRAL SOLUTIONS
View PDF24 Cites 14 Cited by
  • Summary
  • Abstract
  • Description
  • Claims
  • Application Information

AI Technical Summary

Benefits of technology

[0020]It is an object of the present invention to provide a commercially suitable apparatus and related method to detect analytes in fluids. It is also an object of the present invention to provide an apparatus and method for analyte determination that effectively retains accurate and reliable samples of the analyte for evaluation using known evaluation tools.
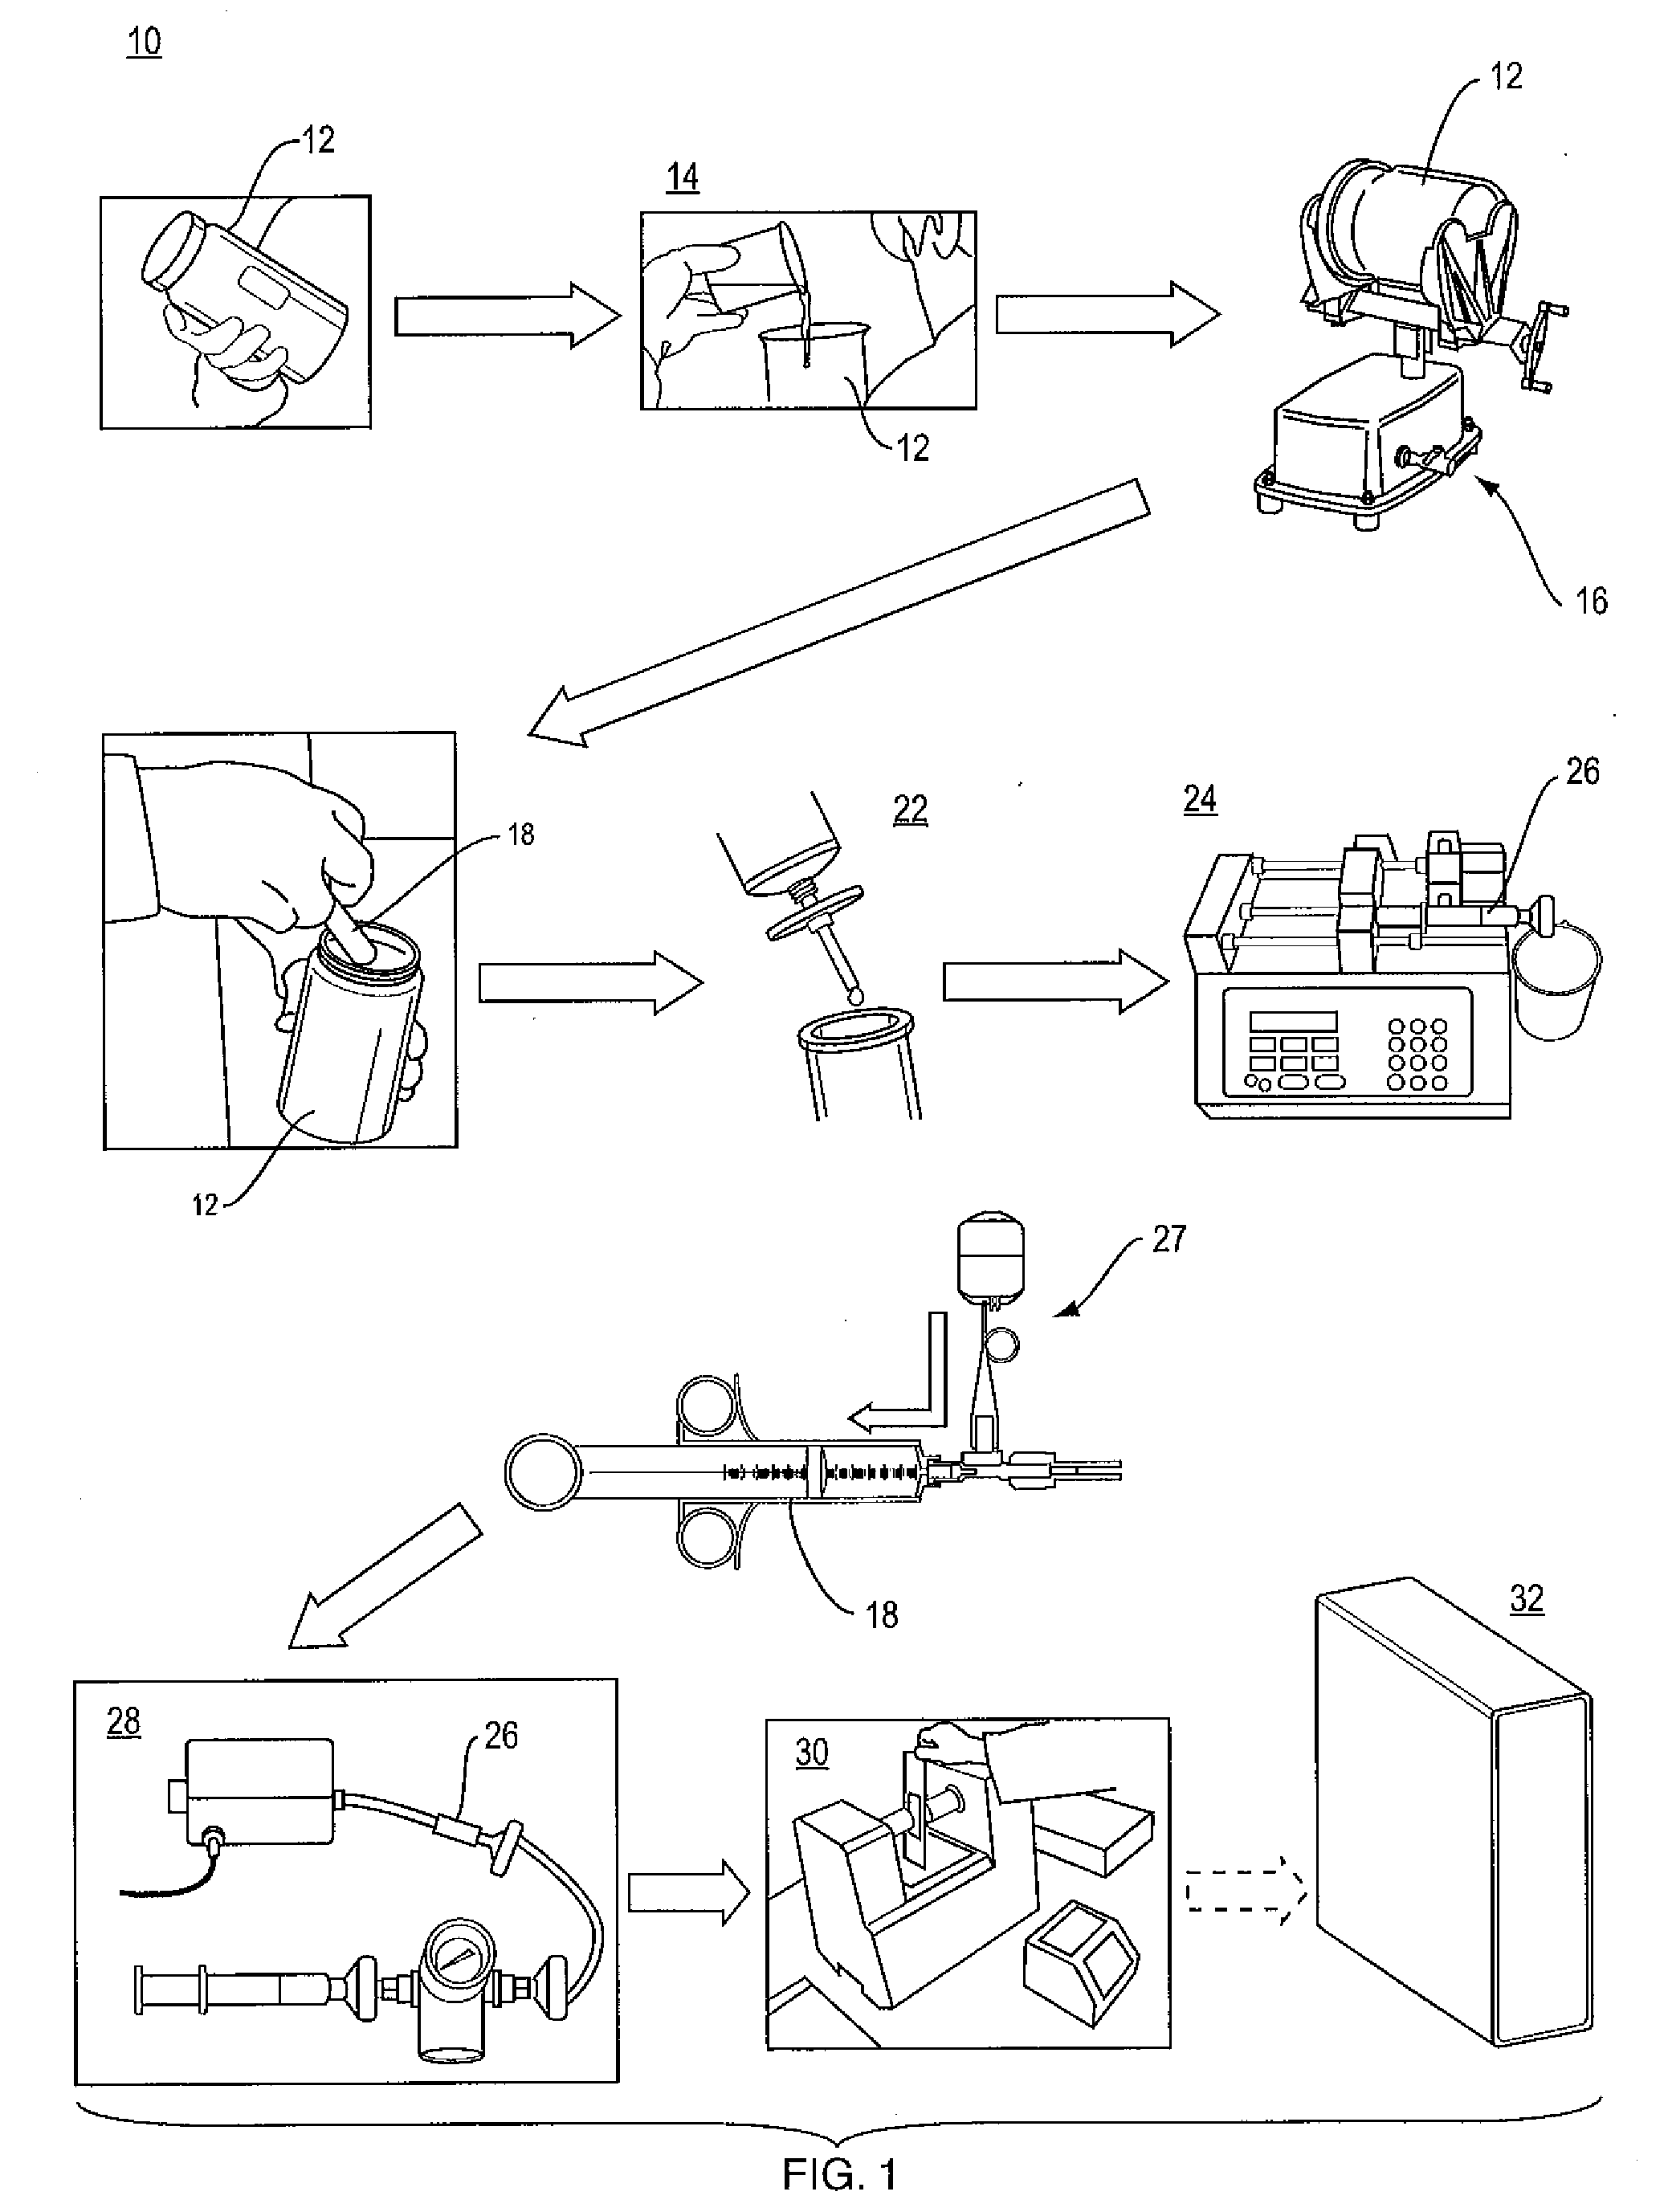
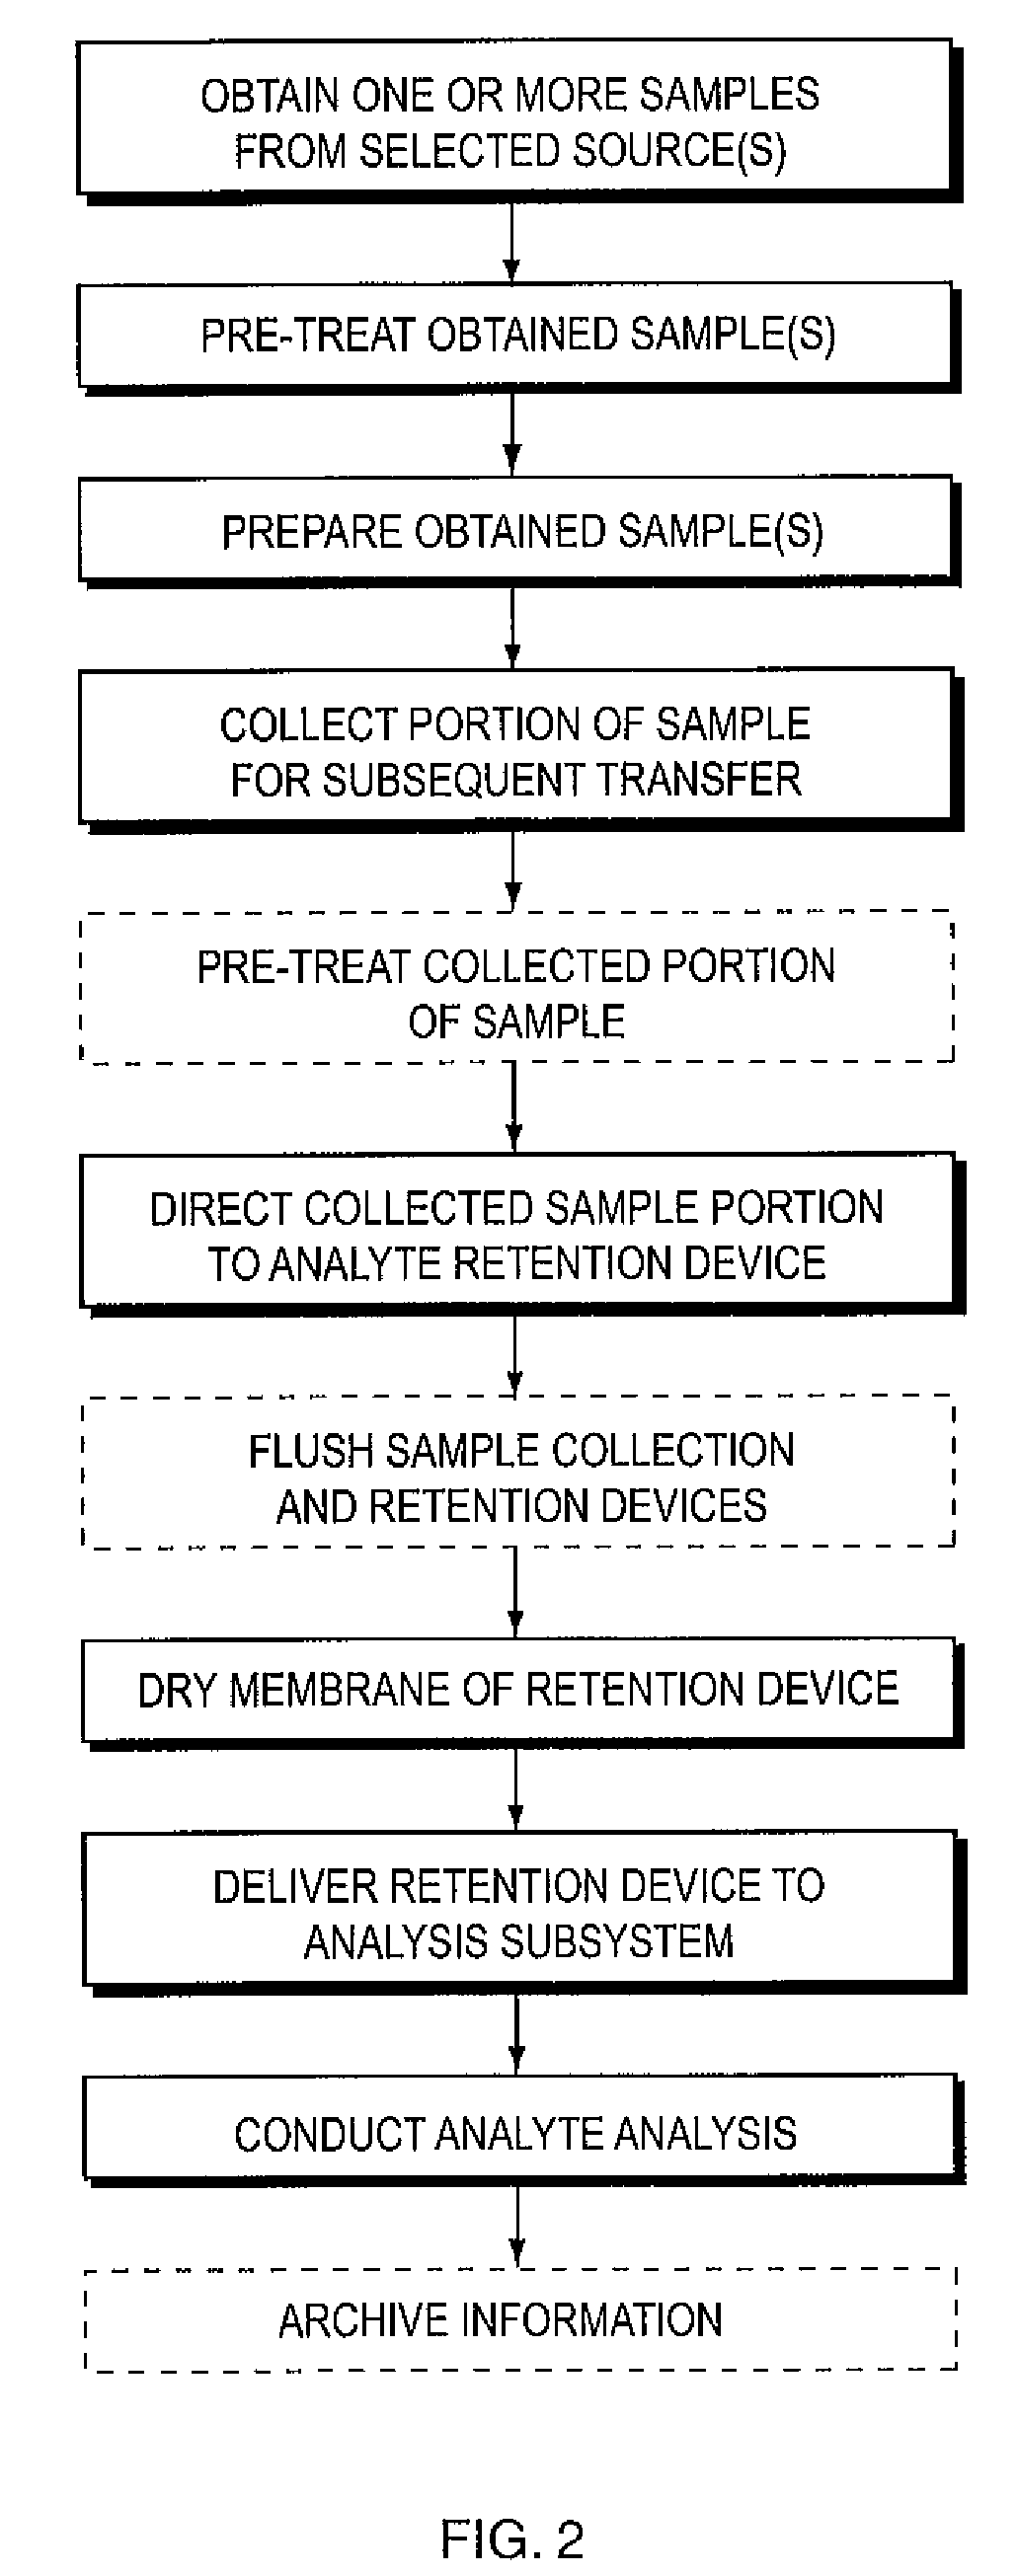
[0025]The present invention is an analyte determination apparatus and related method having the following characteristics: 1) accuracy; 2) minimal processing time to minimize sample compromise due to separation, oxidation, etc.; 3) a system designed to minimize sample degradation and contamination, for example; 4) ability to handle real world particulates, biologics, metals, salts and other interferents; 5) scalable for automationsystem components can be designed and packaged to support on-line and / or off-line automated sampling and analyses; 6) ability to handle a wide dynamic range of analytes—the apparatus operates on the principle of mass loading, as a result, variable sample volumes can be accurately passed through it; and 7) efficient extraction to capture the analyte of interest.

Problems solved by technology

However, GC-FID is extremely time consuming and labor intensive, requiring up to an estimated 6 hrs per measurement and many more for periodic recalibrations.
This method is also labor intensive and the measurement takes a long time.
It must be ensured that there is no water present and all the hexane is evaporated, as the presence of either will result in over-reporting the TPHI / TOG content of the sample.
While EPA 1664A reduces the amount of solvent required and the time to perform the test, it cannot be used on certain samples due to clogging issues and does still require significant solvent use (about 200 ml of hexane per test) and time (about 1.5 hrs for most samples).
This issue is a significant drawback when performing measurements for regulatory compliance, which generally require the measurement of all the polluting components of the aqueous sample of interest, and when unknown oil contaminant streams are encountered.
However, problems are encountered with gas bubbles and solid particles also scattering light, thus leading to overestimating the oil content of the sample.
However, oil and other potential contaminates in the sample will tend to rapidly foul all surfaces, necessitating thorough cleaning after relatively short periods of operation.
Other methods, such as those based on ultrasonic acoustic pulse echo, are unproven and highly complex and thus unlikely to find wide acceptance.
Therefore, the solvent-based systems are generally obsolete in practice.
Some other systems provide for the capture and regeneration of the extraction solvent for reuse, but this is generally considered insufficient environmentally.
Therefore, this technique does not directly measure the oil content, but instead measures a change in a secondary material property (refractive index) of the cladding.
A vacuum filtration method fails to supply sufficient pressures to ensure fluid flow in a timely manner (i.e. <10 minutes) through a membrane due to filter clogging.
This limitation is significant since real-world samples typically contain high levels of metals / metal oxide particles, organic materials, and other paticulates which clog and consequently inhibit fluid flow though the membrane unless sufficiently high differential pressures across the membrane are applied.
Among other things, this can lead to undesirable collector contamination and delays in the analysis process.
These and other limitations of the Romero method as described in the noted reference result in a system that is not adequate for commercialization.
The described method thus is not widely applicable or commercially viable.

Method used


Image

  • Apparatus and method for determining analyte content in a fluid
  • Apparatus and method for determining analyte content in a fluid
  • Apparatus and method for determining analyte content in a fluid

Examples


example 1

[0092]A PTFE membrane of thickness 50 μm, nominal pore size 0.45 μm, and diameter 15 mm was placed over a metal support disk of 0.25 mm pores and 12.7 mm diameter. The excess membrane material was wrapped around to the back of the metal support disk. PTFE washers of 7.1 mm inner diameter, 12.7 mm outer diameter, and 0.75 mm thickness were placed on both sides of the membrane and disk (See FIGS. 4 and 5). Approximately 30 psi. of force is applied by hand to press the washers, membrane and disk together; this is henceforth referred to as the supported membrane unit. The supported membrane unit was placed in a 13 mm infrared window holder (Bruker optics). Transmission Fourier Transform infrared (FTIR) spectroscopy was performed on an ABB FTLA 2000 with a liquid nitrogen cooled mercury-cadmium telluride detector interfaced with a computer. A background spectrum was taken as the average of 50 scans. The supported membrane unit was then placed into a stainless steel filter holder from Adv...

example 2

[0096]The second example was similar to the first example. A supported membrane unit was made from the same materials, a background spectrum taken, and the same filter holder used in the same way. The only difference was that a 2.3 ppm solution of stearic acid in water was tested. Stearic acid was dissolved in methanol and stirred for 20 min. A certain amount of this solution was then added to 1 liter of deionized water and stirred for 20 min to create an even distribution of stearic acid in water. Stearic acid was used as a simulant for Grease. Grease is included in the TOG definition but not TPH.

[0097]The test was performed in the same way as in Example 1. Simply, 10 ml of the stearic acid dispersion in water was syringed through the supported membrane unit and dried in the same manner. However, a small amount of water remained. FIG. 21 shows the results of the test. Stearic acid strongly absorbs at about 1700 cm−1, the carboxyl absorbance region, and in the hydrocarbon absorbance...

example 3

[0098]The third example is generally similar to the first two in that a supported membrane unit was made from the same materials and a background spectrum taken. However, in this example, six different samples of six different fluids from real-world sources were run through the analysis system of the present invention, three times for each. In addition, a standard solvent-based EPA 1664 analysis was performed on the same fluid samples to determine the relationship between the results obtained using the present invention and the current standard for oil-in-water detection. FIG. 22 shows the spectra resulting from test results for four of the samples (excluding the samples from the Gulf of Mexico). Further, as can be seen from the table of FIG. 23, which identifies the sources of the six samples, the averaged results obtained using the present invention closely matched the results using the conventional solvent-based test method, wherein the conventional solvent-based method is identi...


PUM

PropertyMeasurementUnit
timeaaaaaaaaaa
timeaaaaaaaaaa
pore sizeaaaaaaaaaa

Abstract

An apparatus and method to determine analytes in a fluid. One aspect of the present invention is for the determination of the oil content of water using UV, near-IR, IR or Raman spectroscopy or radiometry. In certain embodiments, a solid membrane material absorbs analytes from fluid brought into contact with it. The membrane is subsequently placed in a FTIR spectrometer, which spectrometer is enabled to determine the concentration of analytes in fluid by calibration. Certain embodiments can determine the type of hydrocarbon present, and thus can differentiate Total Petroleum Hydrocarbons (TPH) from Total Oil and Grease (TOG), without any separate sample preparation.

Description

CROSS REFERENCE TO RELATED APPLICATIONS[0001]The present application claims the priority benefit of U.S. provisional application Ser. No. 61 / 020,063 filed Jan. 9, 2008, entitled SOLVENTLESS APPARATUS AND METHOD FOR DETERMINING HYDROCARBON CONTENT IN WATER, of the same named inventors, and U.S. provisional application Ser. No. 61 / 081,620 filed Jul. 17, 2008, entitled SOLVENTLESS APPARATUS AND METHOD FOR DETERMINING HYDROCARBON CONTENT IN WATER AND RELATED ANALYSES, of the same named inventors. The entire contents of both priority applications are incorporated herein by reference.BACKGROUND OF THE INVENTION[0002]1. Field of the Invention[0003]The present invention relates to devices and techniques used to determine the analyte content in a fluid. More particularly, the present invention relates to systems and methods for capturing analytes on a test bed for subsequent analysis in a test device. The present invention is related, but not limited to, devices and methods for determining h...

Claims


Application Information

Patent Timeline
Patent Type & Authority Applications(United States)
IPC IPC(8): G01N33/00G01S3/02G01J3/42
CPCG01N21/78G01N33/1833G01N21/359G01N21/3577G01N2021/3595
Inventor MARTIN, TYLER P.DOUCETTE, LUKESMITH, DEAN J.SCHWARZ, THOMAS P.
Owner ORONO SPECTRAL SOLUTIONS
Learn More