Classification of Biological Samples Using Spectroscopic Analysis
- Summary
- Abstract
- Description
- Claims
- Application Information
AI Technical Summary
Benefits of technology
Problems solved by technology
Method used
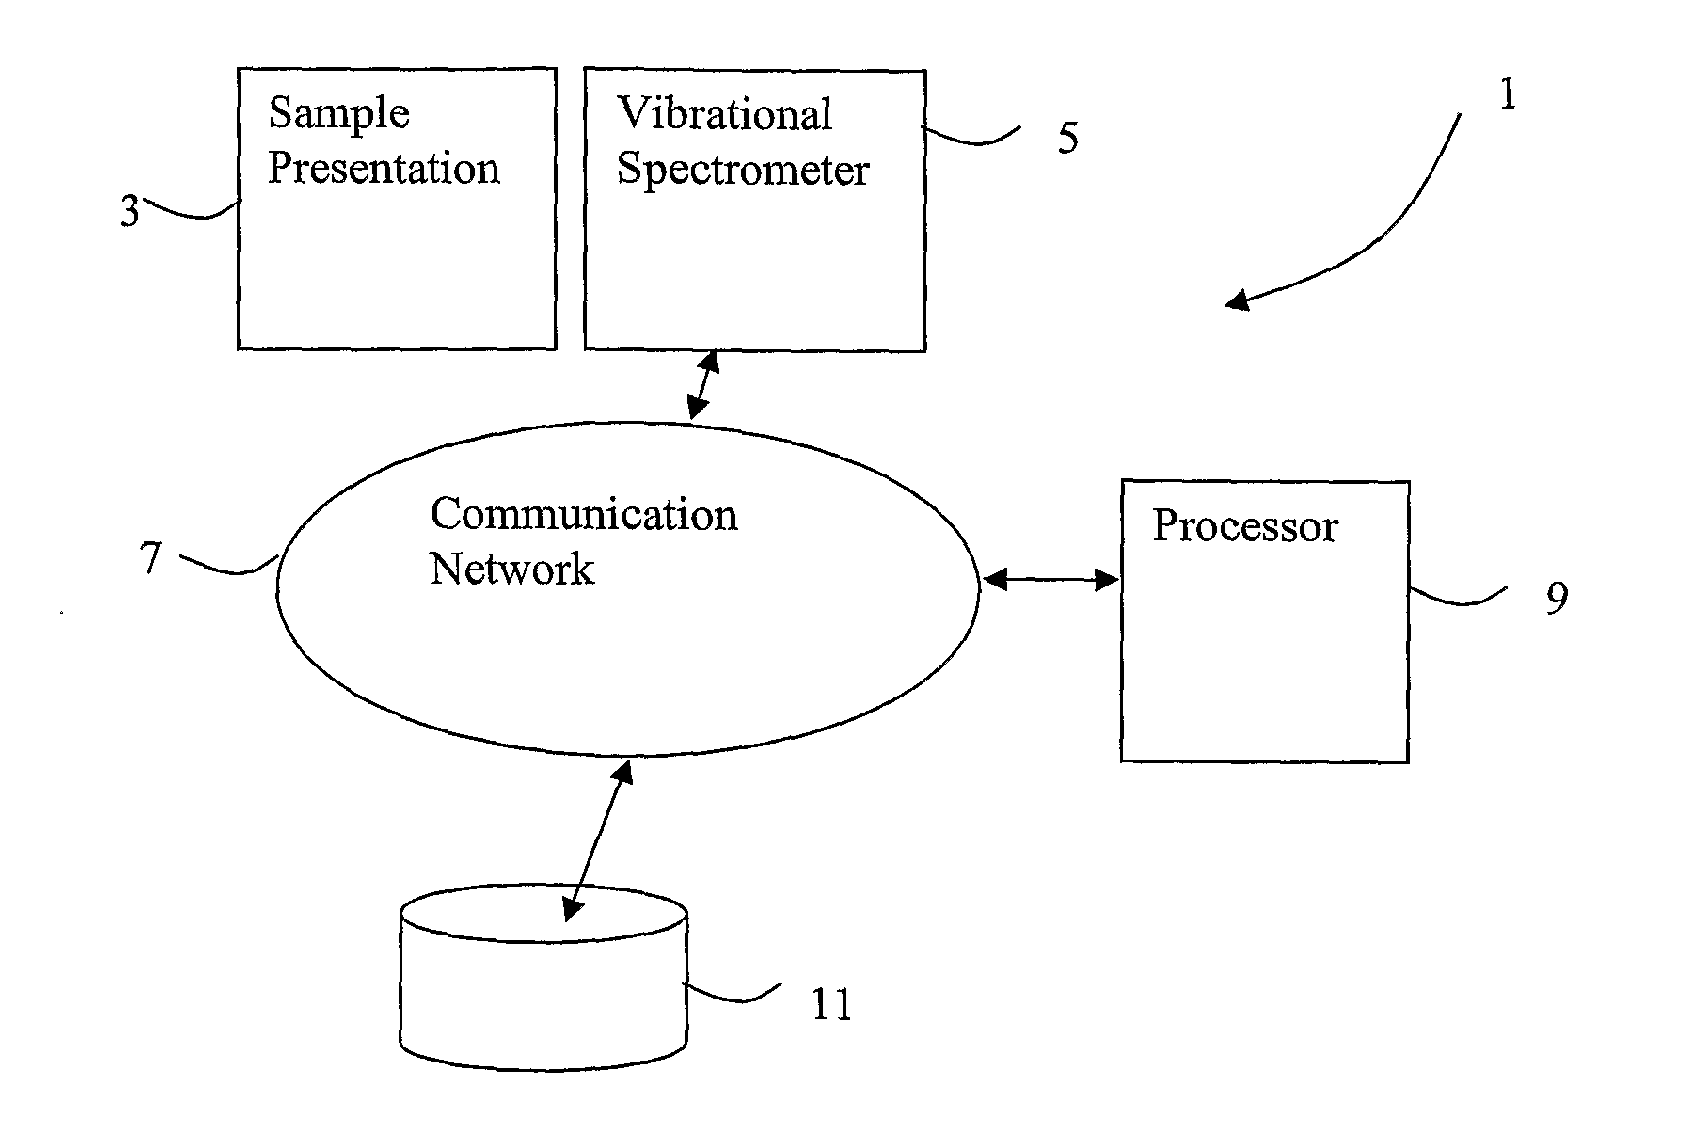
Image

Examples
example 1
[0157]Animal Models
[0158]Mice (female, C57 / B6) were infected at an age of 6 weeks.
[0159]Cerebral Malaria
[0160]Infection of 21 mice was performed via an intraperitoneal injection of 200 μL of blood containing the malarial parasite P. berghei ANKA (PBA) at a PRBC count of approximately 1×10⁶.
[0161]Mild & Severe Non-Cerebral Malarial Anaemia
[0162]Infection of 28 mice in the case of severe malaria and 20 mice in the case of mild malaria was performed via an intraperitoneal injection of 200 μL of blood containing the malarial parasite P. berghei K173 (PBK) at a PRBC count of approximately 1×10⁶.
[0163]Bacterial Meningitis
[0164]Infection of 19 mice was performed via intercranial Injection of S. pneumoniae in 10 μL of PBS, at a bacteria count of 3.8×10⁷ colony forming units (CFU).
[0165]Malaria Controls
[0166]29 mice were injected with 200 μL of PBS.
[0167]Bacterial Meningitis Controls
[0168]19 mice were injected with 10 μL of PBS solution via an intercranial injection.
[0169]Bacterial Meningiti...
example 2
Time Course Study of Bacterial Meningitis
[0213]PLS analyses were also performed on serum samples collected as a time course over the duration of the development of acute bacterial meningitis. The results, illustrated in FIG. 12, show that principal components can be identified that highlight a strong correlation between spectra and disease development. The first principal component scares from PLS analyses on the regions 1800-1490 and 1490-700 cm−1 of spectra collected from the serum obtained from mice at 0, 16, 28 and 40 hours post inoculation with mice at S. pneumonia are shown in FIG. 12. The results show a strong correlation exists between the principal component scores and the development of acute bacterial meningitis.
[0214]A classifier may be trained that uses FTIR spectroscopy of biological fluids to identify the stage in disease progression as well as to differentiate between different disease types. The spectral changes are seen earlier than the clinical changes became appa...
example 3
Diagnosis of Graft-Versus-Host Disease (GVHD)
[0218]FTIR spectroscopy combined, with multivariate statistical analysis has been used to indicate the onset of GVHD before clinical symptoms of the disease are evident. Thus, the methods may distinguish between the disease states of “healthy” or, “GVHD” even though there are no clinical symptoms to distinguish between these disease states at the time of testing.
[0219]A sample set of data was collected over 3 months. 11 patients were tracked for about 5 weeks each following a bone marrow transplant (BMT). The analysis of these data revealed spectral signatures that differentiate between patients that had a successful transplant and those that went on to develop GVHD (3 out of the 11). Specifically, the spectra appear to indicate changes in lipid oxidation and carbohydrate metabolism in the patients who developed GVHD.
[0220]The early separation of the patients' blood chemistry was discernable before there was any clinical evidence of GVHD....
PUM
 Abstract
Description
Claims
Application Information
 - Generate Ideas
- Intellectual Property
- Life Sciences
- Materials
- Tech Scout
- Unparalleled Data Quality
- Higher Quality Content
- 60% Fewer Hallucinations
Browse by: Latest US Patents, China's latest patents, Technical Efficacy Thesaurus, Application Domain, Technology Topic, Popular Technical Reports.
© 2025 PatSnap. All rights reserved.Legal|Privacy policy|Modern Slavery Act Transparency Statement|Sitemap|About US| Contact US: help@patsnap.com