
Methods and systems for utilizing quantitative imaging

a quantitative imaging and system technology, applied in the field of quantitative imaging and analytics, can solve the problems of inability to scale up to support high-throughput analysis, lack of adequate means to do so, and the radioologist would “drown” in data, etc., to achieve a favorable vascular wall transcriptomic profile, effective resolution, and high prevalence

Active Publication Date: 2019-06-06
ELUCID BIOIMAGING INC
View PDF9 Cites 53 Cited by
  • Summary
  • Abstract
  • Description
  • Claims
  • Application Information

AI Technical Summary

Benefits of technology

The patent describes a system and method that uses a special analytics framework to identify and measure biological properties from imaging data. This data is then used to identify and characterize medical conditions by analyzing patient clinical chemistry and blood biomarkers. The system combines advanced computational models with image processing and rigorous definitions of what is being measured to better understand the underlying causes and stages of disease. Overall, the patent presents a way to use multiple factors to distinguish between different subtypes of disease.

Problems solved by technology

With newer high-resolution imaging techniques, unaided, the radiologist would “drown” in data.
As a result, radiological images may be used to determine phenotype, but adequate means to do so are often lacking.
These methods have embedded human variability, and are clearly not scalable to underpin high-throughput analysis.
In addition to the problem of phenotype classification (classifying unordered categories) is the problem of outcome prediction / risk stratification (predicting ordinal levels of risk).
However, it has been somewhat of an undecided question what are the more fundamental reasons for the superior performance of the DL networks and approach compared to frameworks with the same number of fitting parameters but without the deep layered architecture.
Conventional ML approaches to image feature extraction and image-based learning from raw data have a multitude of limitations.
Notably, spatial context is often difficult to obtain in ML approaches using feature extraction when features are at a summary level rather than at the 3D level of the original image, or when they are at the 3D level, to the extent that they are not tied to a biological truth capable of being objectively validated but just being mathematical operators.
Use of raw data sets that do contain spatial context often lack objective ground truth labels for the extracted features, but use of raw image data itself include much variation that is “noise” with respect to the classification problem at hand.
In applications outside of imaging, this is usually mitigated by very large training sets, such that the network training “learns” to ignore this variation and only focus on the significant information, but large training sets of this scale are not generally available in medical applications, especially data sets annotated with ground truth, due to cost, logistics, and privacy issues.
Changes in luminal diameter relative to other segments of the same vessel, caused by local vasodilatory impairment at the time of maximal hyperemia, produces a marked hemodynamic effect, leading to abnormal FFR measurement.
Functional testing has known issues with sensitivity and specificity.
It is estimated that some 30-50% of cardiovascular disease patients are misclassified and are over-treated or under-treated with significant monetary and quality of life costs.
Functional testing is also expensive, time consuming and of limited use with patients that have pre-obstructive disease.
False positives from non-invasive function tests are a large factor in the overuse of both invasive coronary angiography and percutaneous coronary interventions in stable patients that are a major policy issue in the U.S., Great Britain and China.
In these studies, clinical variables had poor discrimination of identifying high-risk plaque characteristics when used alone.
Likewise, inflammatory insult and / or oxidative stress could result in local endothelial dysfunction, manifest as impaired vasodilatative capacity.
However, if the plaque has a more substantial necrotic core, it won't be able to dilate.
Blood supply will not be able to keep up with the demand.
But that isn't all a plaque can do.
Too often, plaques actually rupture, suddenly causing a clot which then may result in infarction of heart or brain tissue.
Other methods such as computational fluid dynamics (CFD), without objectively validated plaque morphology, can simulate flow limitation but not infarction risk.
Considering only the luminal surface at best requires processing both systolic and diastolic to get motion vector (which isn't even done by most available methods), but even that does not consider what occurs at stress, because these analyses are done with computer simulations of what may happen under stress rather than measuring actual stress, and not based on the actual characteristics that originate vasodilatory capacity but rather just the blood channel.
Some methods attempt to simulate forces and apply biomechanical models, but with assumptions rather than validated measurements of wall tissues.
Consequently, these methods have no ability to anticipate what can occur if stress in fact causes rupture beyond rudimentary assumptions.
Human disease exhibits strong phenotypic differences that can be appreciated by applying sophisticated classifiers on extracted features that capture spatial, temporal, and spectral results measurable by imaging but difficult to appreciate unaided.
While it is possible to perform model building readings vector as input data, performance is often limited by the implemented measurands.
Two important drawbacks of importance to medical systems are 1) the need for vast training and validation datasets, and 2) intermediate CNN computations are not representative of any measurable property (sometimes criticized as being a “black box” with undescribed rationale).
These artifacts and image limitations may decrease the ability to determine characteristics predictive of the phenotype.
Such methods may capture lesion length, stenosis, and possibly entrance and exit angles, but they neglect the determinants of vasodilatative capacity.
High level assumptions about the flexibility of the artery tree as a whole must be made to use these models, but plaques and other tissue properties cause the distensibility of the coronary tree to be distensible in a heterogeneous way.
Because distensibility is a key element in determining FFR, the methods are insufficient.
Some methods try to increase training set size by use of synthetic data, but this is ultimately limited to the limited data on which the synthetic generation as based and amounts more to a data augmentation scheme rather than a real expansion of the input training set.
IVUS imaging has excellent spatial resolution for gross structure (i.e., lumen) but generally lacks the ability to characterize plaque components with high accuracy.
For IVUS VH methodology using large (e.g., 480 μm) moving windows in the axial direction, the relatively large size of this moving window (and thus, the accuracy of the composition analysis) is fundamentally limited by the bandwidth requirements of the spectral analysis.
Where IVUS VH images are displayed at smaller moving windows, e.g., 250 μm, this limits the accuracy of this analysis since each IVUS pixel is classified into a discrete category.
Conventional competitive approaches that lack a validated and objective basis such as are fundamentally limited in multiple ways.
First, arbitrary thresholds are used, resulting in an inability to assess accuracy except in a weak form of correlation to other markers that themselves lack objective validation.
Second, this lack of objectivity increases the demands for large volumes of data on which to circumstantially base correlations.
Thirdly, due to the interpretability of the resulting model, these models must be presented to regulatory agencies such as FDA as a “black box” which lacks a scientifically rigorous elucidation on mechanisms of action that can be tied to traditional biological hypothesis testing.
Specifically, whereas CNNs have proven to be excellent at performing many different computer vision tasks, they have substantial drawbacks when applied to radiology data sets: 1) the need for vast training and validation datasets, and 2) intermediate CNN computations are generally not representative of any measurable property, which makes regulatory approval difficult.
Intermediate CNN computations are not generally representative of any measurable property, spatial context is often difficult to obtain in ML approaches using feature extraction, and use of raw data sets that do contain spatial context often lack objective ground truth labels for the extracted features, whether they are processed using traditional machine learning or deep learning approaches.

Method used


Image

  • Methods and systems for utilizing quantitative imaging
  • Methods and systems for utilizing quantitative imaging
  • Methods and systems for utilizing quantitative imaging

Examples


example implementations

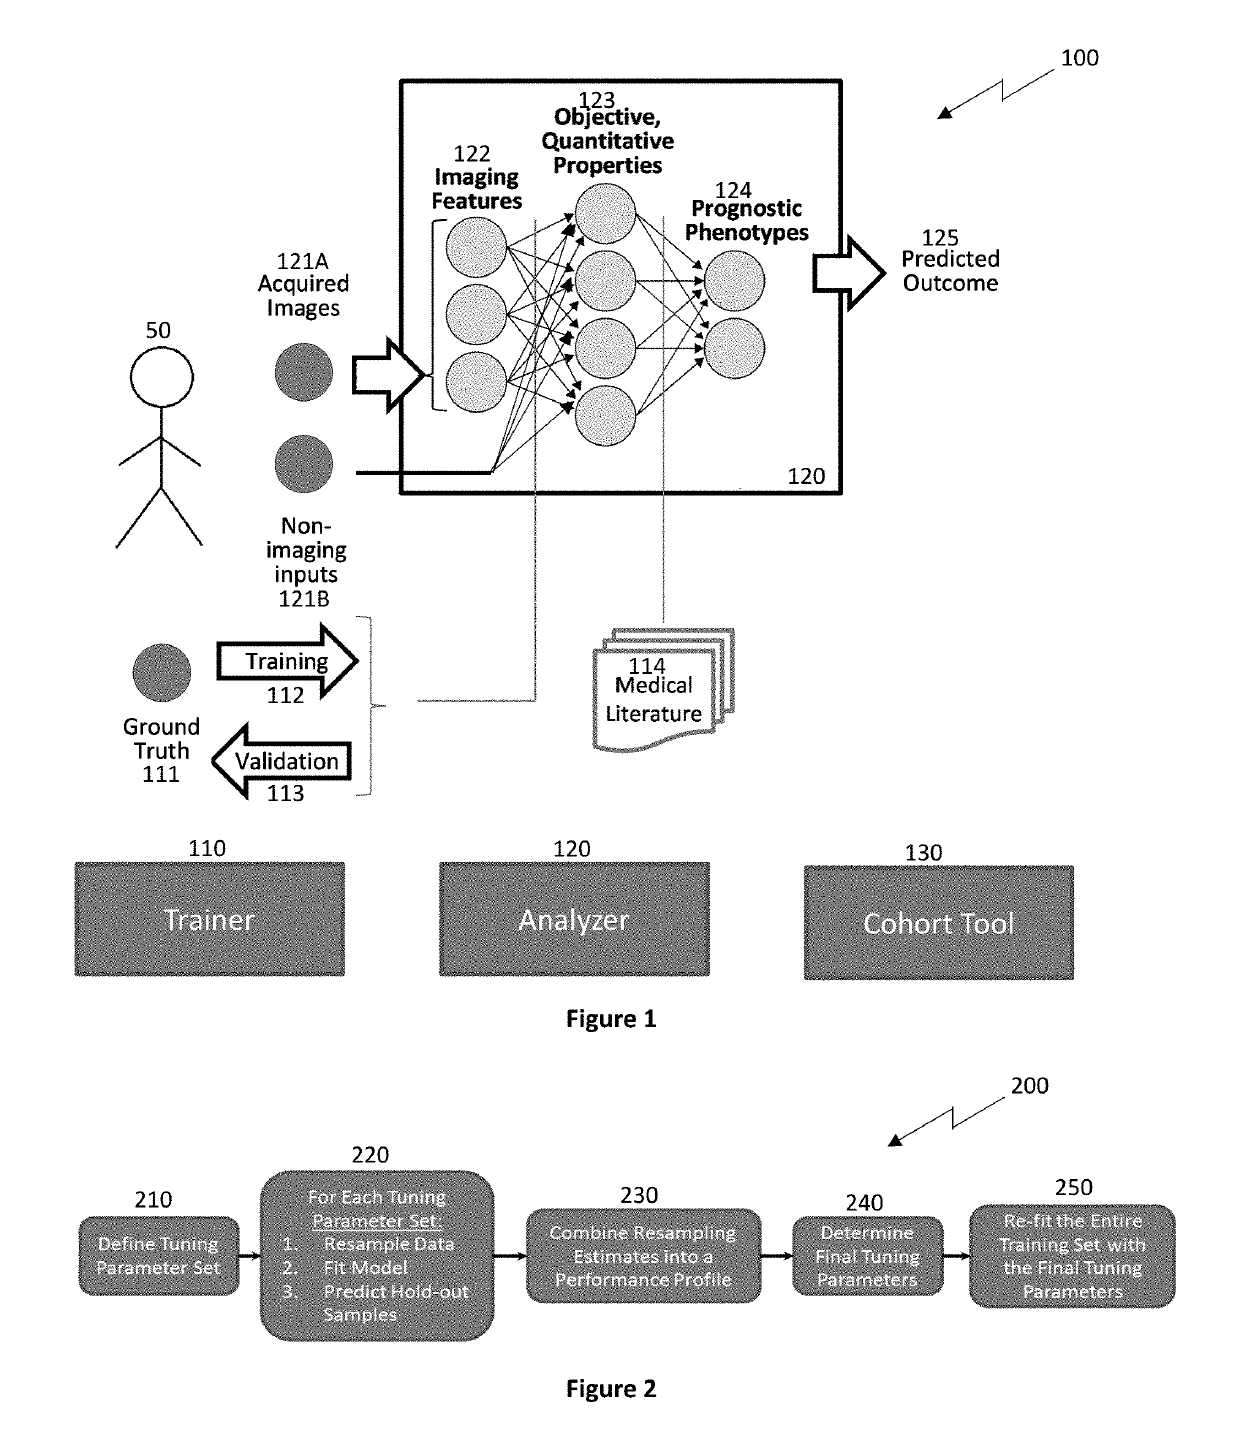
[0352]Systems and methods of the present disclosure may advantageously comprise a pipeline consisting of multiple stages. FIG. 34 provides a further example implementation of a hierarchical analytics framework. Biological properties are identified and quantified by semantic segmentation to identify biological properties singly or in combination, in the example application lipid-rich necrotic core, cap thickness, stenosis, dilation, remodeling ratio, tortuosity (e.g., entrance and exit angles), calcification, IPH, and / or ulceration, which is represented numerically as well as in enriched data sets with spatial unwrapping to convert the vein / artery cross-section into a rectangle, and then medical conditions (example.g., ischemia-causing fractional flow reserve FFR, high-risk phenotype HRP, and / or risk stratification time to event (TTE) using trained CNN(s) to read the enriched data sets to identify and characterize the condition. Images are collected of the patient, the raw slice data...


PUM


Abstract

Systems and methods for analyzing pathologies utilizing quantitative imaging are presented herein. Advantageously, the systems and methods of the present disclosure utilize a hierarchical analytics framework that identifies and quantify biological properties / analytes from imaging data and then identifies and characterizes one or more pathologies based on the quantified biological properties / analytes. This hierarchical approach of using imaging to examine underlying biology as an intermediary to assessing pathology provides many analytic and processing advantages over systems and methods that are configured to directly determine and characterize pathology from underlying imaging data.

Description

CROSS-REFERENCE TO RELATED APPLICATIONS[0001]The present application is a continuation-in-part of the co-pending U.S. application Ser. No. 14 / 959,732, filed on Dec. 4, 2015, which claims priority to U.S. Provisional Application Ser. No. 62 / 205,295, filed on Aug. 14, 2015; U.S. Provisional Application Ser. No. 62 / 205,305, filed on Aug. 14, 2015; U.S. Provisional Application Ser. No. 62 / 205,313, filed on Aug. 14, 2015; U.S. Provisional Application Ser. No. 62 / 205,322, filed on Aug. 14, 2015; and U.S. Provisional Application Ser. No. 62 / 219,860, filed on Sep. 17, 2018. The present application also claims priority to U.S. Provisional Application Ser. No. 62 / 676,975, filed on May 27, 2015 and U.S. Provisional Application Ser. No. 62 / 771,448, filed on Nov. 26, 2018.BACKGROUND OF THE INVENTION[0002]The present disclosure related to quantitative imaging and analytics. More specifically, the present disclosure relates to systems and methods for analyzing pathologies utilizing quantitative im...

Claims


Application Information

Patent Timeline
Patent Type & Authority Applications(United States)
IPC IPC(8): G06T7/00G06T7/11G06K9/62G06K9/72G06T5/00G06T11/00A61B6/03A61B6/00
CPCG06T7/0012G06T7/11G06K9/6267G06K9/726G06K9/6228G06T5/003G06T11/001A61B6/032A61B6/481A61B6/504A61B6/5217G06T2207/30104G06K2209/05G06T2207/30096G06T2207/20104G06T2207/20084G06T2207/10081G06T2207/10088G06T2207/10132G06T2207/10104G06T2207/10101G06T2207/10108G06T2207/20016G06K9/6257G06T2207/20081A61B6/463A61B6/5258A61B6/5294G16H50/30G06V10/457G06V10/454G06V2201/03G06V10/82G06V30/19173G06T7/60G06T11/00G06V30/274G06F18/24G06F18/211G06F18/24143G06F18/2148G06T5/73
Inventor BUCKLER, ANDREW J.JOHNSON, KJELLMA, XIAONANMOULTON, KEITH A.BUCKLER, MARK A.VALTCHINOV, VLADIMIRPAIK, DAVID S.
Owner ELUCID BIOIMAGING INC
Learn More