

Optical method and apparatus for red blood cell differentiation on a cell-by-cell basis, and simultaneous analysis of white blood cell differentiation
a technology of red blood cell differentiation and optical method, applied in the direction of material analysis, fluorescence/phosphorescence, instruments, etc., can solve the problems of misleading impressions, manual method is very subjective and time-consuming, and does not provid
- Summary
- Abstract
- Description
- Claims
- Application Information
AI Technical Summary
Benefits of technology
Problems solved by technology
Method used
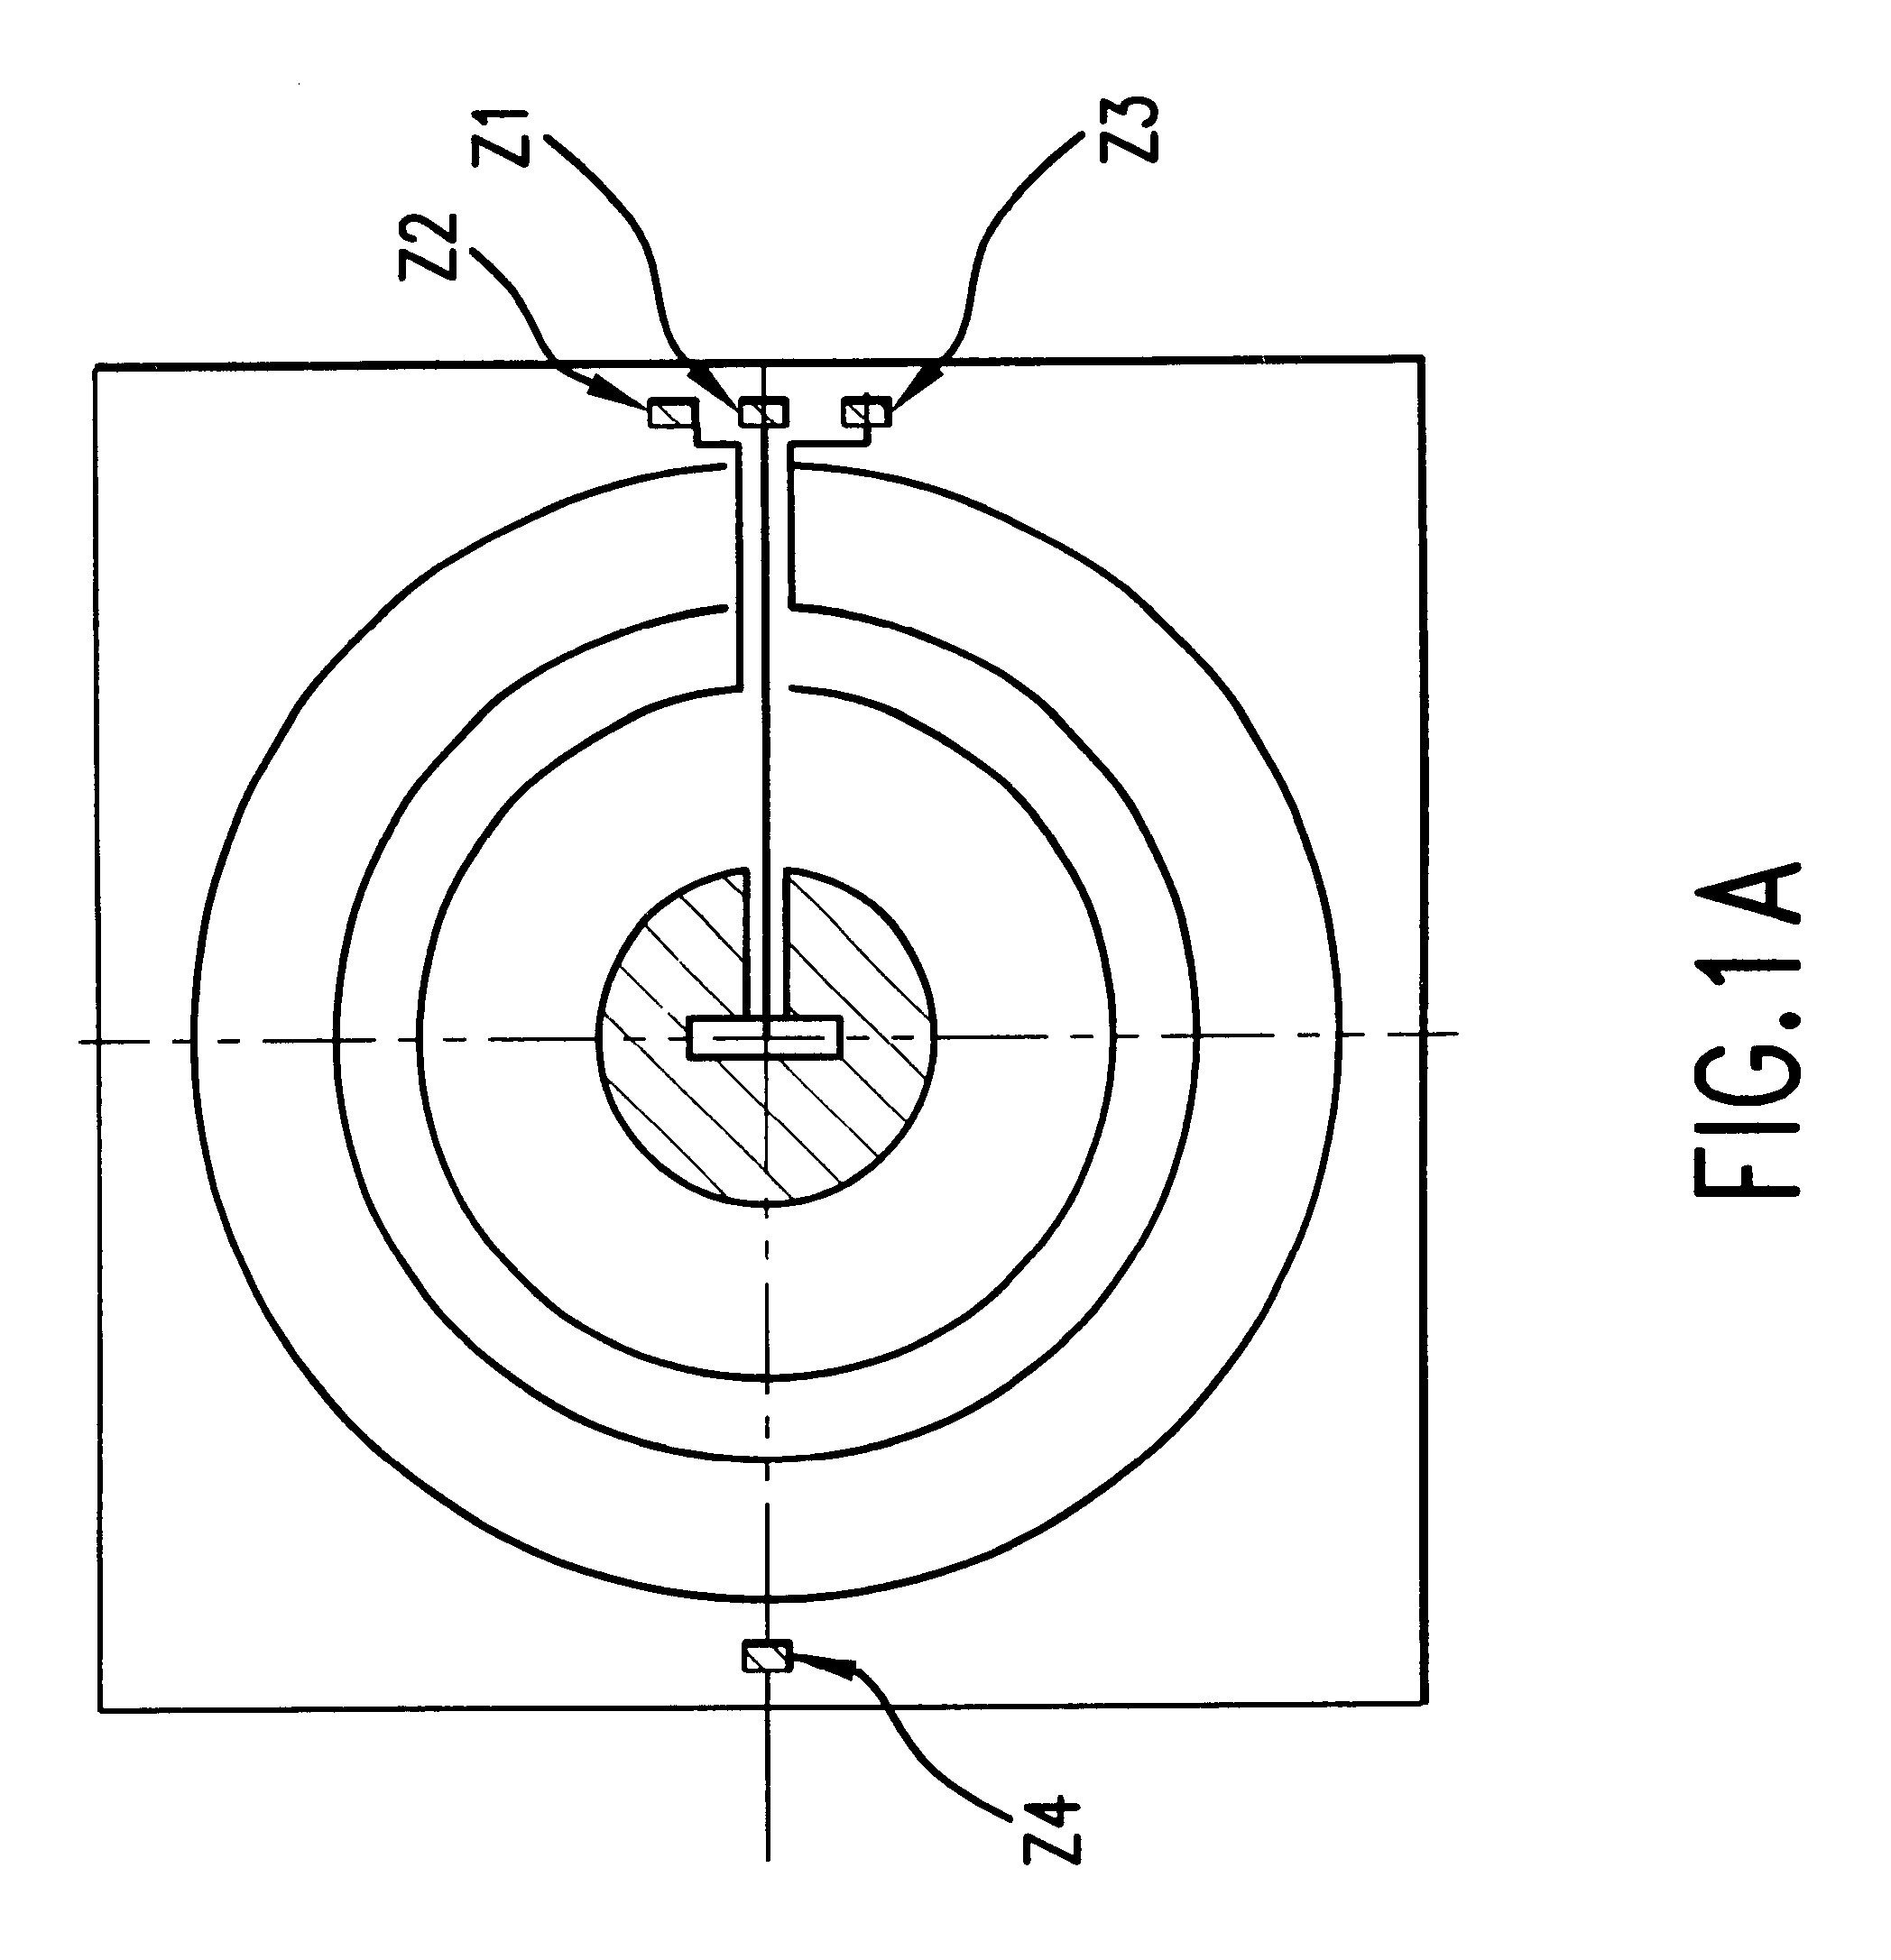
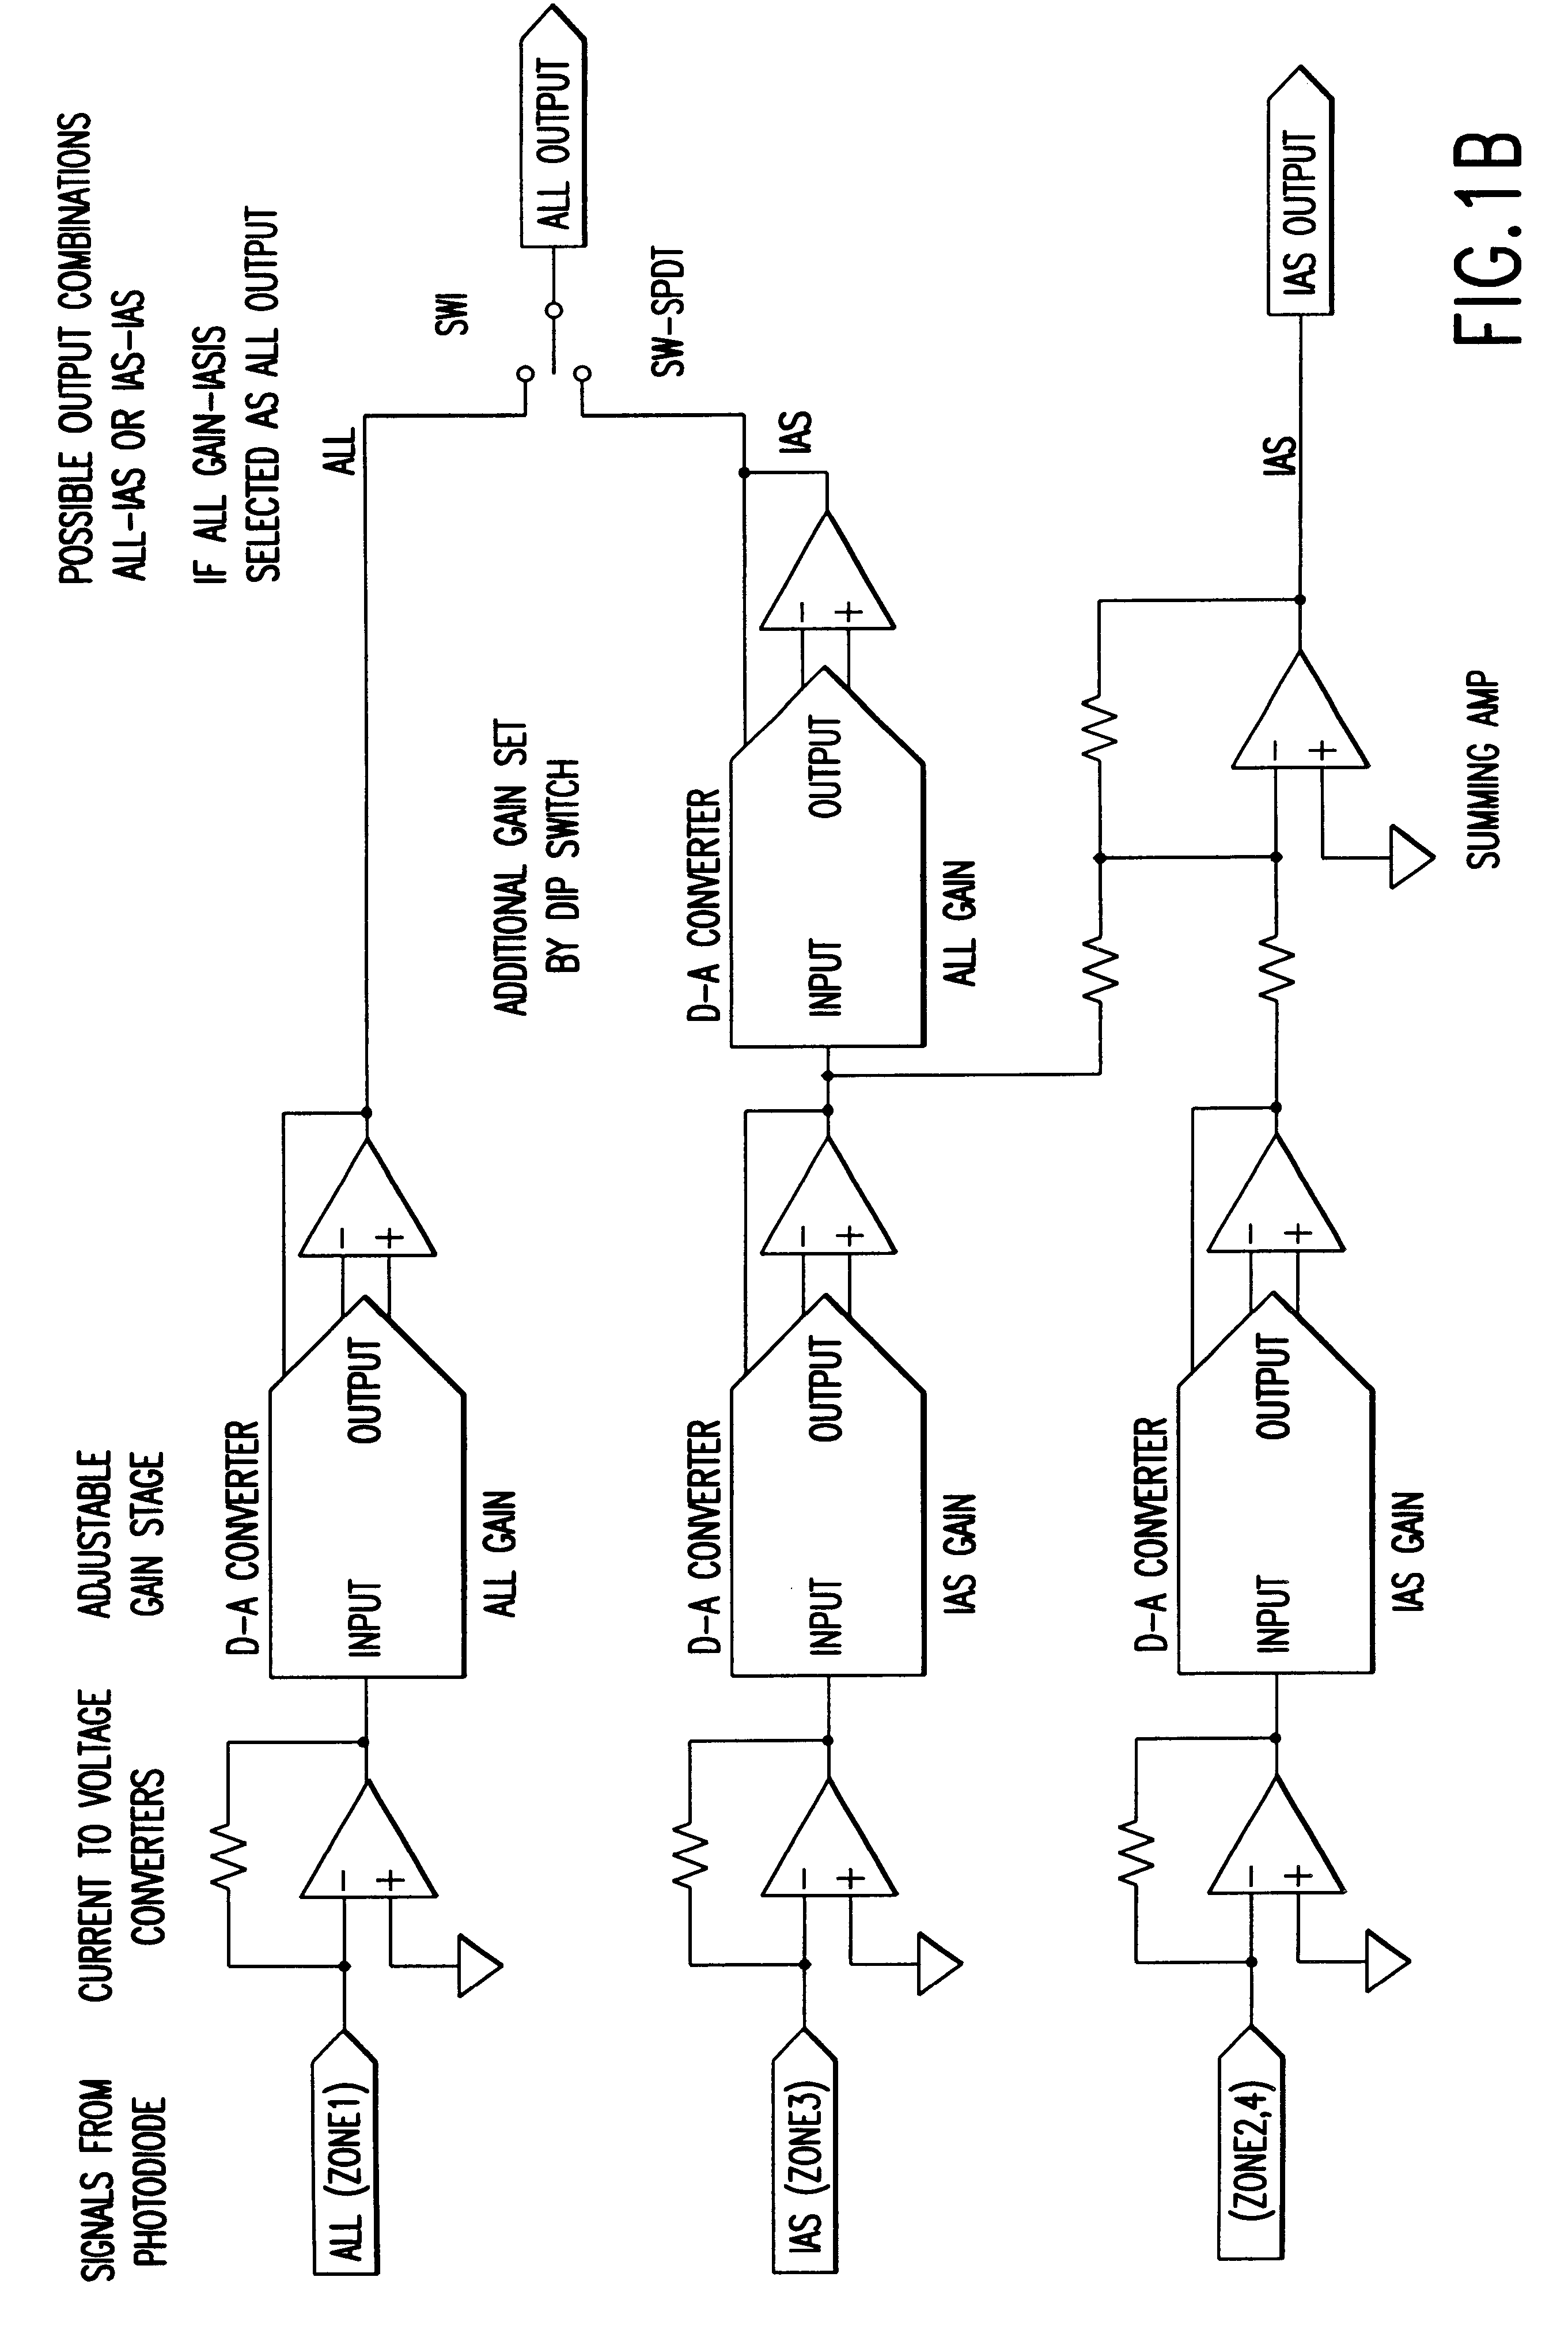
Image

Examples
example 2
For this experiment, the CD4000 system described U.S. Pat. Nos. 5,656,499 and 5,631,165 entitled "METHOD AND APPARATUS FOR PERFORMING AUTOMATED ANALYSIS" was modified with the 3-Ring detector and the new pre-amp board as described in Example 1. About 112.5 .mu.l of a normal whole blood sample is deposited by means of the sample aspiration probe into the RBC cup, which contains about 10,513 .mu.l of the CD4000 Diluent-Sheath, and mixed. The diluted sample is then transported to a sheathed impedance aperture to electronically determine the absolute RBC counts, as described in U.S. Pat. Nos. 5,656,499 and 5,631,165. About 450 .mu.l of the diluted sample is transferred into the CD4000 reticulocyte cup, which contains about 450 .mu.l of the reticulocyte reagent (U.S. Pat. No. 5,691,204. Nov. 25, 1997. Compositions and methods for the rapid analysis of reticulocytes) and mixed. The prepared sample is then transported to the sheathed optical flow cell for detection. WBC's and NRBC's are el...
example 3
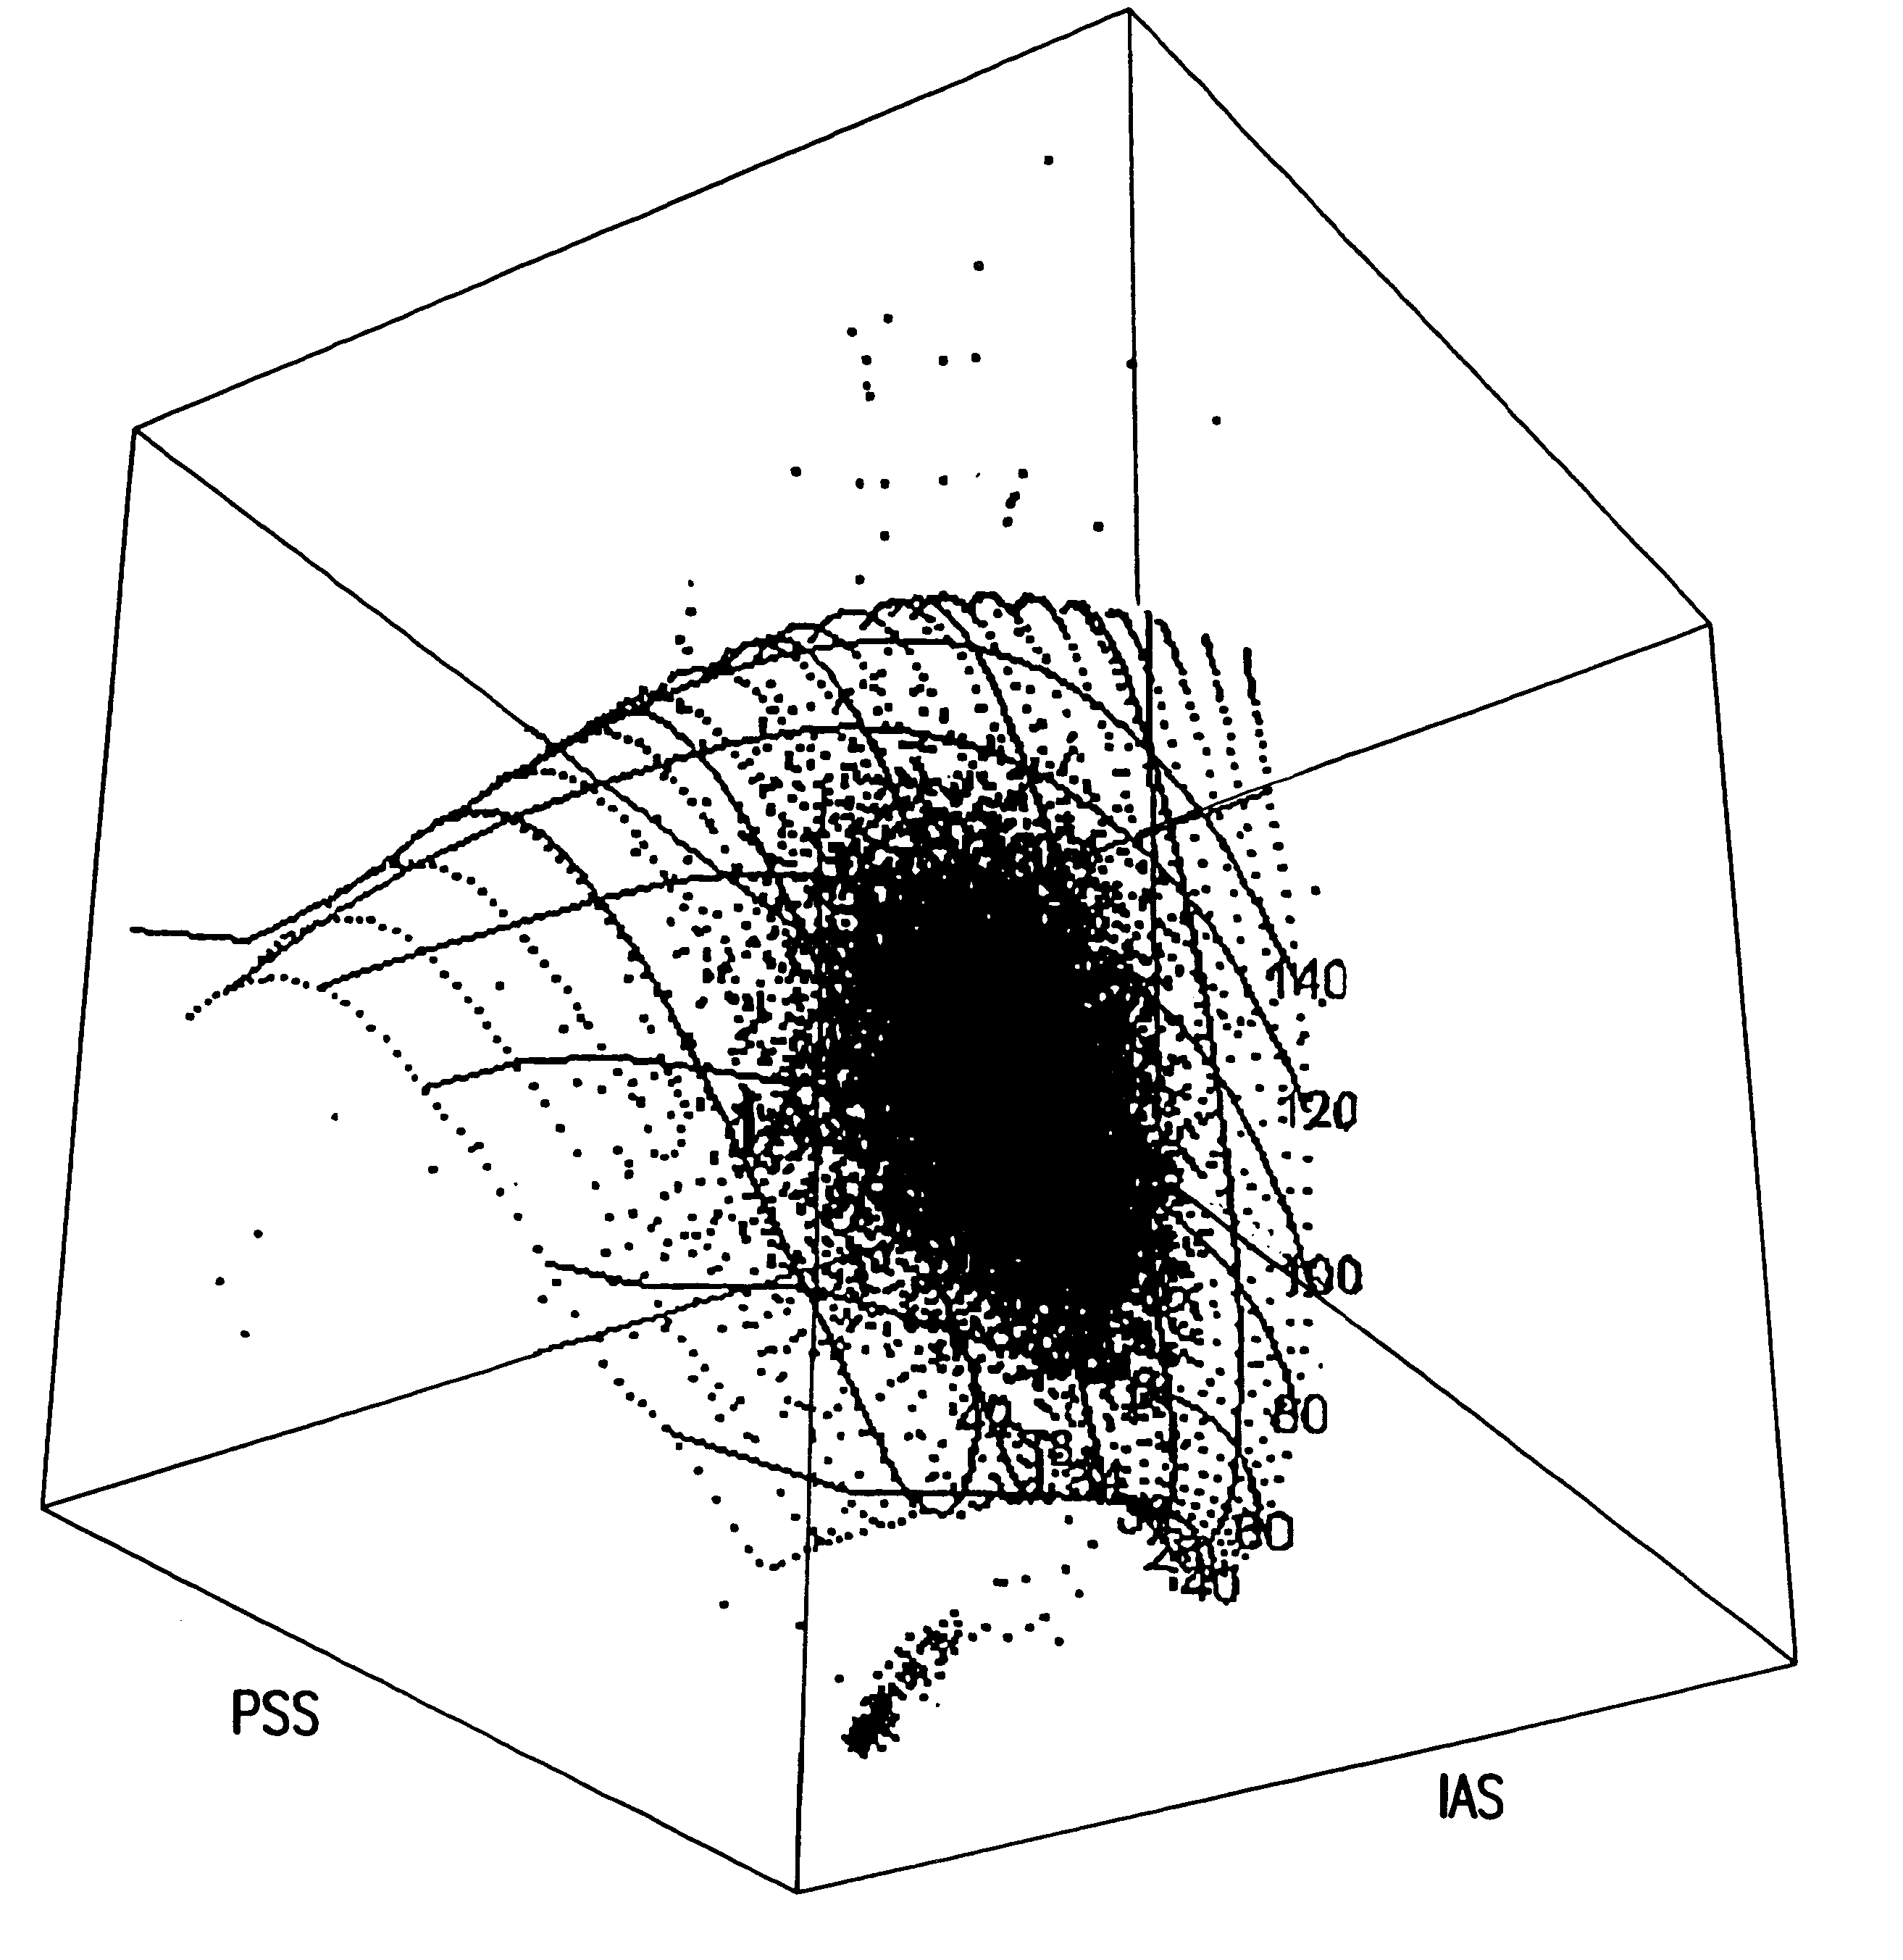
A clinical blood sample containing sickle cells was run on the disclosed apparatus described in Example 2. FIG. 5a and FIG. 5b display the front and the side view of the sample, respectively. As can be seen, the cell population is much more dispersed, due to abnormally-shaped sickle cells, and the side view shows the signals falling off the 3D surface. Based on the distance from the surface of each event, the method of the present invention is capable of estimating the percent of abnormally shaped RBC's. The 2D distribution of prior art by Tycko (Bayer H*1) of the same sample is displayed in FIG. 5c. As can be seen in FIG. 5c, the 2D distribution does not distinguish abnormal cell shapes from sphered normocytes. Besides, a significant number of RBC's with abnormal shape fell off the 2D map, thereby excluded from the volume measurement.
example 4
The CD4000 cytogram (FL1 vs. IAS) of a high WBC sample and the separation and exclusion of WBC's from the RBC gate, which includes stained reticulocytes and mature RBCs, is shown in FIG. 6a. As shown in FIG. 4a, the method of the present invention clearly identifies and eliminates WBC's from the RBC population before the RBC / diff analysis. FL1 histogram of the gated population is presented in FIG. 6b. On the contrary, the prior art disclosed by Tycko (Bayer H*1) does not clearly distinguish or separate WBC's from the RBC population (see FIG. 6c, RBC distribution of the same sample, by prior art). Therefore, the method of prior art may generate erroneous red cell MCV and MCHC results on elevated WBC samples from patients with various leukemias, especially chronic lymphocytic leukemia (CLL) since CLL lymphocytes are not only as small as RBC's but also fragile generating light scatter signals as small as RBC's.
PUM
| Property | Measurement | Unit |
|---|---|---|
| wavelength | aaaaa | aaaaa |
| size | aaaaa | aaaaa |
| wavelength | aaaaa | aaaaa |
Abstract
Description
Claims
Application Information