Detection method for liquid chromatography tandem mass spectrometry of semi carbazide
A detection method, liquid chromatography technology, which is applied in the detection field of food pollutants, can solve the problems such as the lack of SEM detection method standards, and achieve the effects of rapid detection, high sensitivity and low detection limit
- Summary
- Abstract
- Description
- Claims
- Application Information
AI Technical Summary
Problems solved by technology
Method used
Image
Examples
Embodiment 1
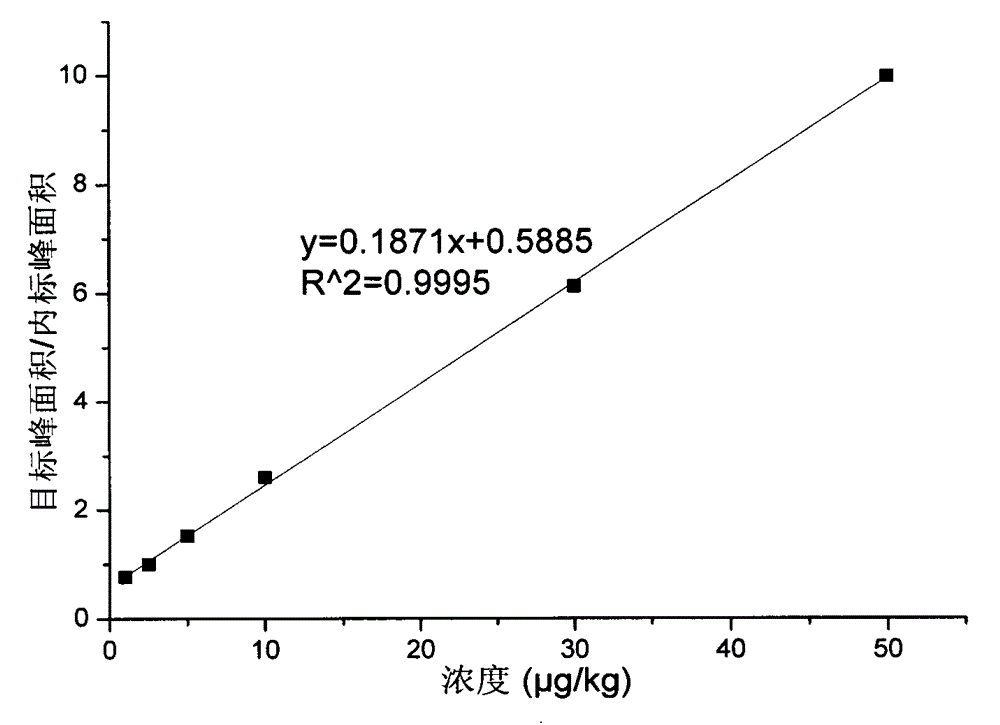
[0018] Accurately weigh 0.01g (accurate to 0.0001g) of the SEM standard substance, place it in a 10mL brown volumetric flask, dissolve it with a small amount of methanol, and then dilute to 10mL with methanol to prepare a 1000mg / L SEM stock solution. Weigh 1.0g (accurate to 0.0001g) of 6 negative blank flours into a 50mL centrifuge tube, add SEM standard solution respectively, so that the final concentrations are 1.0, 2.5, 5.0, 10.0, 30.0, 50.0 μg / kg respectively, according to the protocol ( 1) after sample pretreatment, measure by the detection condition of scheme (2), carry out linear regression to concentration X (mg / L) with peak area (Y), draw standard curve ( figure 1 ), by continuously reducing the concentration of the standard solution, the concentration at which the signal-to-noise ratio is 3 is taken as the lowest detection limit. The function relationship of the standard curve is: Y=0.5885+0.1871X, and the correlation coefficient is R 2 =0.9995, the lowest detection...
Embodiment 2
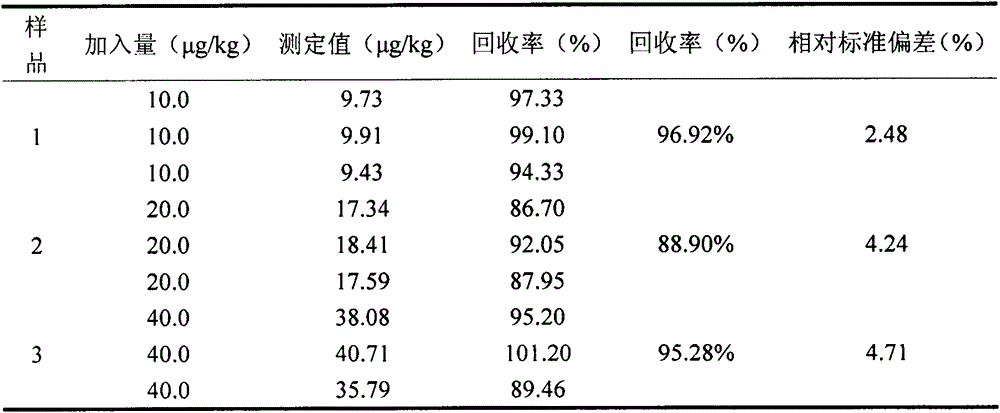
[0020] Accurately weigh 1.0g (accurate to 0.0001g) of 3 parts of blank flour as the matrix, add SEM standard solution respectively, so that the SEM content in the flour is 10.0, 20.0, 40.0μg / kg respectively, follow the sample pretreatment steps in the scheme (1) For processing, do 3 parallel tests at each concentration level, detect according to the detection conditions of the scheme (2), and measure the recovery rate and precision of the method. The analysis results are shown in Table 1. The recovery rate was 89.46%-101.20%, and the relative standard deviation was 2.48%-4.71%, which indicated that the method established in this study was reliable.
[0021] Table 1 SEM recovery and precision determination results of spiked flour
[0022]
Embodiment 3
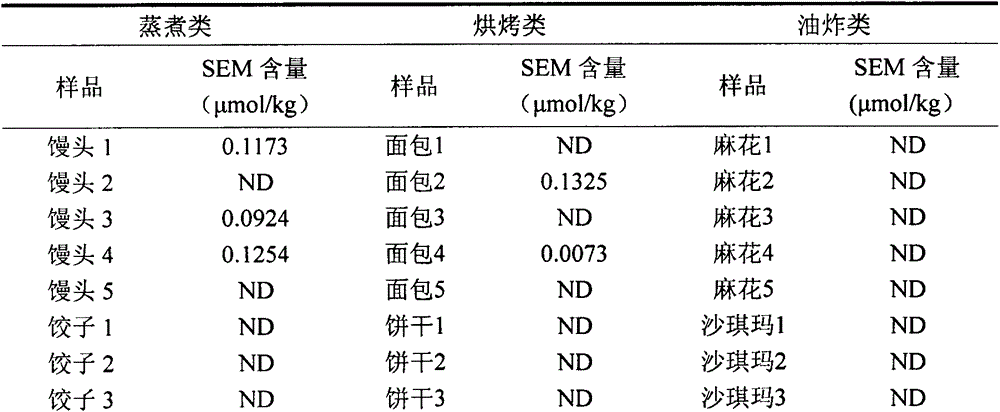
[0024] Through the SEM content detection of 9 different types of noodle products, the samples were processed according to the sample pretreatment steps in the scheme (1), and the detection was carried out according to the detection conditions of the scheme (2). The measurement results are shown in Table 2.
[0025] Table 2 Content of SEM in commercially available flour products
[0026]
[0027]
PUM
 Abstract
Description
Claims
Application Information
 - R&D
- Intellectual Property
- Life Sciences
- Materials
- Tech Scout
- Unparalleled Data Quality
- Higher Quality Content
- 60% Fewer Hallucinations
Browse by: Latest US Patents, China's latest patents, Technical Efficacy Thesaurus, Application Domain, Technology Topic, Popular Technical Reports.
© 2025 PatSnap. All rights reserved.Legal|Privacy policy|Modern Slavery Act Transparency Statement|Sitemap|About US| Contact US: help@patsnap.com


