a cu + Fluorescent probe and its preparation method and application
A fluorescent probe and probe technology, applied in the fields of fluorescence imaging and biosensing, can solve the problems of low signal interference, achieve the effects of correcting environmental interference, improving accuracy, and enriching detection methods
- Summary
- Abstract
- Description
- Claims
- Application Information
AI Technical Summary
Problems solved by technology
Method used
Image
Examples
Embodiment 1
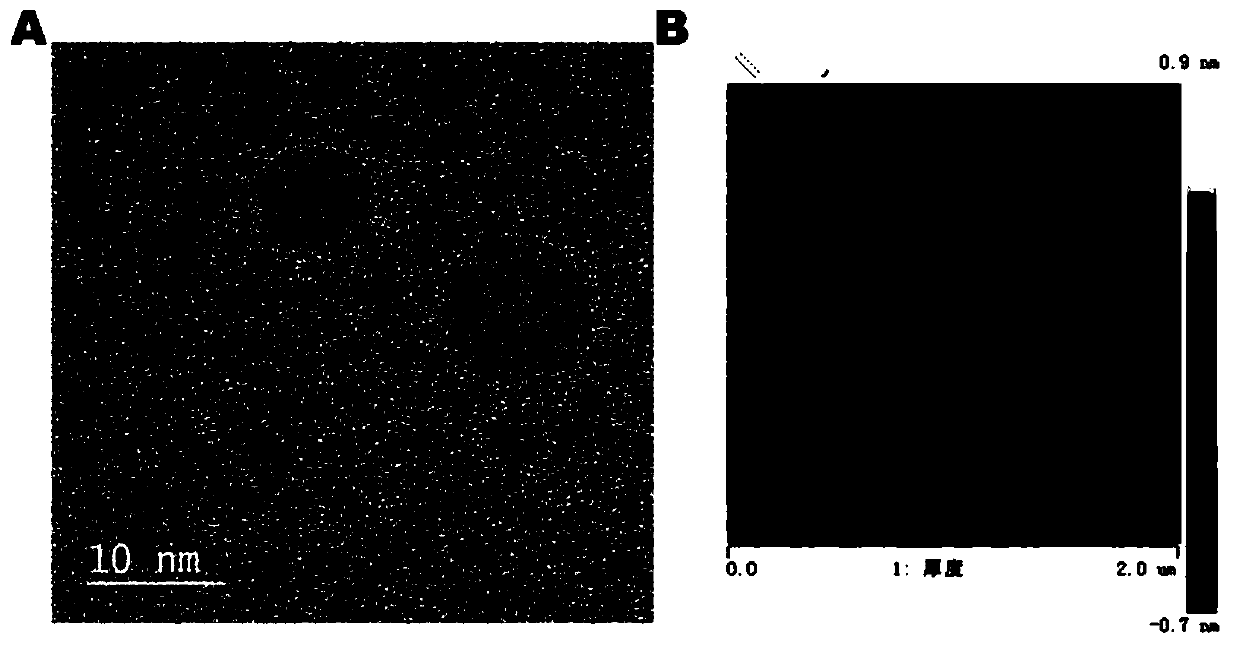
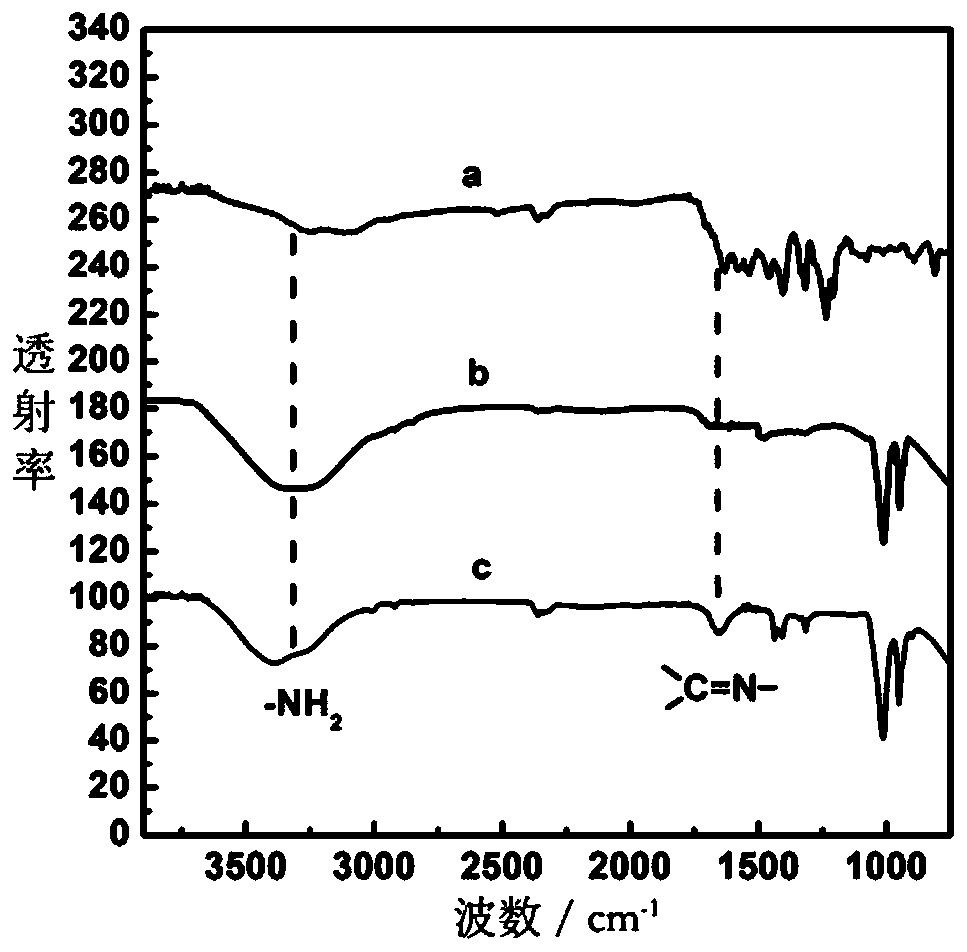
[0109] Example 1. Cu + Preparation of fluorescent probes
[0110] (1) Preparation of copper ion ligand: 2.12g hydroxyethyl sulfide (20mmol) and 1.52g thiourea (20mmol) were mixed and reacted in 4.3mL 48% hydrobromic acid (32mmol), and refluxed overnight under nitrogen atmosphere. The reaction was cooled to 25° C., aqueous sodium hydroxide solution (40 mmol) was slowly added, and the mixed reaction product was refluxed overnight under nitrogen atmosphere. Then the reaction was cooled to 25°C, neutralized with concentrated hydrochloric acid, then extracted with 100 mL of ethyl acetate, the organic phase was separated, washed with 100 mL of water, then dried with magnesium sulfate, and evaporated to dryness to obtain a colorless, Pungent smelling oil (1.7 g, 70% yield).
[0111] Then, 0.56 g of sodium (23.3 mmol) and 0.34 g of the above product (2.8 mmol) were added to 60 mL of absolute ethanol under a nitrogen atmosphere, and the mixed solution was heated to reflux. 0.66g of ...
Embodiment 2
[0117] Example 2. Detection of Cu in an in vitro environment +
[0118] (1) Preparation of fluorescence intensity calibration curve
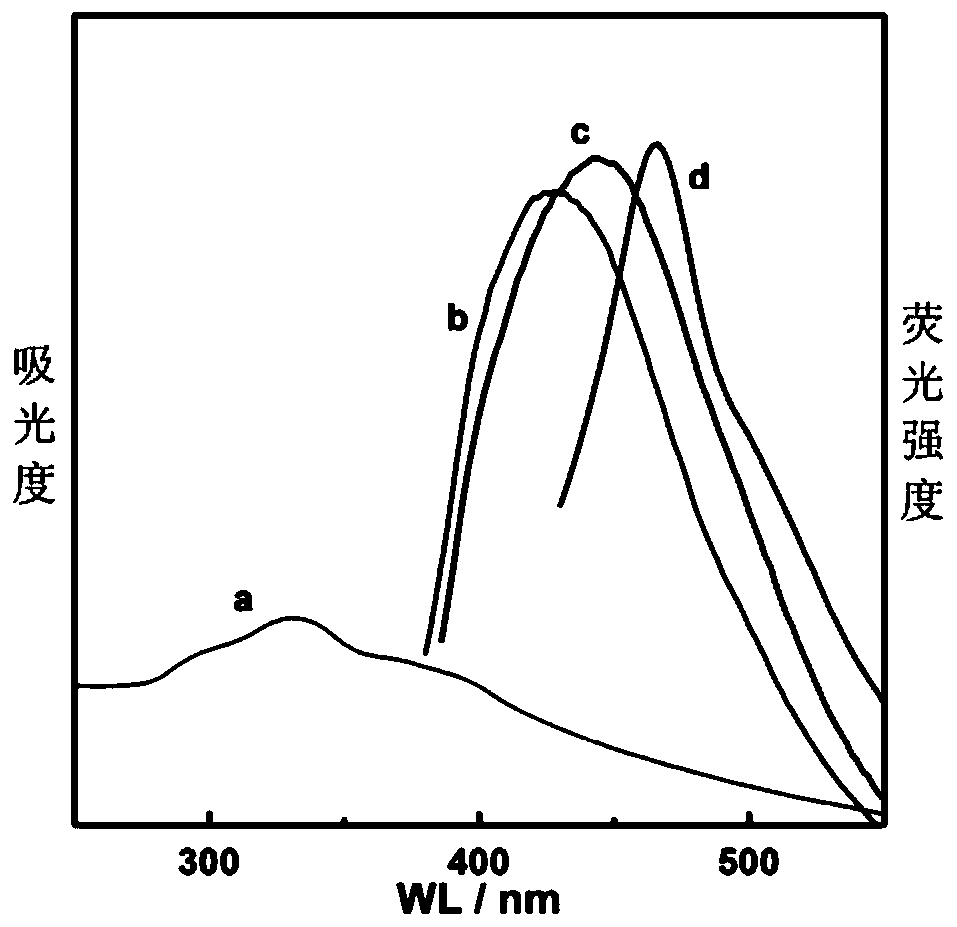
[0119] Get the Cu prepared in 1mL embodiment 1 + Fluorescent probes, diluted to 2mL with phosphate buffer, added 10μL of equal concentration of Cu each time + solution, and then measure the fluorescence intensity of the solution with an excitation wavelength of 405 nm. As the added volume increases, the fluorescence intensity of the probe decreases gradually, and shows good linearity in the range of 5-80μM, the lowest detection line is 0.60μM; the linear relationship is R 2 =0.997( Figure 4 ).
[0120] (2) Preparation of fluorescence lifetime and calibration curve
[0121] Get the Cu prepared in 1mL embodiment 1 + Fluorescent probes, diluted to 2mL with phosphate buffer, added 10μL of equal concentration of Cu each time + solution, and then measure the fluorescence intensity of the solution with an excitation wavelength of 405nm, with C...
Embodiment 3
[0125] The Cu prepared by embodiment 3. embodiment 1 + Fluorescent probes for Cu in vitro + Two-photon detection of
[0126] (1) Preparation of calibration curve
[0127] Get the Cu prepared in 1mL embodiment 1 + Fluorescent probes, diluted to 2mL with phosphate buffer, each time adding 10μL of equal concentration of Cu + The solution is then excited by two-photon fluorescence with an excitation wavelength of 800 nm, and the fluorescence intensity of the solution is measured. As the added volume increases, the two-photon fluorescence intensity decreases, and is the same as that of single-photon detection, with good linearity, showing good linearity in the range of 5-80 μM, and the lowest detection limit is 4.40 μM ( Figure 7 ).
[0128] The probe of the present invention has two-photon performance, so not only simple single-photon fluorescence detection, but also two-photon fluorescence detection can be performed. In addition, since the fluorescence lifetime changes linea...
PUM
 Abstract
Description
Claims
Application Information
 - R&D
- Intellectual Property
- Life Sciences
- Materials
- Tech Scout
- Unparalleled Data Quality
- Higher Quality Content
- 60% Fewer Hallucinations
Browse by: Latest US Patents, China's latest patents, Technical Efficacy Thesaurus, Application Domain, Technology Topic, Popular Technical Reports.
© 2025 PatSnap. All rights reserved.Legal|Privacy policy|Modern Slavery Act Transparency Statement|Sitemap|About US| Contact US: help@patsnap.com


