Fluorescent probe for detecting polarity in targeted endoplasmic reticulums and application thereof
A fluorescent probe and polarity technology, applied in the field of analytical chemistry, to achieve good fluorescence emission spectrum characteristics, cheap raw materials, and broad application prospects
- Summary
- Abstract
- Description
- Claims
- Application Information
AI Technical Summary
Problems solved by technology
Method used
Image

Examples
Embodiment 1
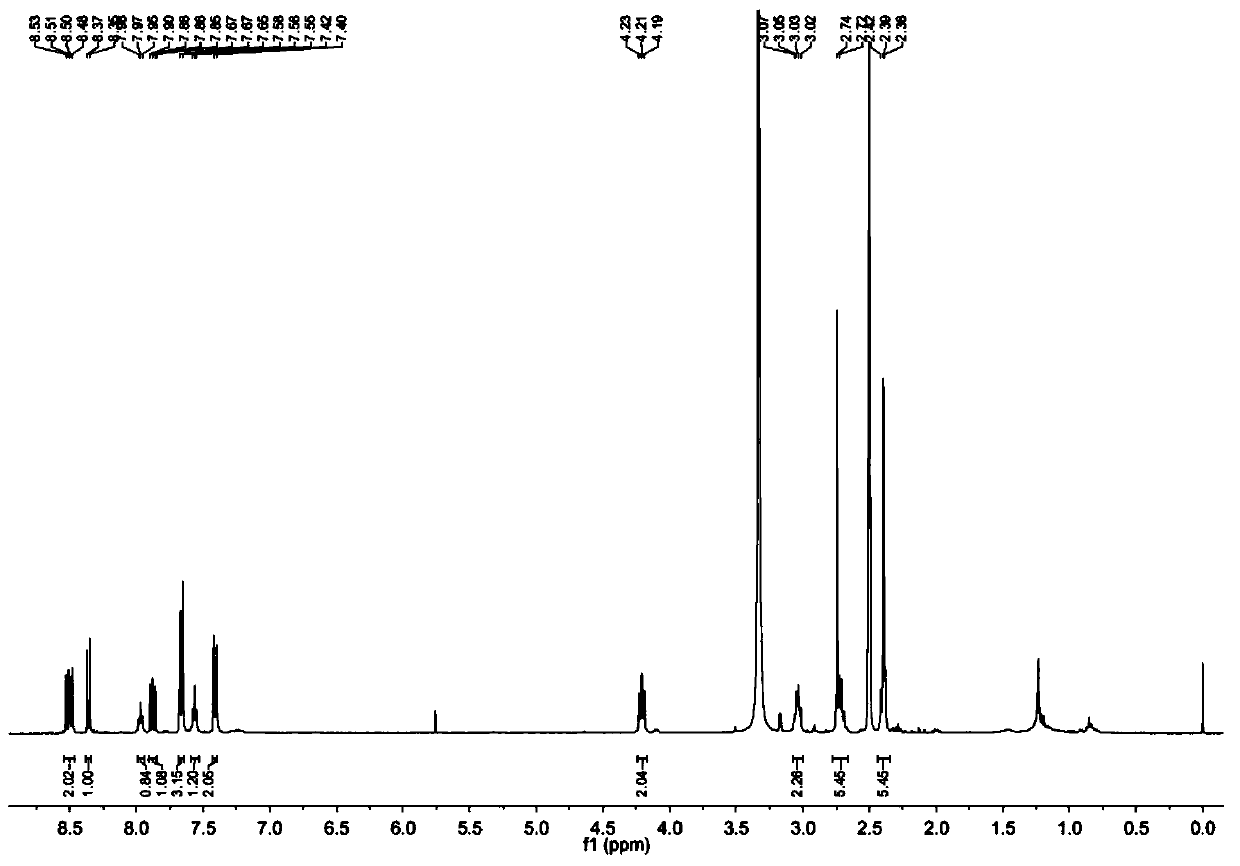
[0027] Example 1 Synthesis of Fluorescent Probes
[0028] (1) Dissolve Boc-ethylenediamine (950mg, 4.98mmol) in 15ml of dichloromethane, add triethylamine (2525mg, 24.95mmol) and stir at room temperature, and add p-toluenesulfonyl chloride (800mg, 5mmol) Dissolve in 8ml of dichloromethane and add dropwise to the reaction system, and continue to stir for 2 hours. Afterwards, the reaction solution was removed under reduced pressure to obtain a white solid. Finally, the white solid was dissolved in 30 ml of dichloromethane, about 8 ml of trifluoroacetic acid was added, and stirring was continued for 2 hours at room temperature. After the reaction was completed, the solvent in the reaction system was distilled off under reduced pressure, and the obtained crude product was purified by column chromatography to obtain a white solid, namely compound 1 (997mg, 93.2%), eluent: dichloromethane: Methanol: triethylamine=30:2:1,
[0029] ;
[0030] (2) Dissolve 4-methylthio-1,8-naphth...
Embodiment 2
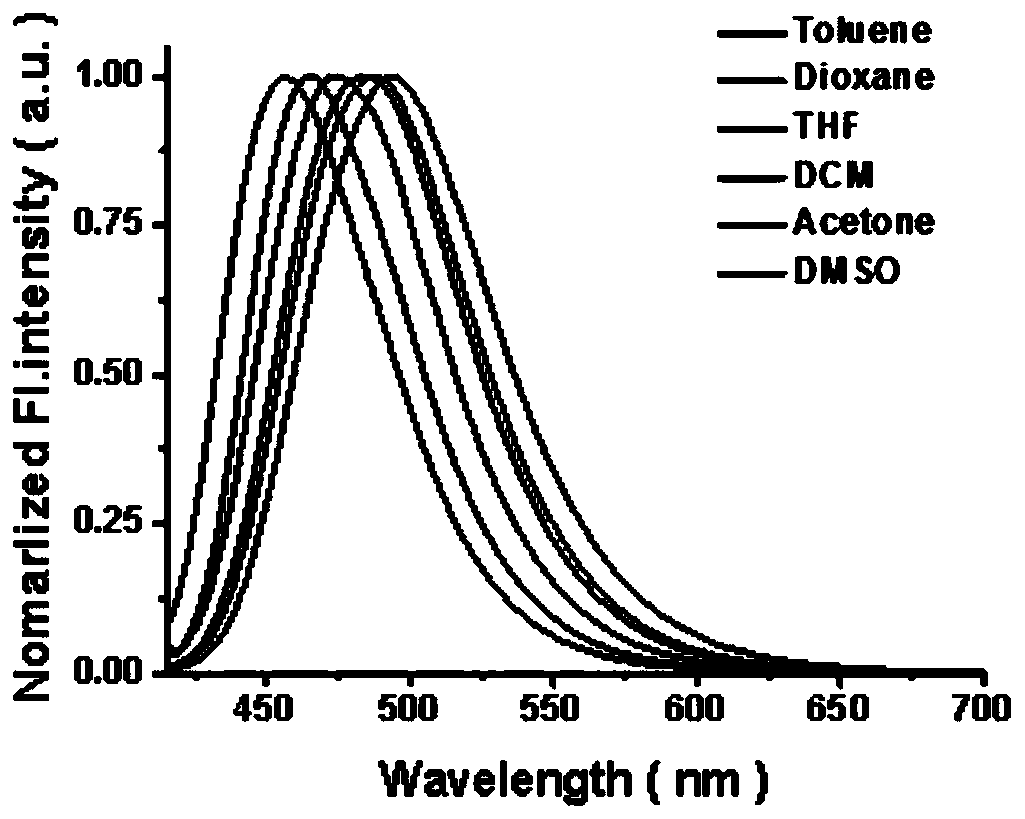
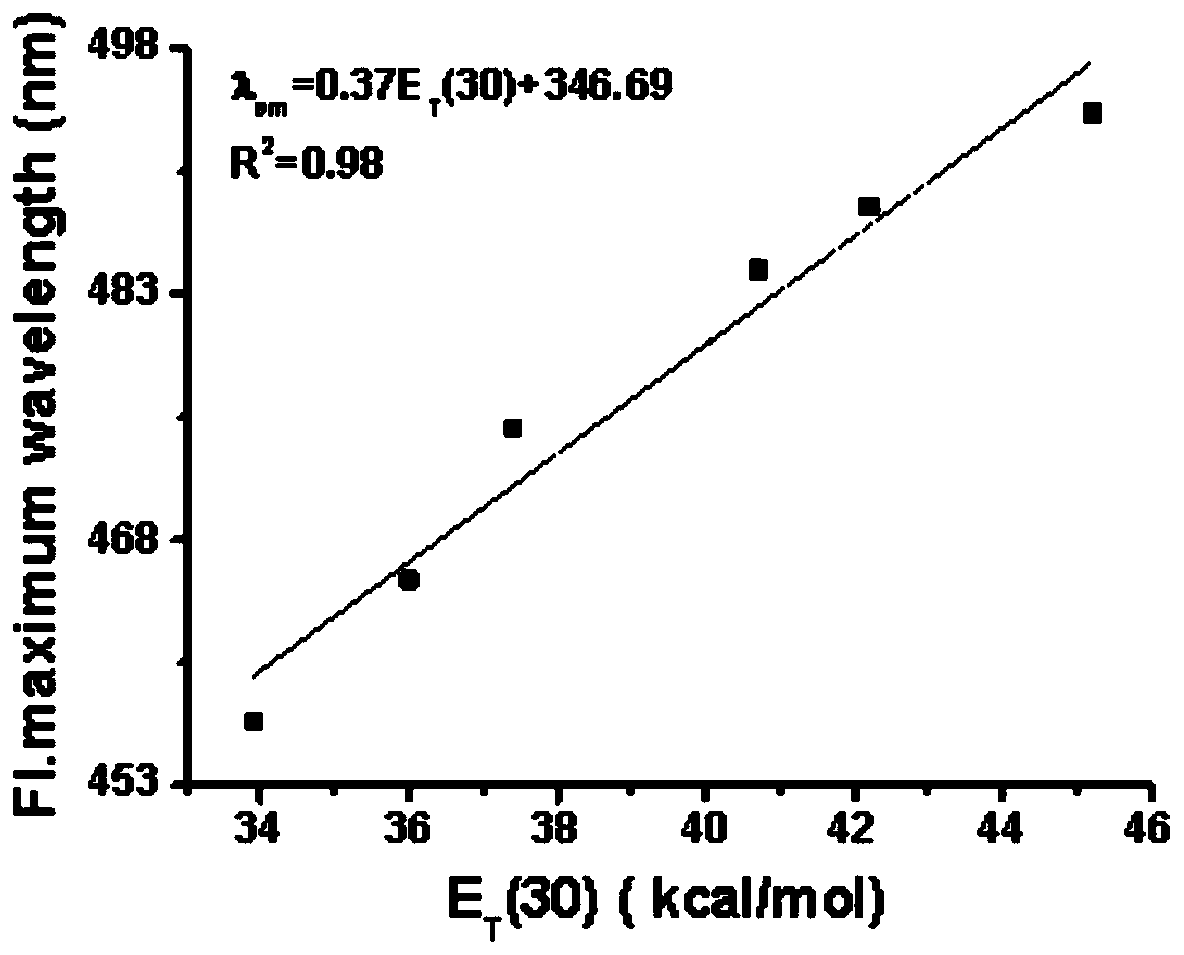
[0034] Example 2 Fluorescence spectra of fluorescent probes in different polar solvents
[0035] Prepare 6 parts of 2μL 10mM probe master solution in advance, and then use toluene, 1,4-dioxane, tetrahydrofuran, dichloromethane, N,N-dimethylformamide, dimethyl sulfoxide to dilute to 4mL respectively to make the solution The system concentration was 5 μM, and then the fluorescence scanning (λ ex =405 nm); calculate the emission shift of the maximum fluorescence value in each system; evaluate the fluorescence spectrum of the fluorescent probe in different polar solvent conditions and obtain the final spectrum through processing, such as figure 2 ; and obtain the emission maxima and solvent polarity parameters of the probe in different solvents (E T (30)), such as image 3 shown. from figure 2 A red shift in the fluorescence spectrum can be observed with increasing solvent polarity. The maximum emission wavelength measured in toluene was 454 nm, while that in DMSO was 495 n...
Embodiment 3
[0036] Example 3 Selectivity of fluorescent probes to different ions
[0037] Prepare 18 parts of 4 mL of 5 μM probe buffer solution (containing 1% 1,4-dioxane, PBS buffer solution), and then add 100 μL of 40 mM PBS solutions of different substances to the system. Fluorescence detection is then performed (λ ex =405 nm); Calculate the fluorescence intensity in each system; Evaluate the interference of the different substances on the fluorescent probe solution, the results are as follows Figure 4 Shown, where 1-18 are PBS solution, KI, CaCl 2 , FeSO 4 , Cys, CoCl 2 , MgCl 2 , Fe 2 (SO 4 ) 3 , NaF, CuSO 4, GSH, Hcy, TBHP, DBTP, H 2 o 2 , ZnCl 2 , Na 2 SO 3 , H 2 S. Depend on Figure 4 It can be seen that in solutions with the same polarity, the fluorescence emission of different substances is basically the same, and the probe is not interfered by ions under the same polarity.
PUM
 Abstract
Description
Claims
Application Information
 - Generate Ideas
- Intellectual Property
- Life Sciences
- Materials
- Tech Scout
- Unparalleled Data Quality
- Higher Quality Content
- 60% Fewer Hallucinations
Browse by: Latest US Patents, China's latest patents, Technical Efficacy Thesaurus, Application Domain, Technology Topic, Popular Technical Reports.
© 2025 PatSnap. All rights reserved.Legal|Privacy policy|Modern Slavery Act Transparency Statement|Sitemap|About US| Contact US: help@patsnap.com