Method and system for evaluating cardiac ischemia based on heart rate fluctuations

a heart rate fluctuation and cardiac ischemia technology, applied in the field of non-invasive high-resolution diagnostics of cardiac ischemia, can solve the problems of less accurate predictors of cardiac electrical instability, qt interval dispersion is linked with risk of arrhythmia, and type of hysteresis phenomenon is not useful in assessing cardiac muscle health or in assessing cardiac ischemia, etc., to achieve gradual increase of heart rate and low load level , the effect o

Inactive Publication Date: 2005-02-17
MEDIWAVE STAR TECH
View PDF35 Cites 23 Cited by
  • Summary
  • Abstract
  • Description
  • Claims
  • Application Information

AI Technical Summary

Benefits of technology

be used but are not essential. An advantage of the present invention is that its sensitivity allows both exercise procedures to be carried out at relatively low load levels that do not unduly increase the pulse rate of the subject. For example, the method may be carried out so that the heart rate of the subject during either the ascending or descending stage (or both) does not exceed about 140, 120, or even 100 beats per minute, depending upon the condition of the subject. Of course, data collected at heart rates above 100, 120, or 140 beats per minute may also be utilized if desired, again depending upon the condition of the subject.
For example, for an athletic or trained subject, for the first or ascending stage, a first load level may be selected to require a power output of 60 to 100 or 150 watts by the subject; an intermediate load level may be selected to require a power output of 100 to 150 or 200 watts by the subject; and a third load level may be selected to require a power output of 200 to 300 or 450 watts or more by the subject. For the second or descending stage, a first load level may be selected to require a power output of 200 to 300 or 450 watts or more by the subject; an intermediate or second load level may be selected to require a power output of 100 to 150 or 200 watts by the subject; and a third load level may be selected to require a power output of 60 to 100 or 150 watts by the subject. Additional load levels may be included before, after, or between all of the foregoing load levels as desired, and adjustment between load levels can be carried out in any suitable manner, including step-wise or continuously.
In a further example, for an average subject or a subject with a history of cardiovascular disease, for the first or ascending stage, a first load level may be selected to require a power output of 40 to 75 or 100 watts by the subject; an intermediate load level may be selected to require a power output of 75 to 100 or 150 watts by the subject; and a third load level may be selected to require a power output of 125 to 200 or 300 watts or more by the subject. For the second or descending stage, a first load level may be selected to require a power output of 125 to 200 or 300 watts or more by the subject; an intermediate or second load level may be selected to require a power output of 75 to 100 or 150 watts by the subject; and a third load level may be selected to require a power output of 40 to 75 or 100 watts by the subject. As before, additional load levels may be included before, after, or between all of the foregoing load levels as desired, and adjustment between load levels can be carried out in any suitable manner, including step-wise or continuously.
The heart rate may be gradually increased and gradually decreased by subjecting the patient to a predetermined schedule of stimulation. For example, the patient may be subjected to a gradually increasing exercise load and gradually decreasing exercise load, or gradually increasing electrical or pharmacological stimulation and gradually decreasing electrical or pharmacological stimulation, according to a predetermined program or schedule. Such a predetermined schedule is without feedback of actual heart rate from the patient. In the alternative, the heart rate of the patient may be gradually increased and gradually decreased in response to actual heart rate data collected from concurrent monitoring of said patient. Such a system is a feedback system. For example, the heart rate of the patient may be monitored during the test and the exercise load (speed and / or incline, in the case of a treadmill) can be adjusted so that the heart rate varies in a prescribed way during both stages of the test. The monitoring and control of the load can be accomplished by a computer or other control system using a simple control program and an output panel connected to the control system and to the exercise device that generates an analog signal to the exercise device. One advantage of such a feedback system is that (if desired) the control system can insure that the heart rate increases substantially linearly during the first stage and decreases substantially linearly during the second stage.
The generating step (f) may be carried out by any suitable means, such as by generating curves from the data sets (with or without actually displaying the curves), and then (i) directly or indirectly evaluating a measure (e.g., as defined in the integral theory) of the domain (e.g., area) inside the hysteresis loop, a greater measure indicating greater cardiac ischemia in said subject, (ii) directly or indirectly comparing the shapes (e.g., slopes or derivatives thereof) of the curves, with a greater difference in shape indicating greater cardiac ischemia in the subject; or (iii) combinations of (i) and (ii). Specific examples are given in Example 3-5 below.
The method of the invention may further comprise the steps of (e) comparing the measure of cardiac ischemia during exercise to at least one reference value (e.g., a mean, median or mode for the quantitative indicia from a population or subpopulation of individuals) and then (f) generating from the comparison of step (e) at least one quantitative indicium of cardiovascular health for said subject. Any such quantitative indicium may be generated on a one-time basis (e.g., for assessing the likelihood that the subject is at risk to experience a future ischemia-related cardiac incident such as myocardial infarction or ventricular tachycardia), or may be generated to monitor the progress of the subject over time, either in response to a particular prescribed cardiovascular therapy or simply as an ongoing monitoring of the cardiovascular physical condition of the subject for improvement or decline (again, specific examples are given in Example 3-5 below). In such a case, steps (a) through (f) above are repeated on at least one separate occasion to assess the efficacy of the cardiovascular therapy or the progress of the subject. A decrease in the difference between said data sets from before said therapy to after said therapy, or over time, indicates an improvement in cardiac health in said subject from said cardiovascular therapy. Any suitable cardiovascular therapy can be administered, including but not limited to, aerobic exercise, muscle strength building, change in diet, nutritional supplement, weight loss, smoking cessation, stress reduction, pharmaceutical treatment (including gene therapy), surgical treatment (including both open heart and closed heart procedures such as bypass, balloon angioplasty, catheter ablation, etc.) and combinations thereof.

Problems solved by technology

The authors report that QT interval dispersion is linked with risk for arrhythmias in patients with long QT syndrome.
However, QT interval dispersion alone, without simultaneous measurement of T-wave alternation, is said to be a less accurate predictor of cardiac electrical instability (U.S. Pat. No. 5,560,370 at column 6, lines 4-15).
Therefore, this type of hysteresis phenomenon would not be useful in assessing the health of the cardiac muscle itself, or in assessing cardiac ischemia.
Despite a broad clinical acceptance and the availability of computerized Holter monitor-like devices for automatic ST-segment data processing, the diagnostic value of this method is limited due to its low sensitivity and low resolution.
Since the approach is specifically reliable primarily for ischemic events associated with relatively high coronary artery occlusion, its widespread use often results in false positives, which in turn may lead to unnecessary and more expensive, invasive cardiac catheterization.
Relatively low sensitivity and low resolution, which are fundamental disadvantages of the conventional ST-segment depression method, are inherent in such methods being based on measuring an amplitude of a body surface ECG signal, which signal by itself does not accurately reflect changes in an individual cardiac cell's electrical parameters normally changing during an ischemic cardiac event.
An accurate and faultless discrimination of such changes is still a challenging signal processing problem.

Method used


Image

  • Method and system for evaluating cardiac ischemia based on heart rate fluctuations
  • Method and system for evaluating cardiac ischemia based on heart rate fluctuations
  • Method and system for evaluating cardiac ischemia based on heart rate fluctuations

Examples


example 1

Testing Apparatus

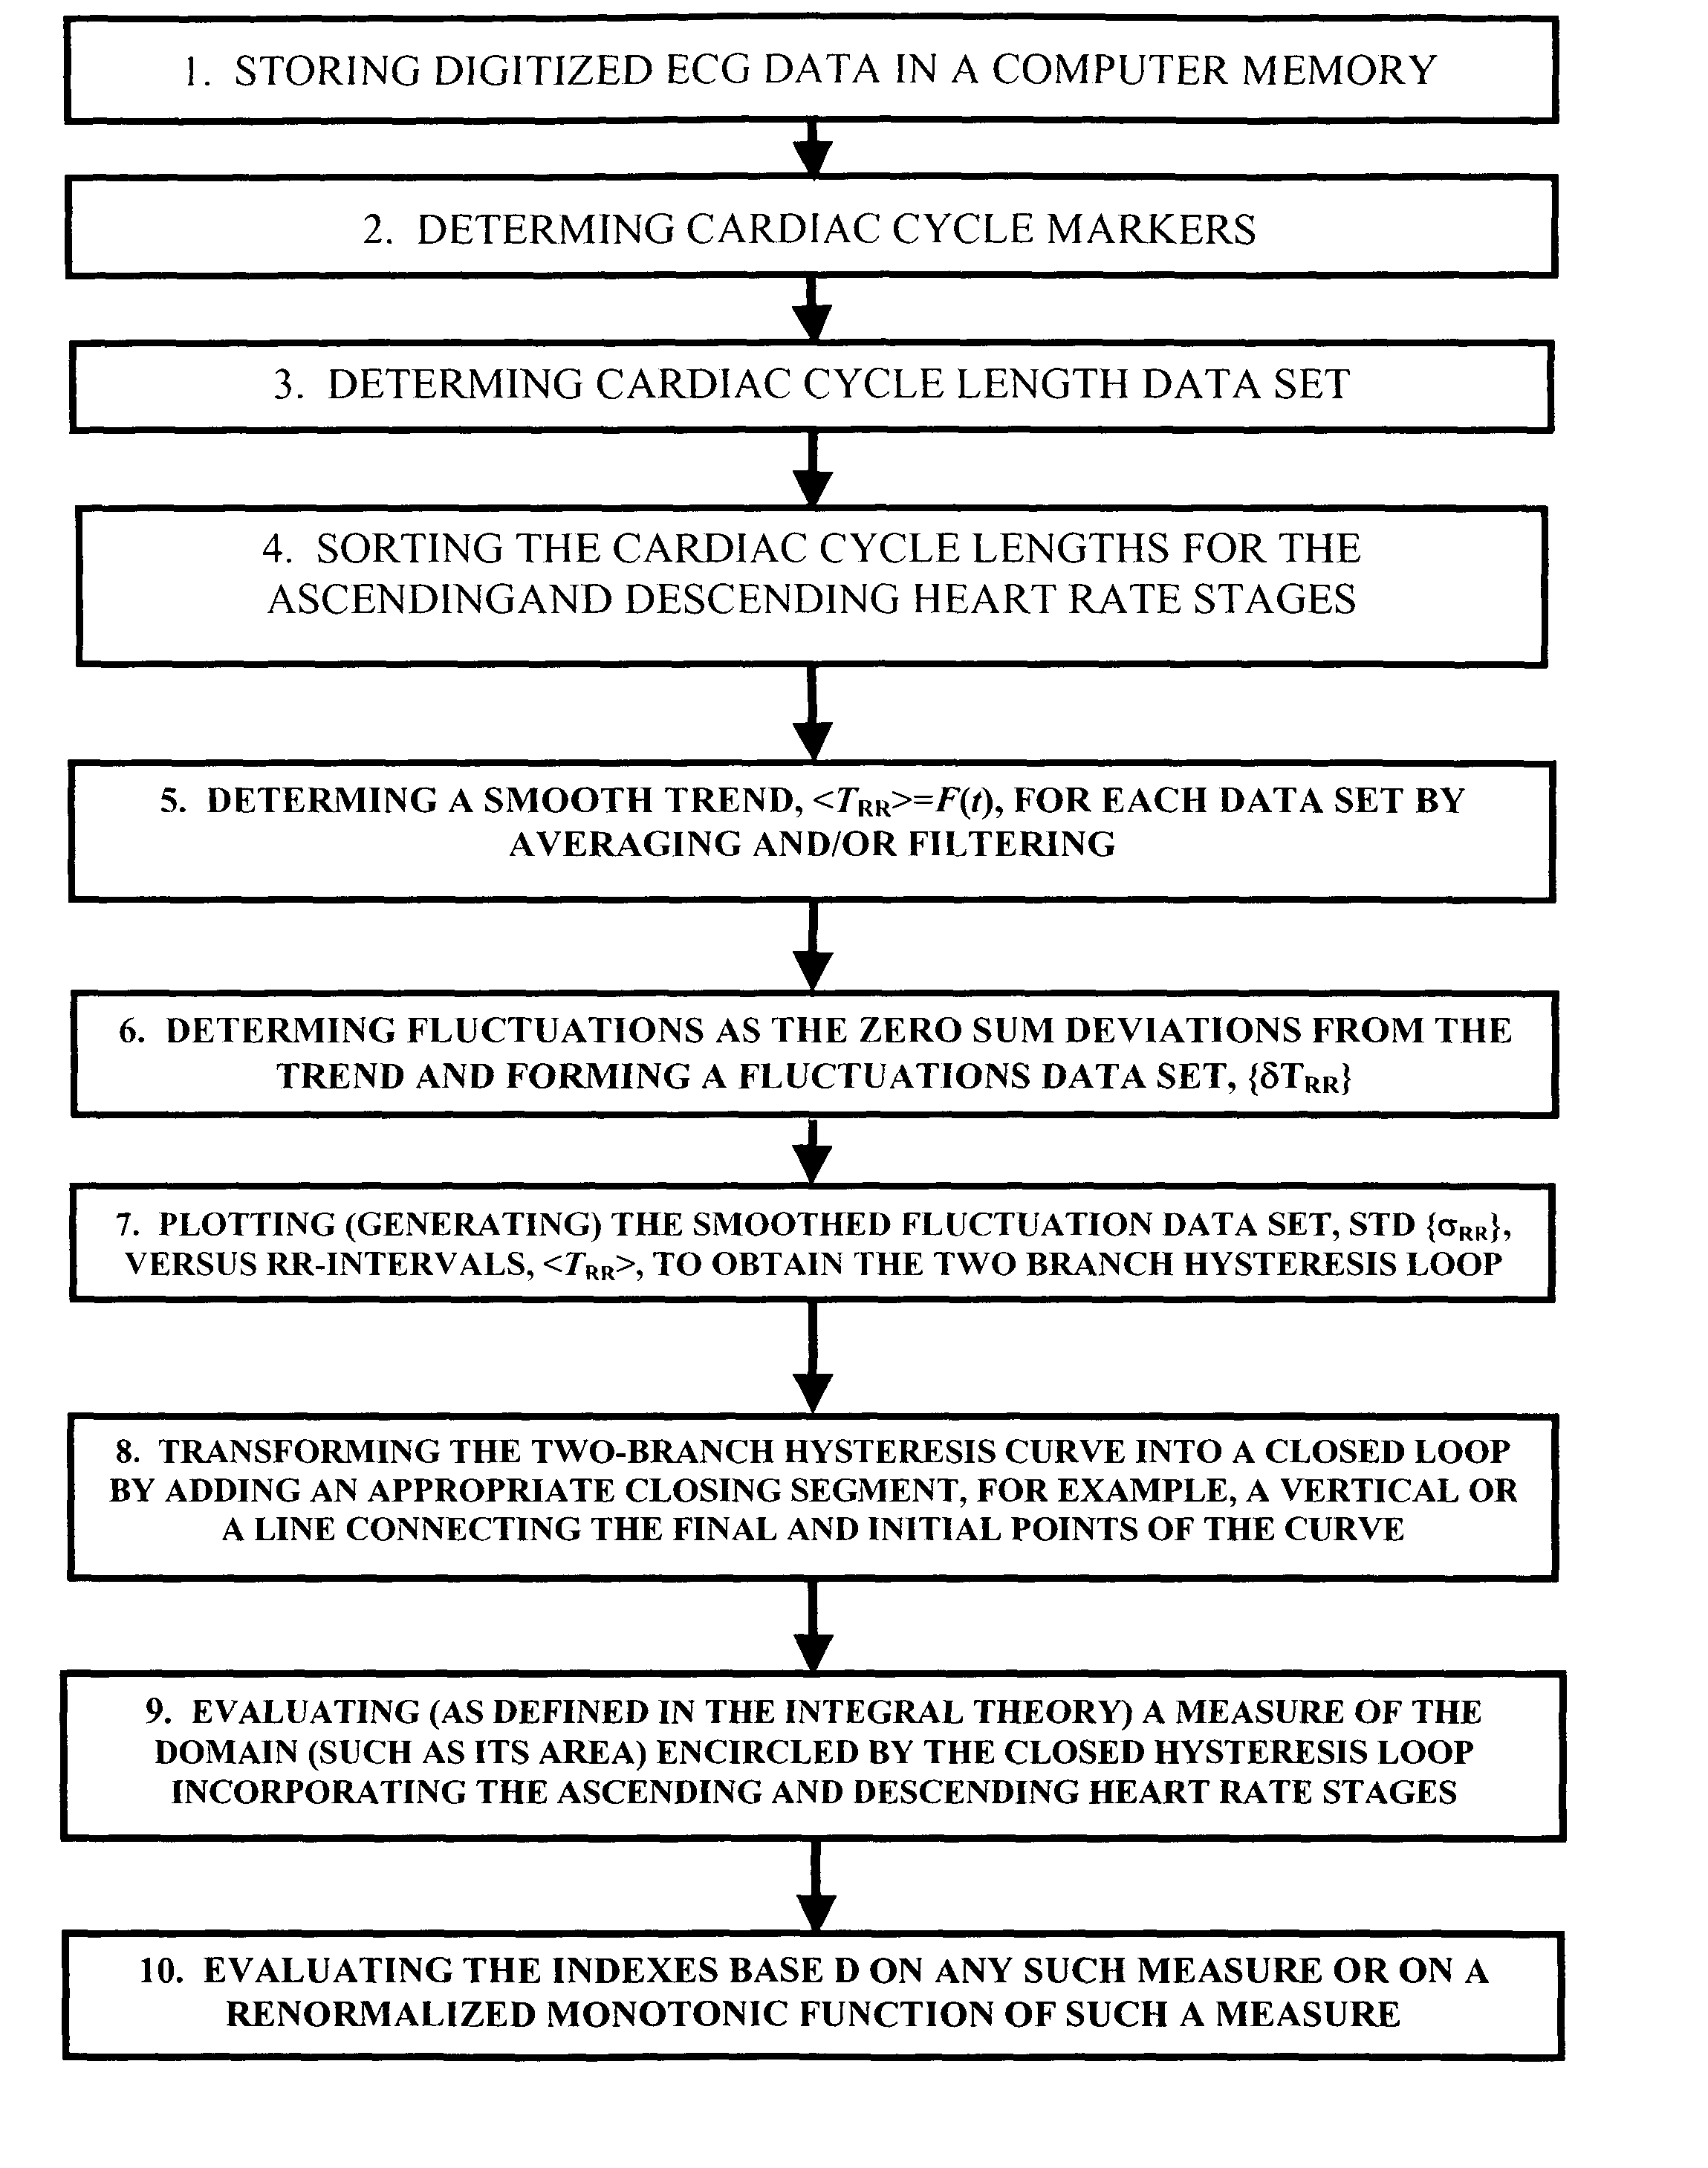
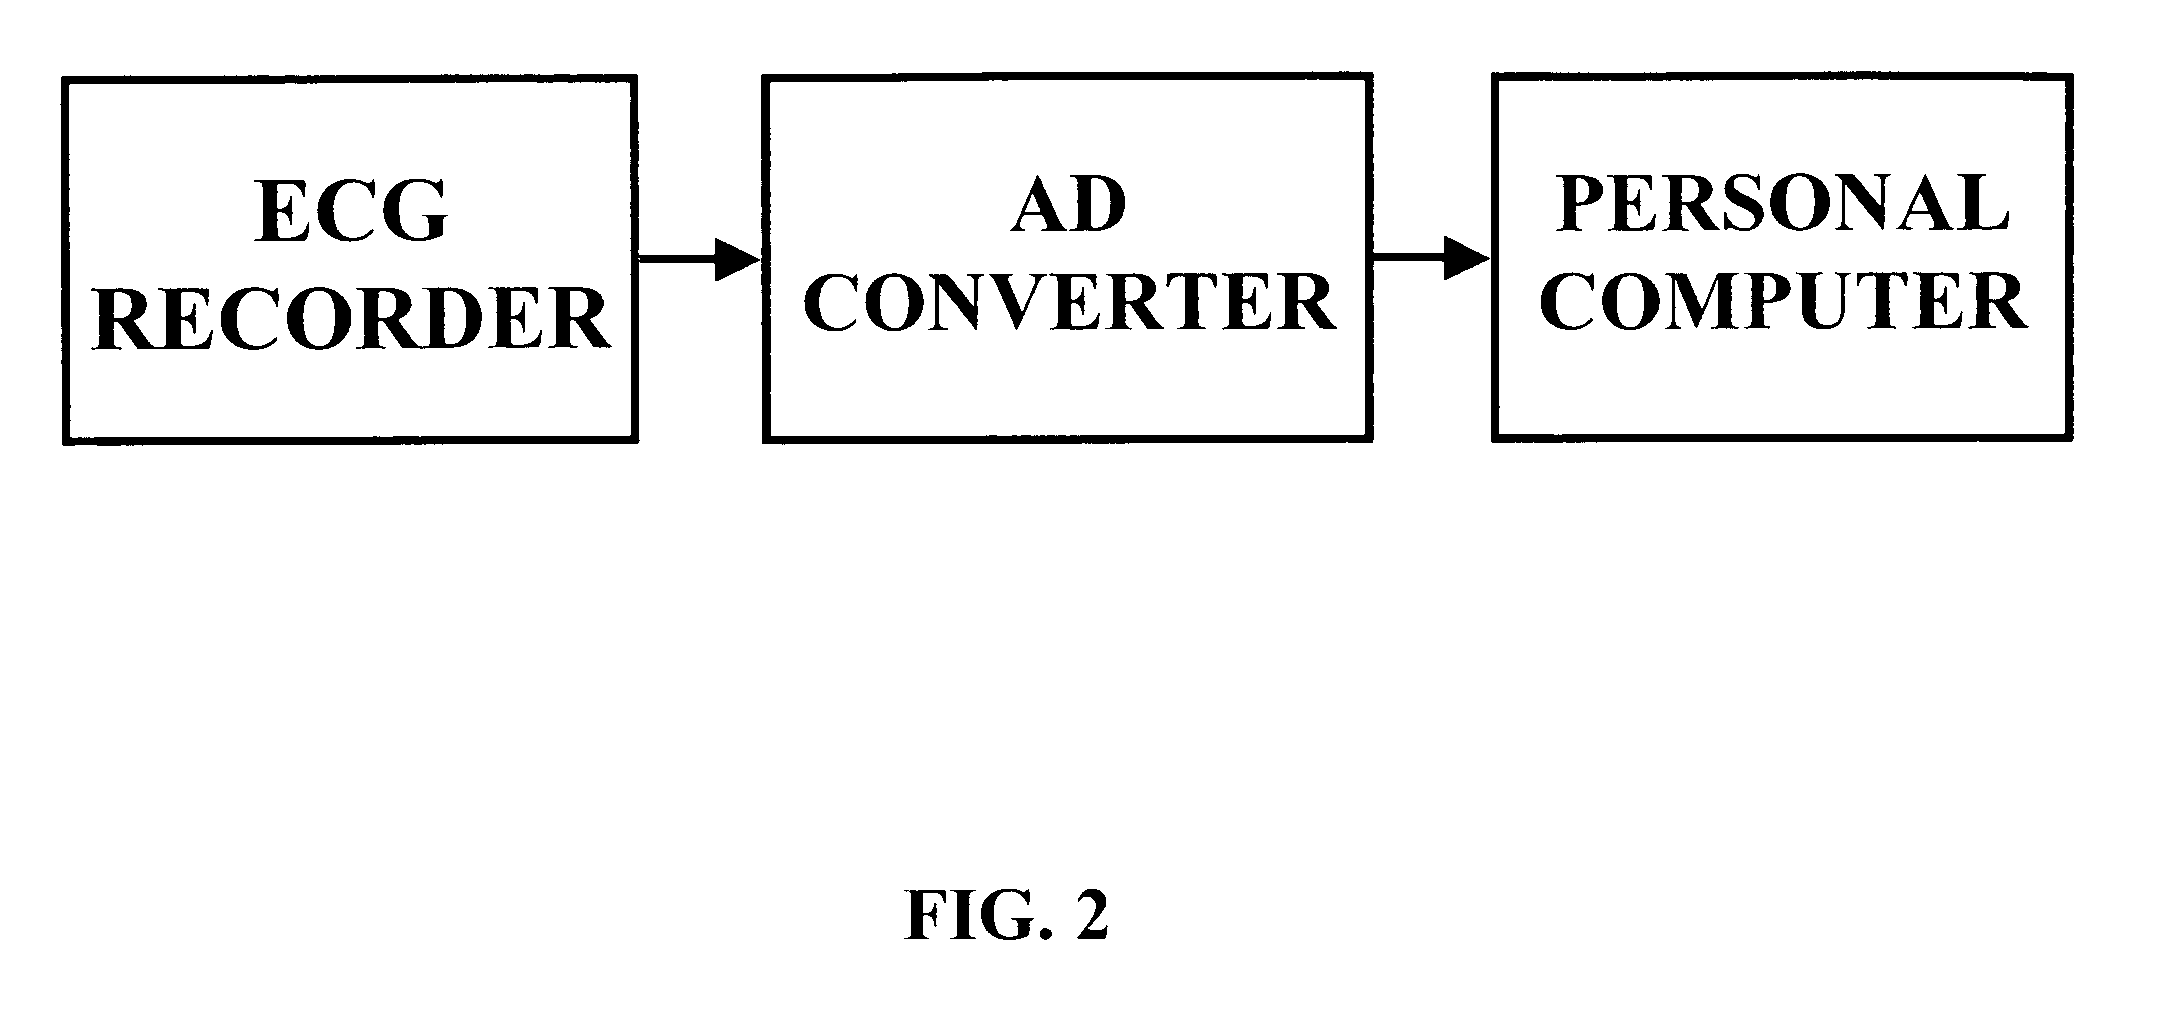
A testing apparatus consistent with FIG. 2 was assembled. The electrocardiograms are recorded by an RZ152PM12 Digital ECG Holter Recorder (ROZINN ELECTRONICS, INC.; 71-22 Myrtle Av., Glendale, N.Y., USA 11385-7254), via 12 electrical leads with Lead-Lok Holter / Stress Test Electrodes LL510 (LEAD-LOK, INC.; 500 Airport Way, P.O. Box L, Sandpoint, Id., USA 83864) placed on a subject's body in accordance with the manufacturer's instructions. Digital ECG data are transferred to a personal computer (Dell Dimension XPS T500 MHz / Windows 98) using a 40 MB flash card (RZFC40) with a PC 700 flash card reader, both from Rozinn Electronics, Inc. Holter for Windows (4.0.25); waveform analysis software is installed in the computer, which is used to process computer based waveform analyzer software. The hysteresis loop for each tested subject and an indicium that provides a quantitative characteristic of the extent of cardiac ischemia in said subject are then computed manually or...

example 2

An Alternative Testing Apparatus

A testing apparatus consistent with FIG. 3 was assembled. Experimental data were collected during an exercise protocol programmed in a Landice L7 Executive Treadmill in the way as described in Example 1. Instead of using a Digital ECG Holter Recorder, the instantaneous heart rate during exercise was directly measured using a Polar S810 heart rate monitor (Polar Electro Inc., 370 Crossways Park Dr., Woodbury,N.Y. 11797-2050). The Polar S810 heart rate monitor incorporates an analog-digital converter whose output is directly fed to a computer in which the data are stored as a digital array representing the cardiac cycle length data set. The hysteresis loop for each tested subject and an indicium that provides a quantitative characteristic of the extent of cardiac ischemia in said subject are then computed manually or automatically in the computer through a program implemented in Fortran 90 as illustrated in FIG. 5.

examples 3-5

Human RR-fluctuation Hysteresis Studies

These examples illustrate quasi-stationary ischemia-induced RR interval fluctuation hysteresis in different human subjects. These data indicate that the method possesses a potential for high sensitivity and high resolution.


PUM


Abstract

A method of assessing cardiac ischemia in a subject to provide a measure of cardiovascular health in that subject is described. In general, the method comprises the steps of: (a) collecting a first RR-interval data set from the subject during a stage of gradually increasing heart rate; (b) collecting a second RR-interval data set from the subject during a stage of gradually decreasing heart rate (e.g., after an abrupt stop in exercise; during a stage of gradually decreasing exercise load; etc.); (c) separating fluctuations from a slow trend in the first RR-interval data set; (d) separating fluctuations from a slow trend in the second RR-interval data set; (e) comparing the fluctuations of the first RR-interval data set to the fluctuations of the second RR-interval data set to determine a difference between the fluctuation data sets; and (f) generating from the comparison of step (e) a measure of cardiac ischemia during stimulation in the subject, wherein a greater difference between the first and second data sets indicates greater cardiac ischemia and lesser cardiac or cardiovascular health in the subject.

Description

FIELD OF THE INVENTION The present invention relates to non-invasive high-resolution diagnostics of cardiac ischemia based on the processing of heart rate data collected via either body-surface electrocardiogram (ECG) or other pulse or blood pressure measuring devices. A quantitative measure of cardiac ischemia provided by the invention may simultaneously characterize both cardiac health itself and cardiovascular system health in general. BACKGROUND OF THE INVENTION Heart attacks and other ischemic events of the heart are among the leading causes of death and disability in the United States. In general, the susceptibility of a particular patient to heart attack or the like can be assessed by examining the heart for evidence of ischemia (insufficient blood flow to the heart tissue itself resulting in an insufficient oxygen supply) during periods of elevated heart activity. Of course, it is highly desirable that the measuring technique be sufficiently benign to be carried out withou...

Claims


Application Information

Patent Timeline
Patent Type & Authority Applications(United States)
IPC IPC(8): A61B5/352
CPCA61B5/0456A61B5/02405A61B5/352
Inventor STAROBIN, JOSEPH M.CHERNYAK, YURI B.
Owner MEDIWAVE STAR TECH
Why Eureka
Try Eureka