Classification of disease states using mass spectrometry data

a mass spectrometry and disease technology, applied in the field of comprehensive statistical, computational and visualization, can solve the problems of inability to detect, identify or quantify post-translational protein modifications in microarray analysis, difficult endeavor, and prior art not making it currently possible to carry out a massive parallel

Inactive Publication Date: 2005-03-03
ZHAO HONGYU +5
View PDF5 Cites 63 Cited by
  • Summary
  • Abstract
  • Description
  • Claims
  • Application Information

AI Technical Summary

Benefits of technology

It is another object of the present invention to provide methodology for utilizing mass spectroscopy data to identify peptide and protein biomarkers that can be used to optimally discriminate experimental from control samples—where the experimental samples may, for instance, be derived from patients with various diseases such as ovarian cancer.

Problems solved by technology

Additionally, microarray analysis is unable to detect, identify or quantify post-translational protein modifications which often play a key role in modulating protein function.
Because of their importance and the very high level of variability and complexity, the analysis of protein expression is as potentially exciting as it is a challenging task in life science research.
However, to conduct massively parallel analysis of thousands of proteins, over a large number of samples, in a reproducible manner so that logical decisions can be made based on qualitative and quantitative differences in protein content is an extremely challenging endeavor.
The prior art does not make it currently possible to carryout a massively parallel, quantitative analysis of the level of expression of tens of thousands of proteins, over a large number of samples, in a reproducible manner that approaches that of DNA microarray technology for mRNA expression.
Despite some of the results discussed above, traditional statistical methods for classification are not optimal or even appropriate for biomarker identification using mass spectrometry data.
However, the interpretation of PCA is not straightforward.
In the microarray data analysis context, Alter et al. use ‘Eigengenes’ to interpret the results of SVD analysis, however, this is not intuitive.
The use of multiple measurements in taxonomic problems.
As a result, they can be biased for large complex datasets.
On the other hand, model independent methods, e.g. CART (classification and regression trees), maybe highly variable due to the high dimensionality of the mass spectrometry data.
But upon our closer inspection of these studies, many of the identified biomarkers actually appear to arise from background noise, which suggests some systematic bias from non-biological variation in the dataset.
Additionally, all these studies reflect the neglected importance of data preprocessing and of appropriately interpreting large mass spectrometry datasets.
However, challenging statistical issues remain that often have not been well addressed in the existing work.

Method used


Image

  • Classification of disease states using mass spectrometry data
  • Classification of disease states using mass spectrometry data
  • Classification of disease states using mass spectrometry data

Examples


example 1

Biomarker Analysis of Serum Samples from Ovarian Cancer Versus Control Patients

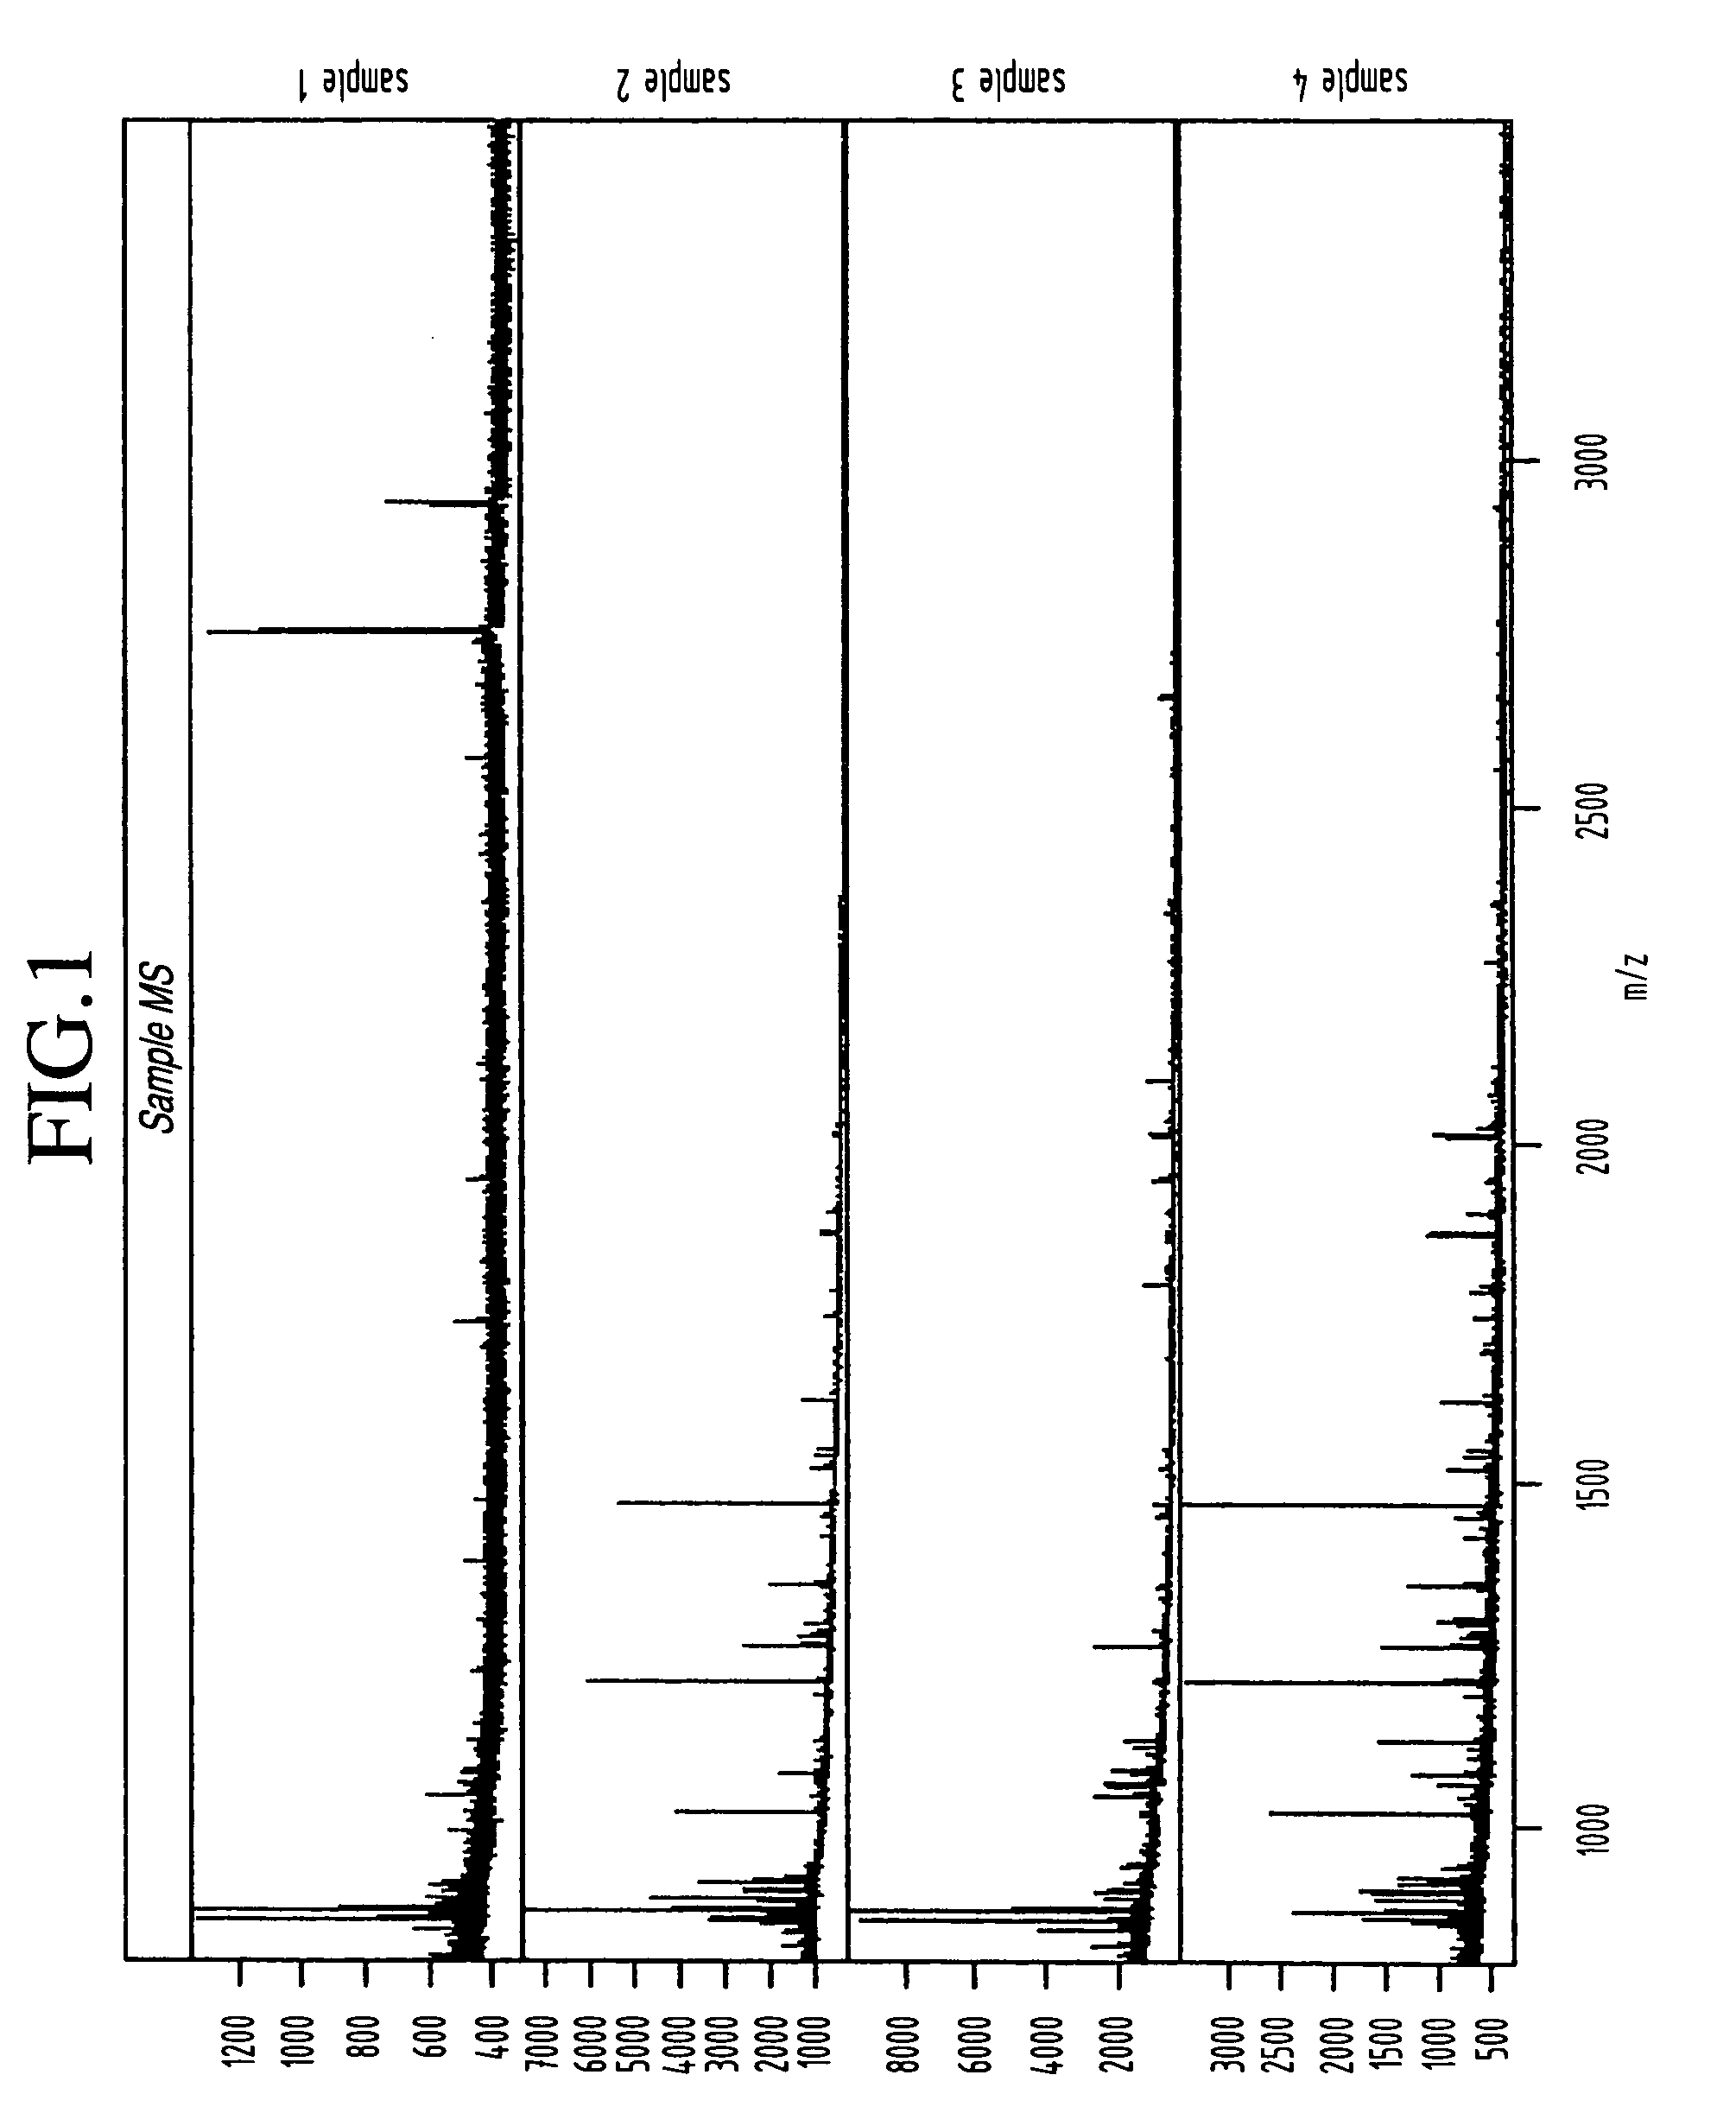
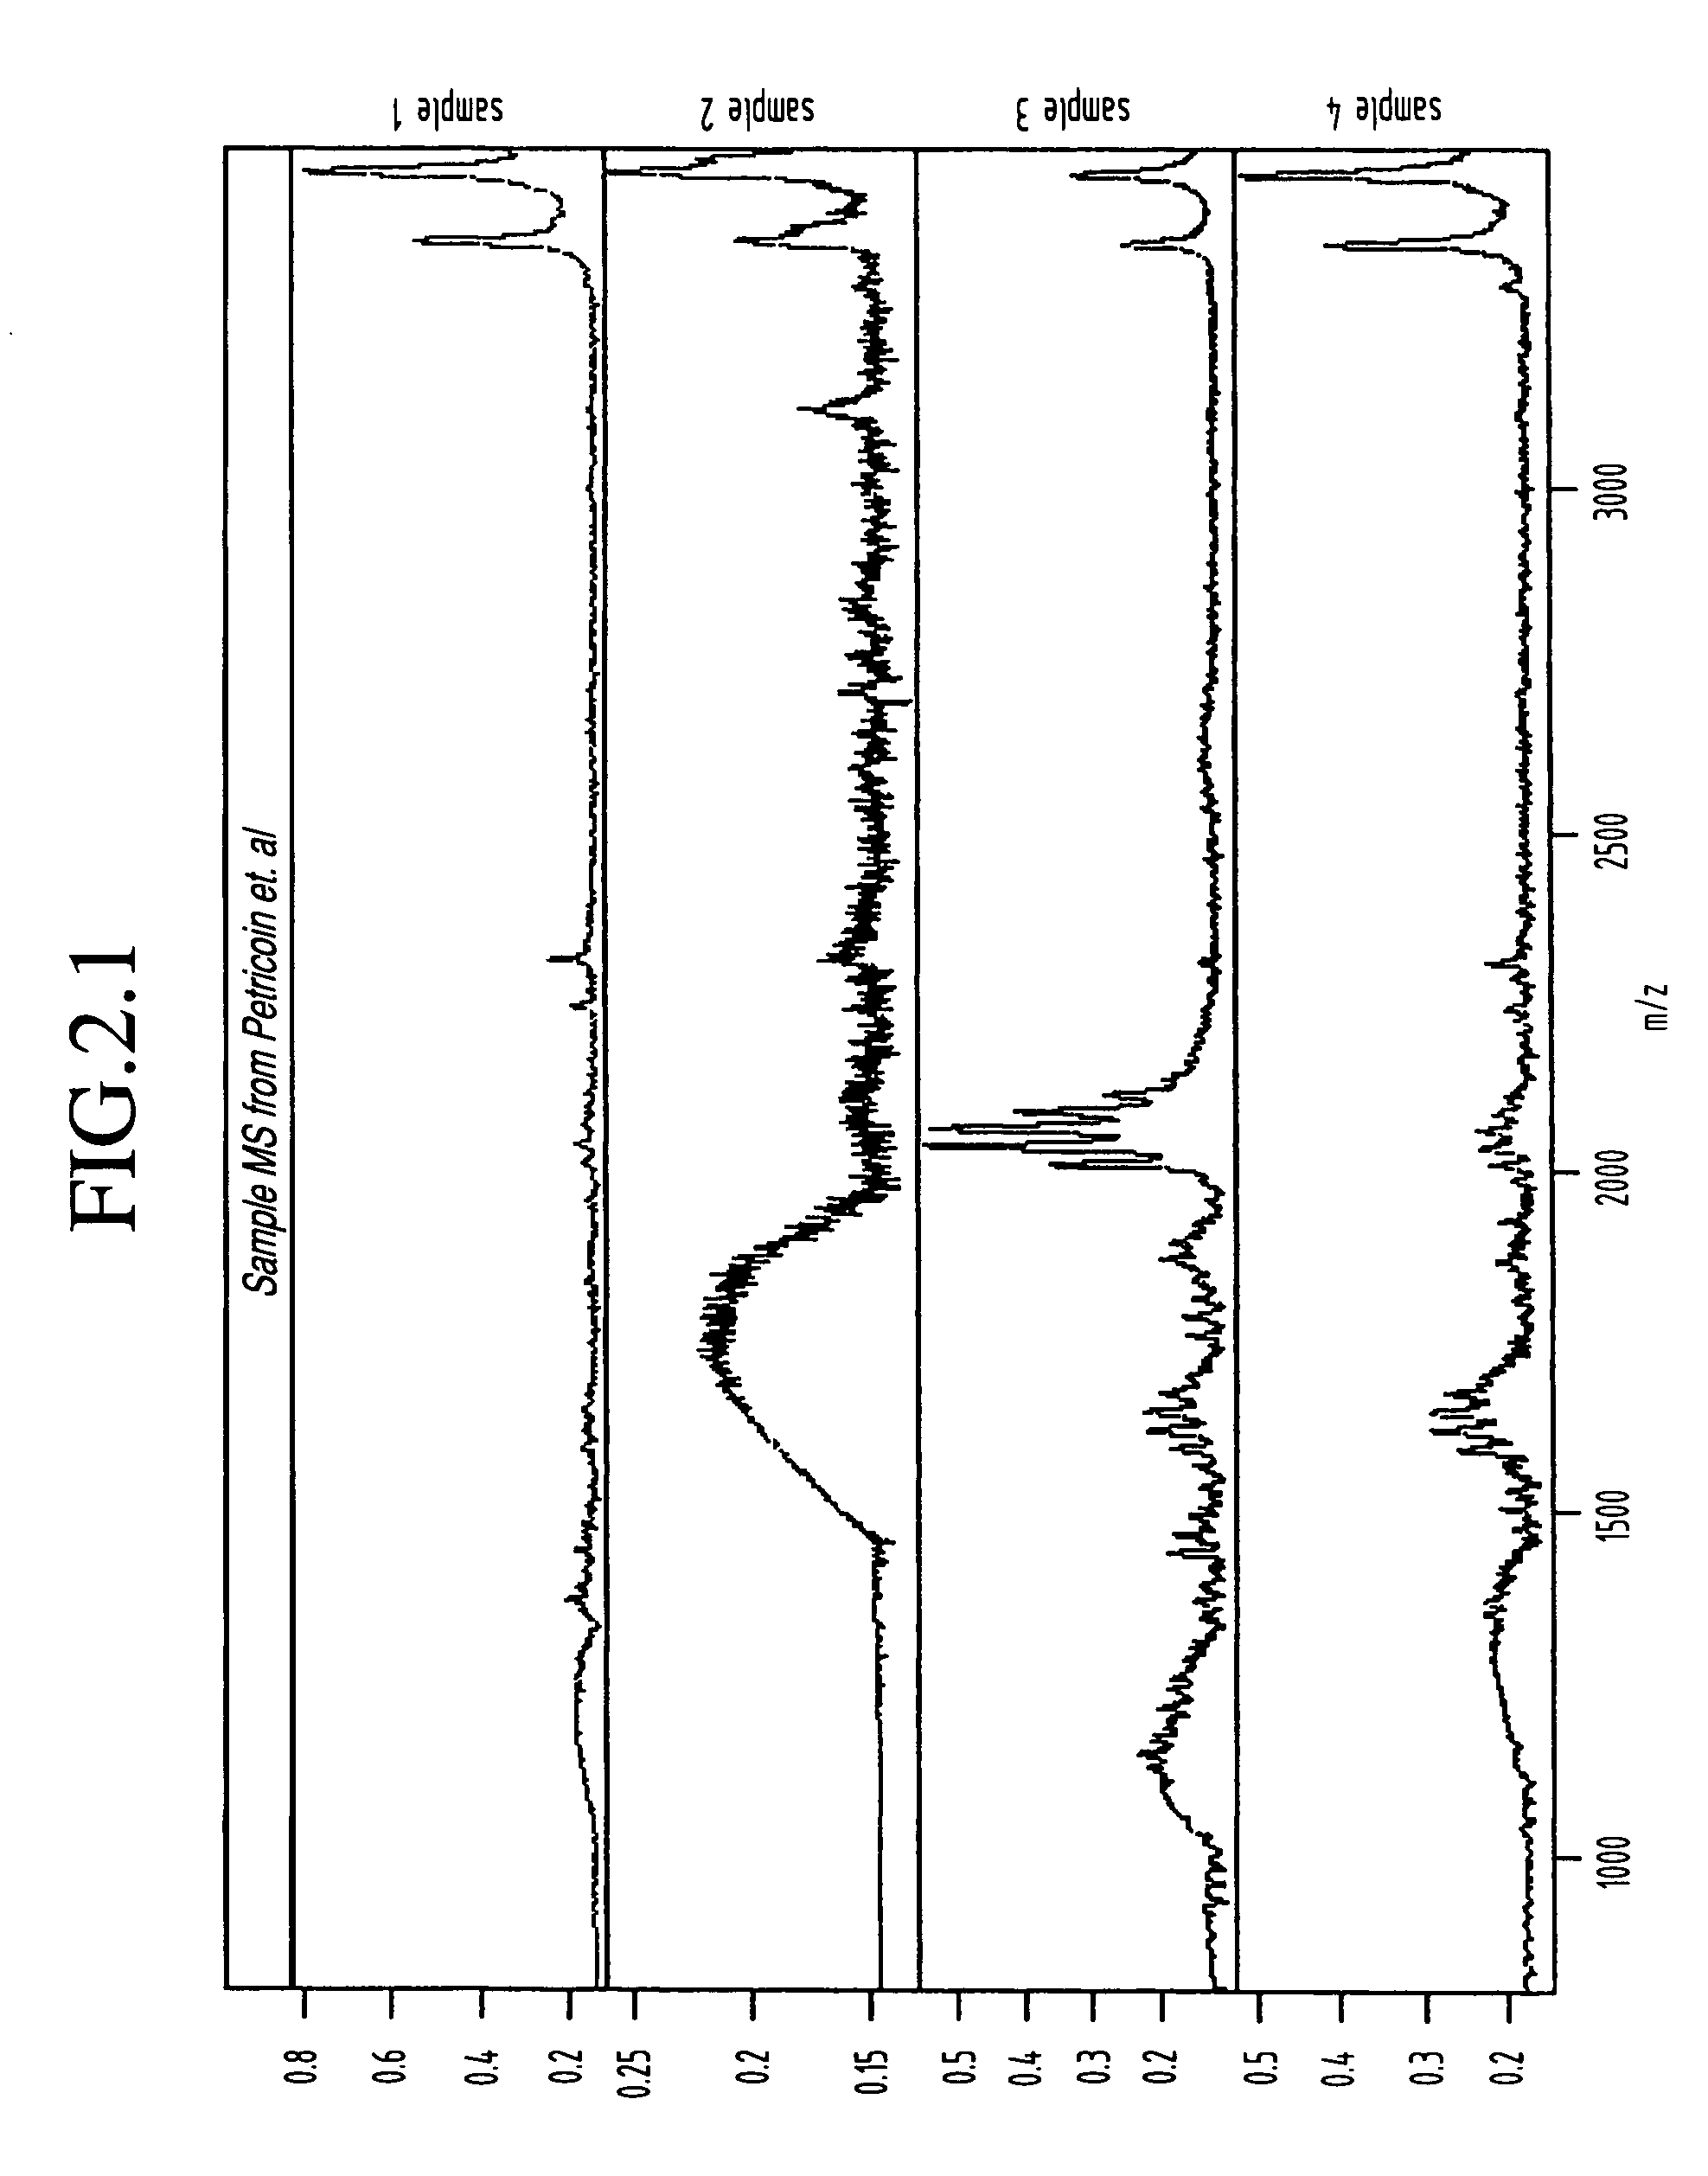
The 95 ovarian cancer and 92 control serum samples used in our analysis were obtained from the National Ovarian Cancer Early Detection Program at Northwestern University Hospital and correspond with some of the same samples that were used previously by Petricoin et al. As described above with reference to the experimental procedures, all samples were desalted via adsorption / elution from C18 ZipTips and were then subjected to MALDI-MS on a Micromass M@LDI-R instrument (note that at the time this data was acquired the Micromass M@LDI-R instrument had not yet been upgraded to the linear / reflectron (L / R) version) with all procedures being highly automated. The detailed protocol can be found in Appendix.

This data set consists of mass spectrometry spectra that were obtained on serum samples from 95 patients with ovarian cancer and 92 normal patients. These spectra extend from 800 to 3500 Da and were acquire...

example 2

In accordance with a preferred embodiment, the principles outlined above were applied. In particular, ovarian cancer and control serum samples were obtained from the National Ovarian Cancer Early Detection Program at Northwestern University Hospital. The Keck Laboratory then subjected these samples to automated desalting and MALDI-MS on a Micromass M@LDI-L / R instrument (as opposed to the Micromass M@LDI-R instrument used in Example 1) as described generally in Appendix A.

The M@LDI-L / R mass spectrometer automatically acquires two sets of data in positive ion detection mode. The mass range acquired is dependent on the mass analyzer being used, with 700-3500 Da for reflectron and 3450-28000 Da for linear. This dataset consists of merged mass spectrometry spectra that extend from 700 to 28000 Da and that were obtained on serum samples from 93 patients with ovarian cancer and 77 normal patients.

As mentioned above, Random Forest combines two powerful features: Bootstrap to produce ps...


PUM

PropertyMeasurementUnit
massaaaaaaaaaa
massaaaaaaaaaa
massaaaaaaaaaa

Abstract

A method for identification of biological characteristics is achieved by collecting a data set relating to individuals having known biological characteristics and analyzing the data set to identify biomarkers potentially relating to selected biological state classes. A system for identification of biological characteristics is also provided. A methodology is also provided for utilizing mass spectroscopy data to identify peptide and protein biomarkers that can be used to optimally discriminate experimental from control samples—where the experimental samples may, for instance, be derived from patients with various diseases such as ovarian cancer.

Description

BACKGROUND OF THE INVENTION 1. Field of the Invention The invention relates to a comprehensive statistical, computational, and visualization approach to identifying the naturally occurring forms of peptide and protein disease biomarkers from raw data collected from mass spectrometric (MS) instruments. More particularly, the invention employs background subtraction, spectrum alignment (registration), peak identification, normalization, and outlier detection. The disease biomarker identification uses a customized Random Forest algorithm to search for features that show distinct patterns among different classes of samples. 2. Description of the Prior Art DNA microarray analysis offers a breakthrough and massively parallel approach to genome-wide expression analysis that, for many purposes, is unfortunately directed at the wrong biological molecule. Differential rates of translation of mRNAs into protein and differential rates of protein degradation in vivo are two factors that conf...

Claims


Application Information

Patent Timeline
Patent Type & Authority Applications(United States)
IPC IPC(8): C12Q1/68G01NG01N33/48G01N33/50G06F19/00G16B40/10H01J49/04
CPCH01J49/00G06F19/24G16B40/00Y02A90/10G16B40/10
Inventor ZHAO, HONGYUWILLIAMS, KENNETH R.WU, BAOLINSTONE, KATHRYNMCMURRAY, WALTERABBOTT, THOMAS
Owner ZHAO HONGYU
Why Eureka
Try Eureka