Methods and compositions for the treatment of viral infections
a technology for viral infections and compositions, applied in the field of methods and compositions for treating viral infections, can solve the problems of difficult to achieve adequate patient compliance and relative long half-life, and achieve the effect of reducing the emergence of drug resistant strains and reducing the course and severity of the diseas
- Summary
- Abstract
- Description
- Claims
- Application Information
AI Technical Summary
Benefits of technology
Problems solved by technology
Method used
Image
Examples
example 1
In Vitro Method for Determining Optimal Steady-State Concentration Ratio (Cratio,ss)
[0091] A dose ranging study can be performed using, for example, plaque inhibition assay for drug susceptibility described by Hayden et al. (see Antimicrobial Agents and Chemotherapy (1980) 17(5):865-70). An isobolic experiment ensues in which the drugs are combined in fractions of their EDXXs to add up to ED100 (e.g., ED50:ED50 or ED25:ED75). The plot of the data is constructed. The experiment points that lie below the straight line between the ED50 points on the graph are indicative of synergy, points on the line are indicative of additive effects, and points above the line are indicative of inhibitory effects. The point of maximum deviation from the isobolic line is the optimal ratio. This is the optimal steady state ratio (Cratio,ss) and is adjusted based upon the agents half-life. Similar protocols may be applied in a wide variety of validated models.
example 2
Combinations of an M2 Inhibitor and a Neuraminidase Inhibitor
[0092] Representative combination ranges and ratios are provided below for compositions of the invention. The ranges given in Table 3 are based on the formulation strategies described herein.
TABLE 3Adult Dosage and Ratios for Combination TherapyNeuraminidase inhibitor Quantity, mg / day / (Neuraminidase inhibitor:M2 inhibitor Ratio Range)Zanamivir / M2 inhibitor mg / dayOseltamivir / TAMIFLU ®RELENZA ®Amantadine 50-40075-150 / (0.38-3.0)10-20 / (0.5-0.4) Rimantadine 50-20075-150 / (0.19-3.0)10-20 / (0.025-0.4)
example 3
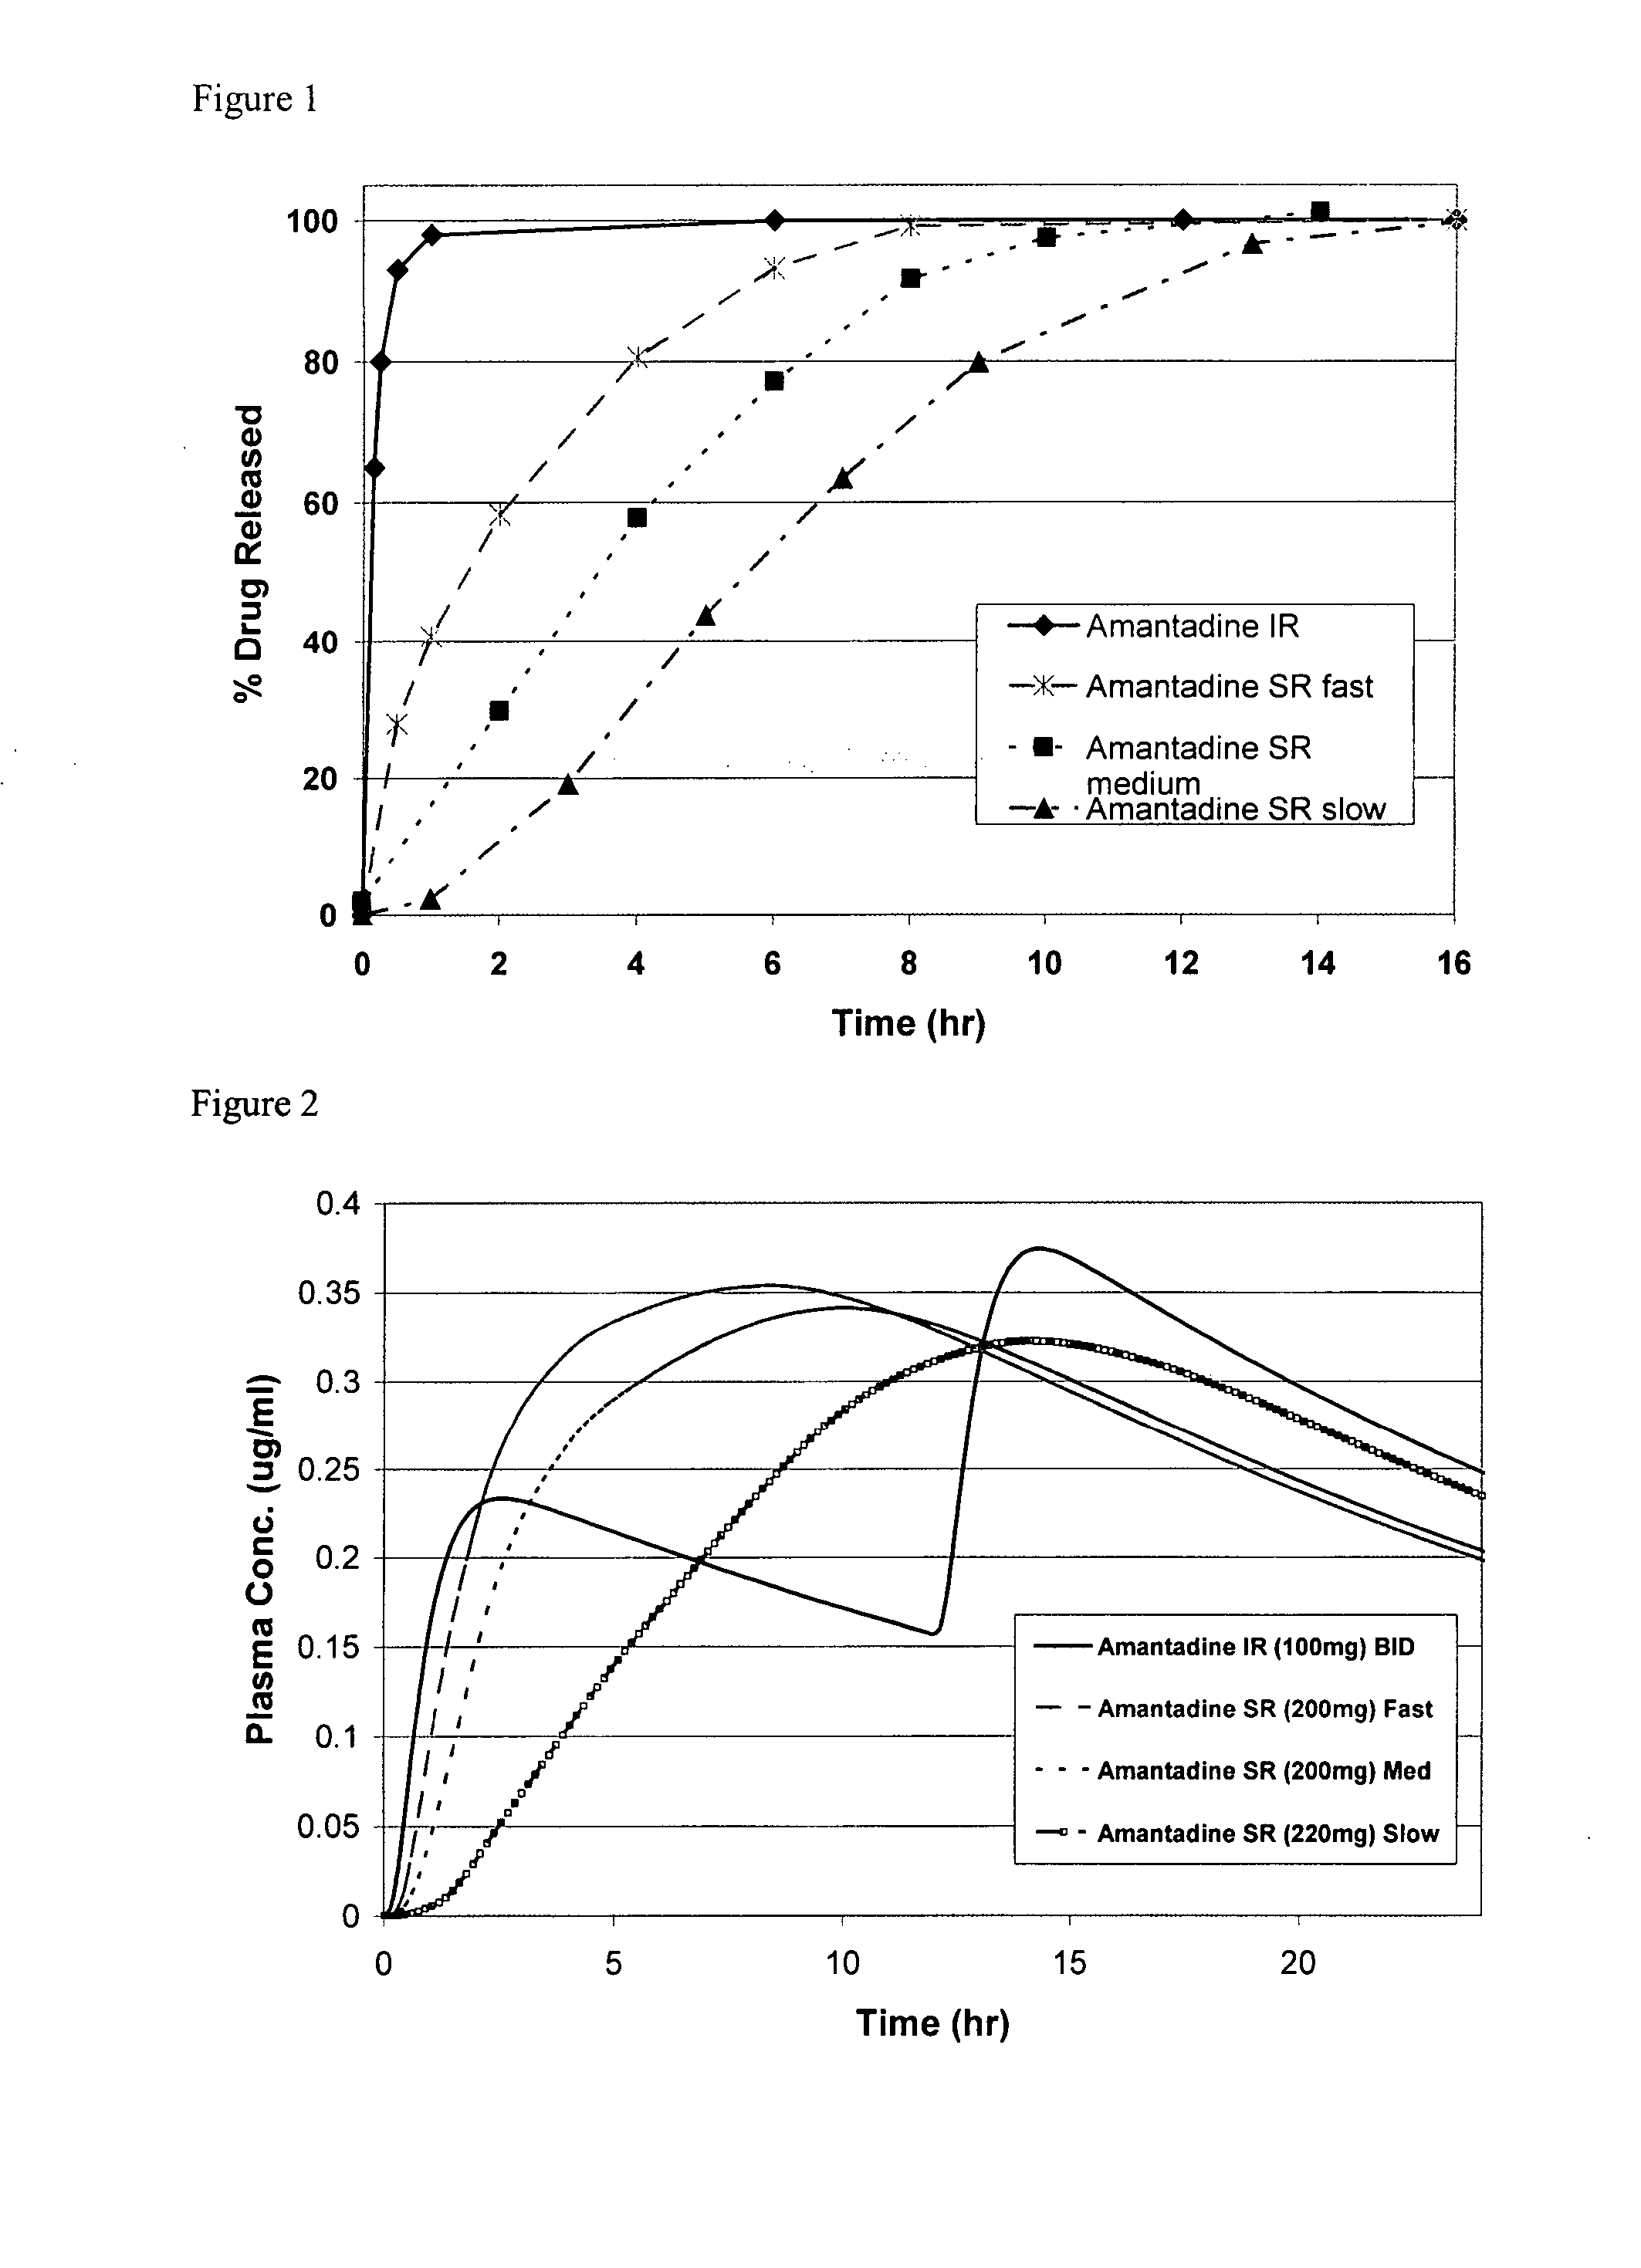
Release Profile of Amantadine and Oseltamivir
[0093] Release proportions are shown in Table 4 below for a combination of amantadine and oseltamivir. The cumulative fraction is the amount of drug substance released from the formulation matrix to the serum or gut environment (e.g., U.S. Pat. No. 4,839,177) or as measured with a USP II Paddle system using water as the dissolution medium.
TABLE 4Release profile of amantadine and oseltamivirAmantadineOseltamivirT½ = 15 hrsT½ = 3 hrsTimecum. fraction ACum. Fraction B10.20.120.30.1540.40.280.50.35120.60.5160.70.65200.80.8240.91
PUM
| Property | Measurement | Unit |
|---|---|---|
| length of time | aaaaa | aaaaa |
| length of time | aaaaa | aaaaa |
| average diameter | aaaaa | aaaaa |
Abstract
Description
Claims
Application Information
 - R&D
- Intellectual Property
- Life Sciences
- Materials
- Tech Scout
- Unparalleled Data Quality
- Higher Quality Content
- 60% Fewer Hallucinations
Browse by: Latest US Patents, China's latest patents, Technical Efficacy Thesaurus, Application Domain, Technology Topic, Popular Technical Reports.
© 2025 PatSnap. All rights reserved.Legal|Privacy policy|Modern Slavery Act Transparency Statement|Sitemap|About US| Contact US: help@patsnap.com

