A fundamental issue, during the acquisition of dynamic MR-data, is the compromise between spatial and
temporal resolution.
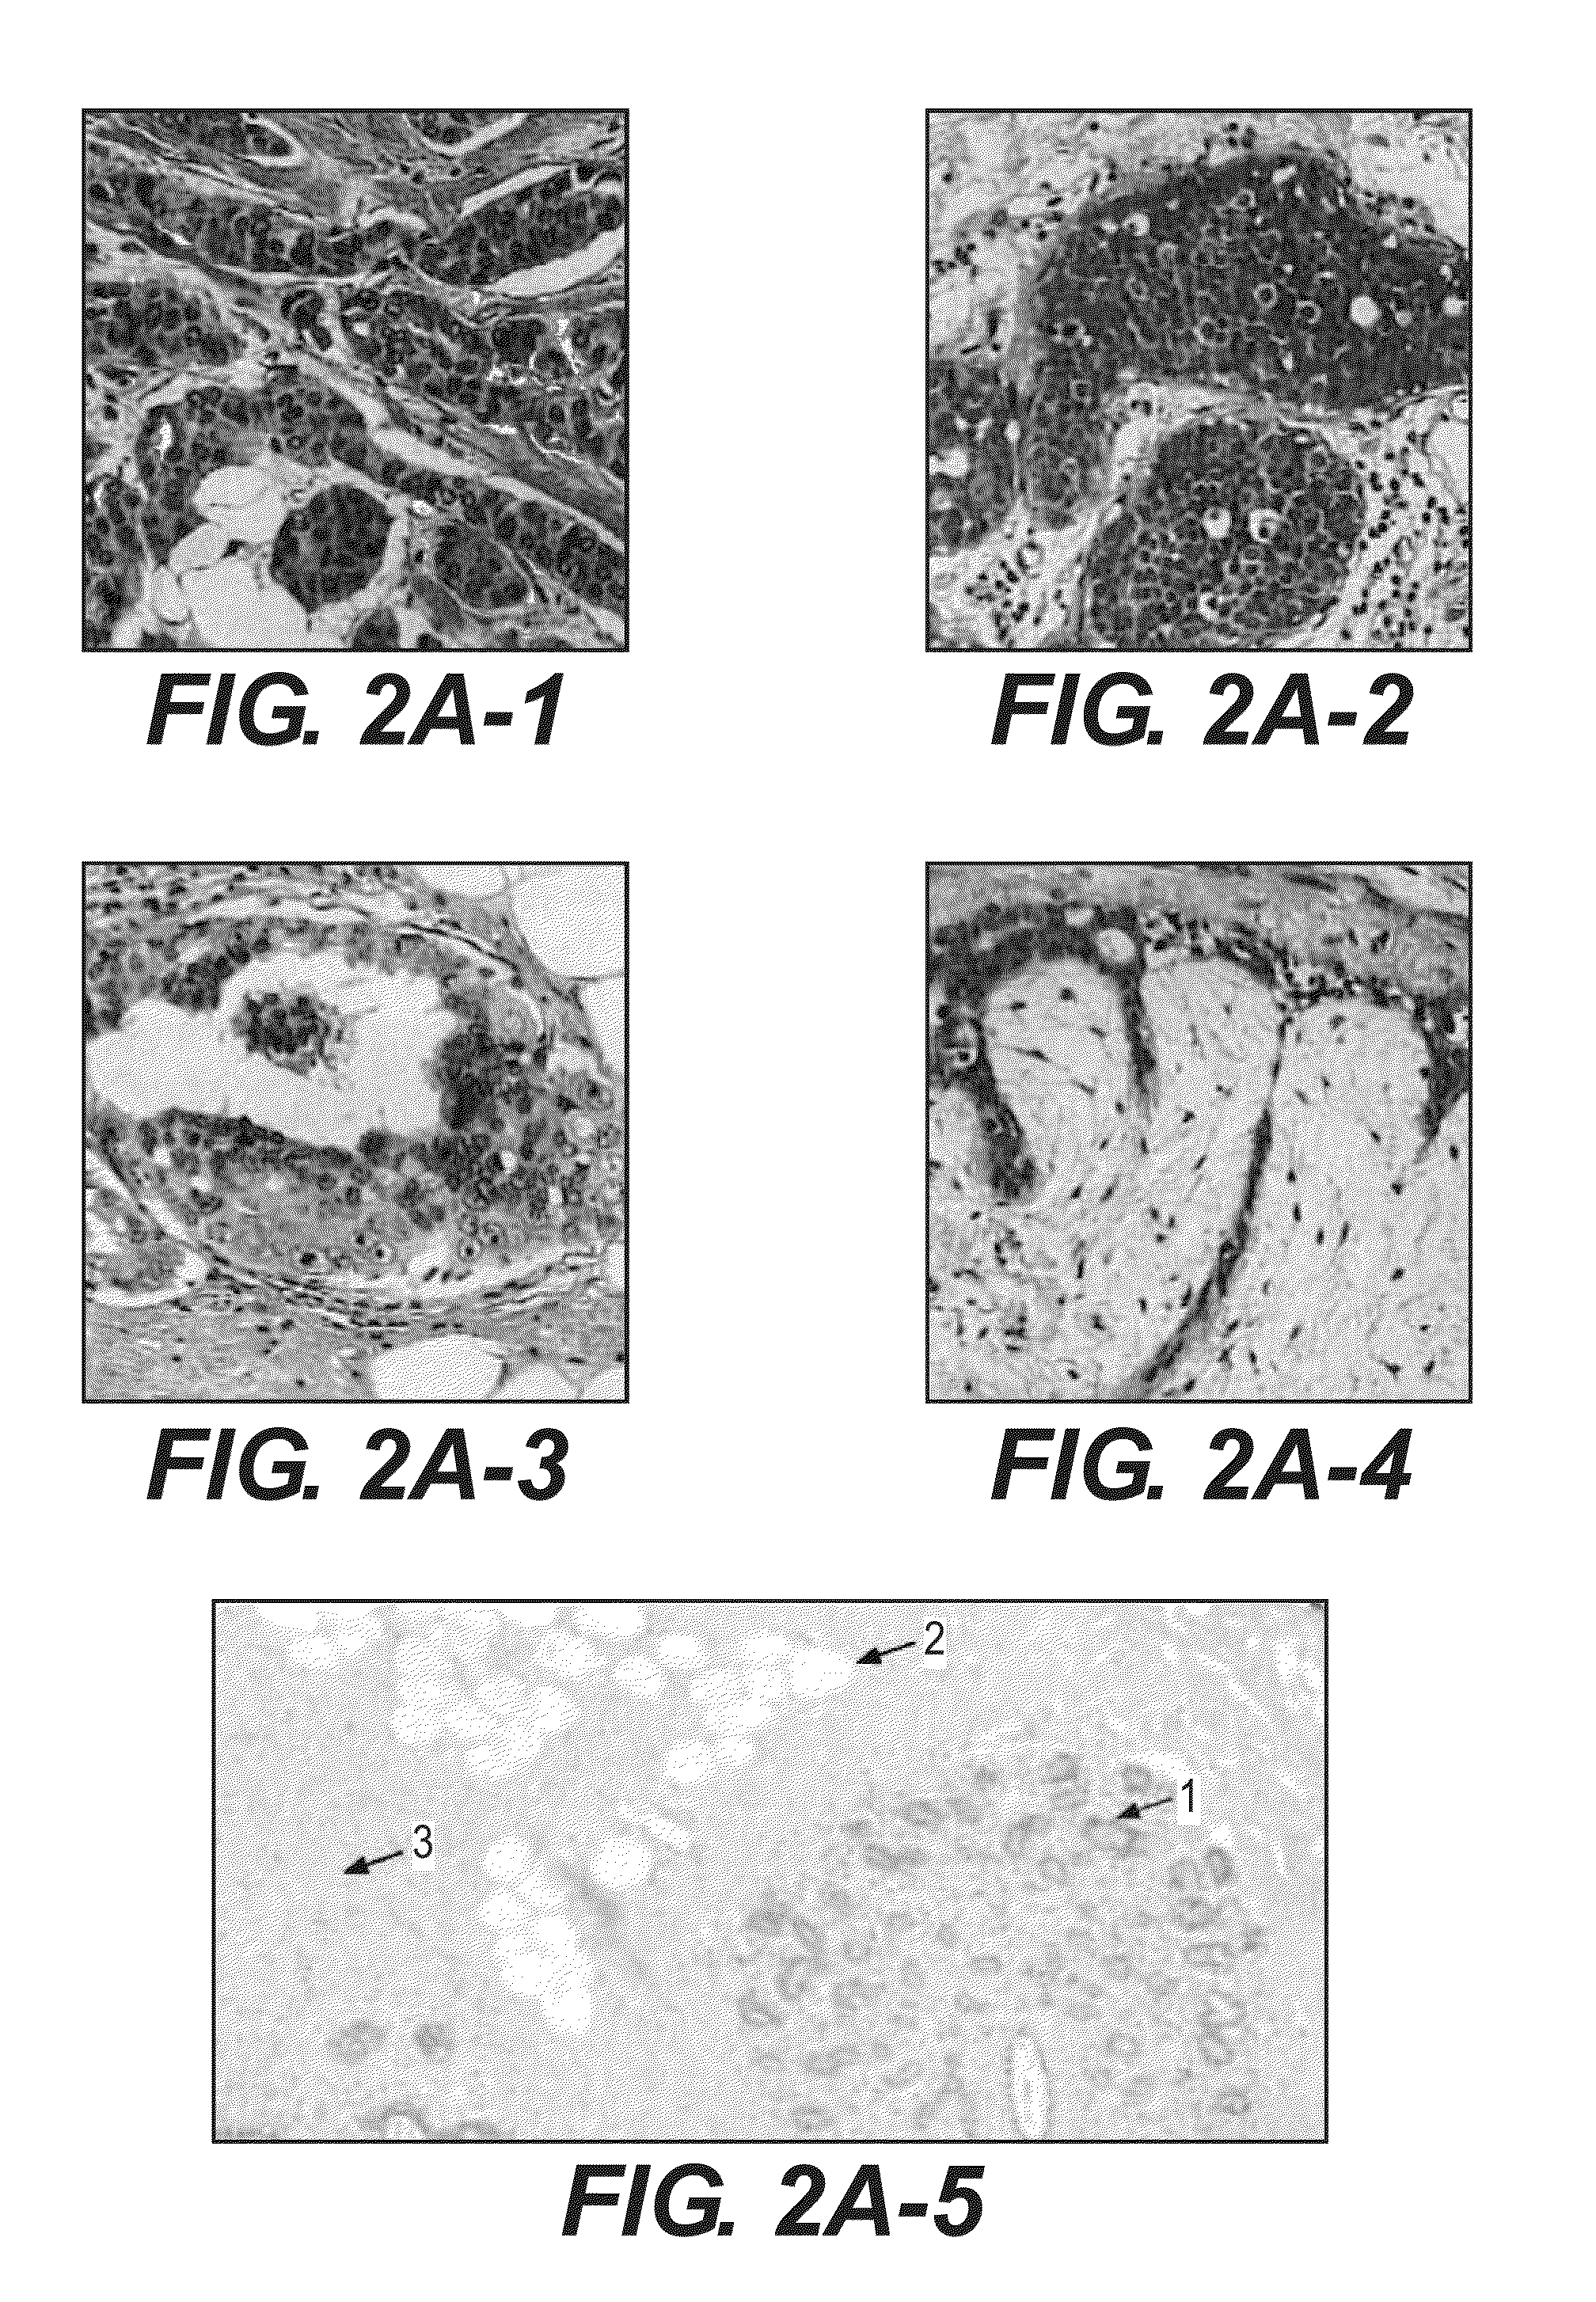
The analysis of
group strategy 2 is performed mainly using fibroadenomas and invasive ductal carcinomas since the two relics groups were not considered statistically robust.
Contribution from
normal tissue can result in errors estimating the different tumor bio-markers.
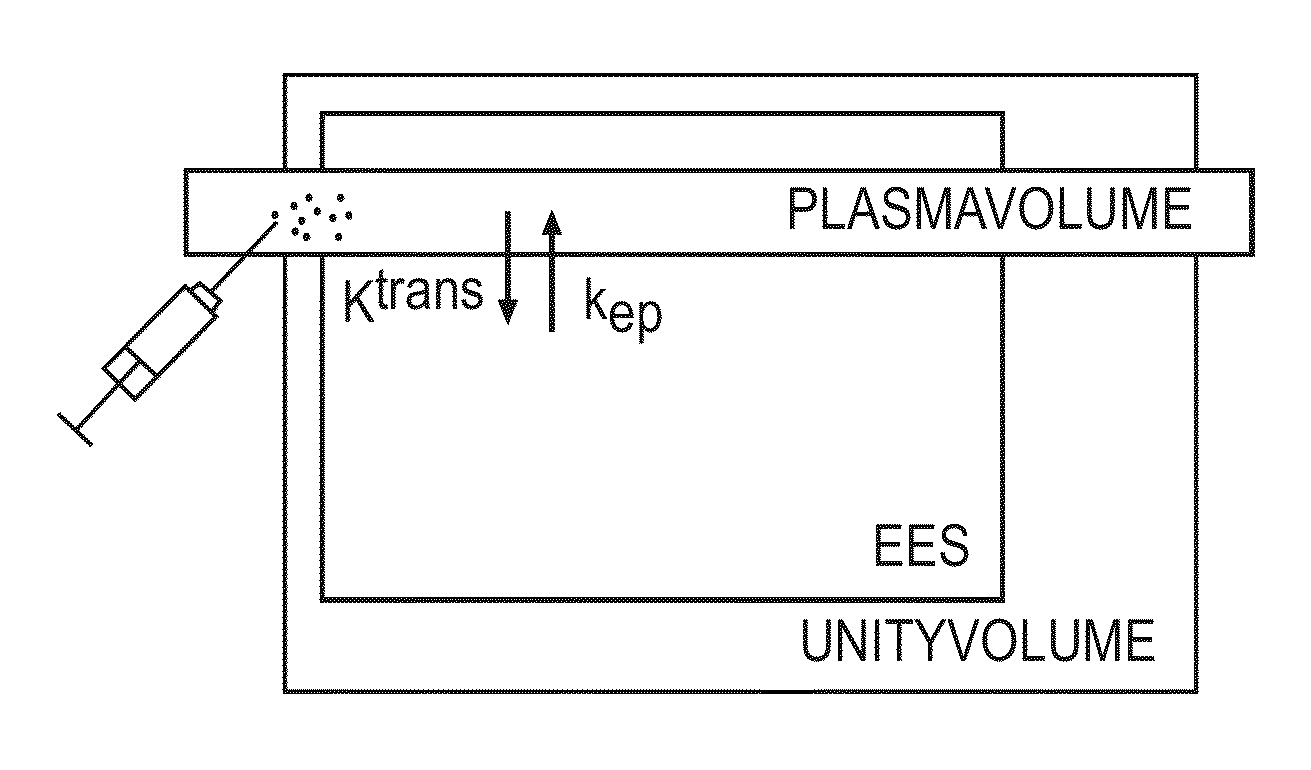
The provision of an individual AIF is often very difficult, and errors in the measured AIF will be transferred to the error in the estimated pharmacokinetic biomarkers.
In reality, however, there exists a
delay between the AIF and the arrival of the contrast agent in the tissue.
The CD between registered AIF
signal and VOI-
signal is a source of error as previous investigators have been aware of, but that is not corrected for in conventional practice.
Equation (3-5) contains many model variables which can lead to unrealistic estimates of the pharmacokinetic biomarkers.
This can only be achieved by using sequences with sufficient
temporal resolution to detect the contrast agent arrival and passage of the arterial
system.
The realization of the necessary
temporal resolution will be at the expense of the sequence's spatial resolution, which in turn increases the dimensional requirements for the included arteries.
As a result of low spatial resolution, the
signal in the arterial voxels is affected by partial
volume effect (PVE), which in practice will result in an underestimation of the amplitude of the
plasma curve.
PVE, together with arterial motion in the dynamic series, the inflow effects and flow artifacts, will reduce the AIF curve accuracy, thereby increasing the uncertainty of the estimated biomarkers.
An accurate determination of the AIF is often problematic and represents an active field of research.
Any errors in the applied AIF will be cancelled in this operation, since this error is evident in both tissues.
However, several investigators have identified problems by the use of the Wald statistics.
As an example, at high coefficient values, the standard error is inflated, resulting in a reduced Wald statistical value.
However, biomarker AUC demonstrates large overlap in both grouping strategies.
In this study it is found that there is a significant contrast
delay (CD), and that this can lead to
estimation errors and increased uncertainty of the models biomarker, if not corrected.
This means that an increase of CD-magnitude will provide an increased
estimation error of vp and ve.
However, the results suggest that the eventuality of CD will generate significant estimation errors of Ktrans and kep, and that the error estimation of Ktrans is increasingly affected by the CD-magnitude compared to kep.
In this study it is found that an adequate measurement of the AIF is often very difficult and, in some cases, unattainable.
However, this test says little about how predictive the biomarkers are.
However, the morphological assessments represent an insufficient
diagnostic accuracy, and additional methods are required.
However, this study is based only on the dynamic and pharmacokinetic biomarkers alone and do not include the morphological information obtained from the high-resolution images.
However, both the measurement process and
data analysis introduce an uncertainty in the estimation of the various biomarkers.
During
image processing it was found that the images spatial resolution is not as good as desired, and that the imaging
field of view (FOV) does not always include a distinct
artery.
This is a problem that is applicable to many patients and is especially problematic when the quantification of the pharmacokinetic biomarkers requires the provision of an individual AIF.
However, this
high temporal resolution implies of a substantial loss of sequence's spatial resolution, which demonstrates a
voxel size of 1.69*1.48*4 mm3.
This spatial restriction increases the dimensional requirements for the included arteries.
This study the FOV is limited to achieve higher temporal resolution, and also to exclude cardiac region to reduce image artifacts.
The current commercial MRI sequences do not allow an imaging protocol that satisfies the temporal requirements dictated by the AIF with an acceptable spatial resolution.
However, there is little knowledge about what exactly constitutes the appropriate balance, and where the compromise between the spatial and temporal resolution should be set.
The provision of this Information, however, requires an adequate description of the R2*-curve, which is not possible if a high spatial sequence is used.
Descriptive markers have the
advantage of being relatively easy to estimate, but possesses, however, a number of limitations.
These limitations are mainly a consequence of the fact that biomarkers do not accurately reflect
contrast medium concentration in the observed tissue and can therefore be affected by the
scanner settings.
These methods can thus demonstrate significant differences between acquisition methods and Individual studies, making direct comparisons between different studies very difficult [50].
However, it is very unclear what these biomarkers reflect physiologically, and how robust they are about variations
in patient-
related factors not directly related to the
physiology of tumors [51].
These circumstances help to limit the suitability of the descriptive biomarkers.
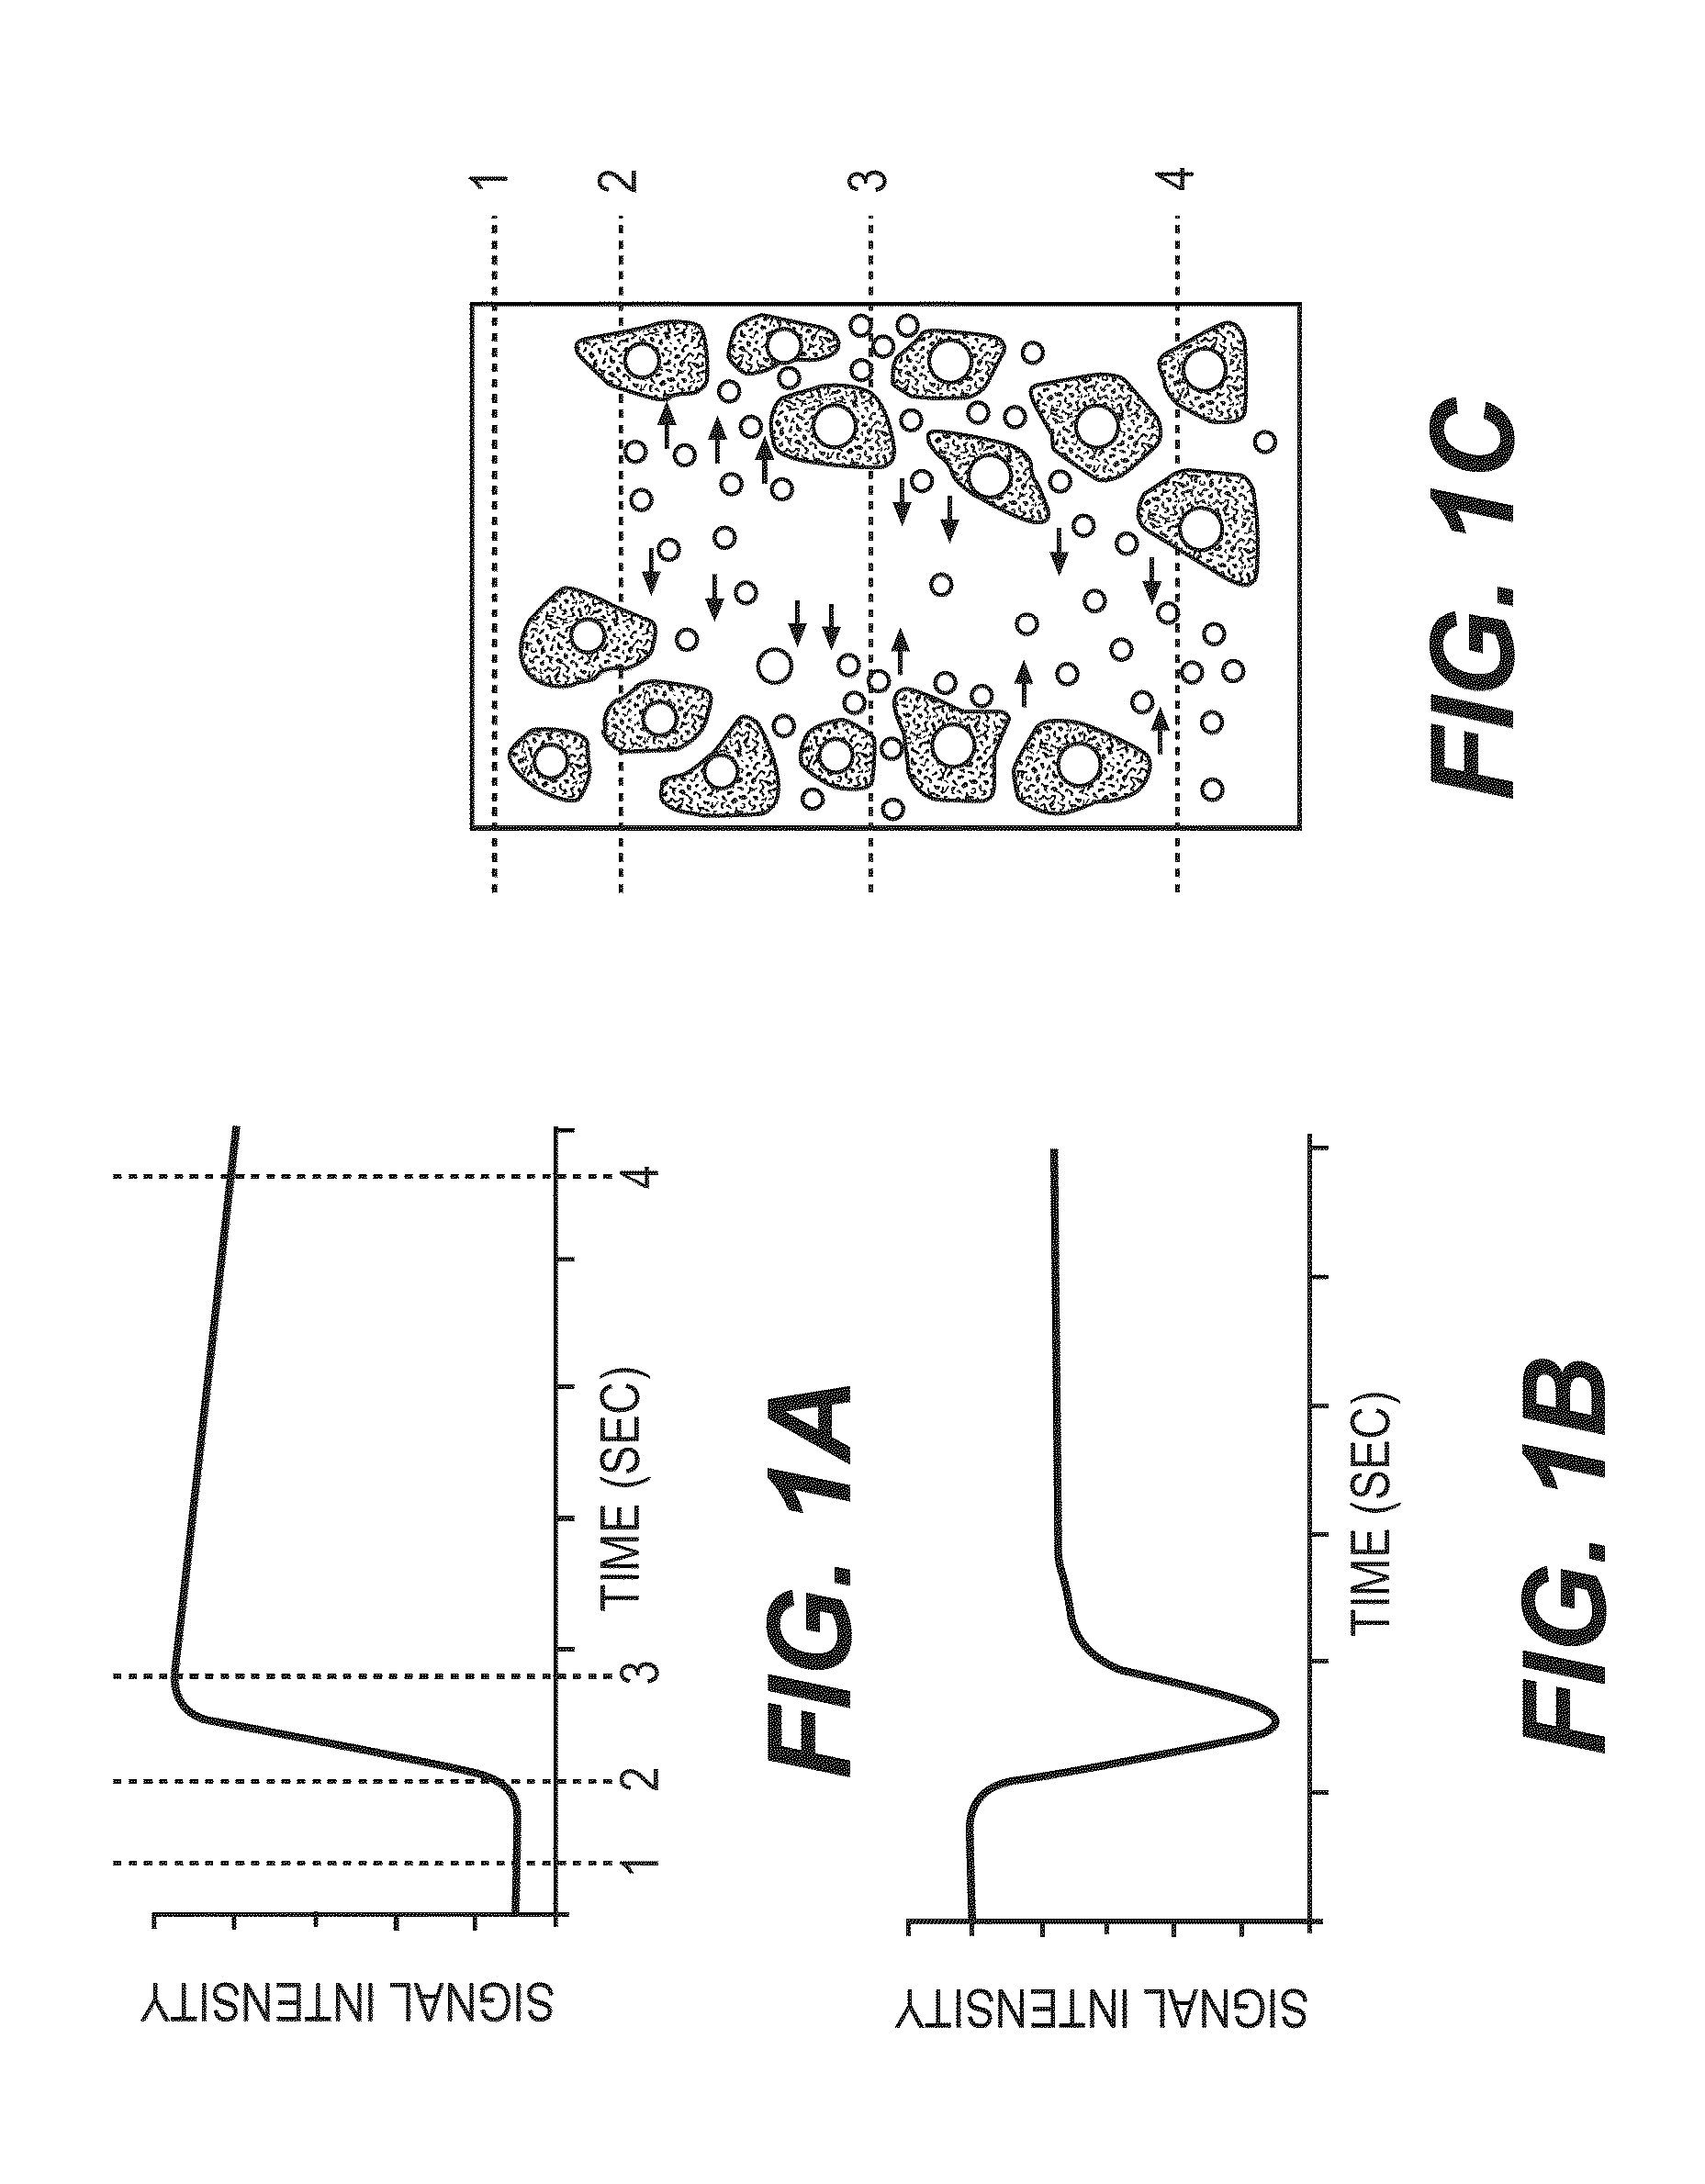
This behavior is consistent for many of the patients, and is especially problematic when the mathematical estimation of the Wash-out.
This error is constructed due to an insufficient estimation
algorithm, and the extent of the SI-curve fluctuating phase.
However, this is not done in the current study.
A latent problem in the use of complex mathematical models is that the more complicated description of the curve there is and the more unknown parameters used to describe it, the more likely it will be for a number of different solutions to be found.
This means that the less specific the acquired explanation is, the less accurate and reliable is the estimations of the underlying parameters.
The application of a multi-parametric two-compartment model would therefore lead to
instability in the analysis and increase the potentiality for error in the estimated
model parameters, referred to as biomarkers.
However, it is not found in previous studies of the fractional
plasma volume of breast lesions, as this often is neglected in the pharmacokinetic two-compartment model.
This negative result is suspected to be related to the element of uncertainty regarding the
kinetics model AIF
deconvolution, as large uncertainties are associated with the measurement of the AIF.
As a result, the signal in the arterial voxels is affected by partial volume effects (PVE), inflow effects and flow artifacts, which in practice will result in an underestimation of amplitude of the
plasma curve.
This is expected but may introduce a high
uncertainty factor if high marker values in the form of blood vessels, are included in the defined parenchymal regions.
It is important to note that a pre-defined mono-exponential
input function is missing details regarding the patient's true arterial contrast gradient, and therefore will produce less accurate and not reproducible kinetic biomarkers.
The registration of two echoes will however lead to an extended recording time, which then limits the achievable spatial resolution and imaging FOV if an acceptable temporal resolution is to be maintained.
In
breast cancer, the analysis of DSC imaging is complicated by the direct T2*-effects from the extravascular contrast agent.
Although a double-echo method effectively removes the T1 contribution, a significant leakage of the contrast agent into the EES is in effect.
Such modeling often requires a number of assumptions, which reflect the limitations of the applied model.
Perhaps the most significant restriction of the various models is the ability to accurately measure an
arterial input function (AIF) for each patient.
This issue represents a major technical challenge and is an active research area.
However, such an
input function is lacking details of the patient's true arterial contrast agent development, and will therefore produce less accurate and not reproducible kinetic biomarkers.
Improper selection or location of the tumor volume may result in the inclusion of contrast enhanced and necrotic or non-enhanced tissue components, and nearby blood vessels.
The consequence of this would be an erroneous interpreting of the physiological properties of the cancerous tissue.
The various biomarkers values are estimated using a pixel-by-pixel method in the acquired images, and a movement of the object will consequently result in estimation errors.
However, the breasts demonstrate a non-
rigid motion, and therefore require the application of very complex correction algorithms.
In particular, the tissue immanent
relaxation rate is a source of uncertainty.
This can be measured by using special MRI sequences, and require separate scans using different repetition times. Such MRI recording is not performed in this study, and it is therefore not possible to estimate the true relationship between the contrast agent concentration and the relative signal change.
However, the Hct factor varies between patients, which will lead to the wrong estimation of the quantitative biomarkers.
This is a result due to the limited spatial resolution of the
system image acquisition, and usually occurs in areas adjacent to two or more tissues.
This results in a larger
point spread function (PSF) and accompanying larger voxels, and thus more likely to introduce significant PVE.
In areas where the PVE is applicable, this will lead to the erroneous description of the specific tissue real
contrast enhancement, which will introduce errors in the estimation of biomarkers.
If the AIF is measured in voxels where PVE is applicable, this will in practice result in a
distortion and underestimation of the amplitude of the plasma curve.
PVE may thus contribute to a poor accuracy and a low reproducibility of AIF measurements.
This is common practice in several studies where PVE is significant, for example, due to low spatial resolution.
Assuming that the corrected marker values are correct, this study shows that a lack of correction of patient CD will result in an overestimation of biomarkers Ktrans, kep, and ve, and an underestimation of biomarker vp.
However, some patients demonstrate unrealistic CD that cannot be explained by the examiner.
Under such circumstances, the
regression analysis leads to unstable risk estimation and it is therefore misleading to a suggest relationships between the model response variable and the applied biomarkers.
These are problems that can occur or get worse if the number of events is too small for the multivariate model, and means that the number of included biomarkers depends on the size of the data.

