Cell-specific signaling biomarker analysis by high parameter cytometry; sample processing, assay set-up, method, analysis

a cell-specific signaling and high-parameter cytometry technology, applied in material analysis, biological material analysis, instruments, etc., can solve the problems of phospho-flow assays, which have typically been performed by fluorescent flow cytometry (fcm), can be difficult to interpret data, and the set-up of compensation settings can be often time-consuming and labor-intensive. achieve the effect of facilitating data interpretation and facilitating interpretation of high-parameter datasets

Active Publication Date: 2018-09-06
DEEPATH MEDICAL
View PDF4 Cites 4 Cited by
  • Summary
  • Abstract
  • Description
  • Claims
  • Application Information

AI Technical Summary

Benefits of technology

[0038]In another aspect, data analysis methods are provided based on user selection of variables such as cell-types, ex vivo perturbations or conditions, select IC analytes. High dimensional plots generated by select parameters can result in patterns that allow interpretation of multiparameter cytometry data and discover correlations such as between biochemical pathways associated with individual pathobiology. Cell type-specific proteomic profiles (mapping antigen expression profile to the identified cells) are provided which can facilitate data interpretation through intuitive visualization of post-gated data with simultaneous displays of cell types, and proportions, that indicate the form and quantity of disease burden. Quantitative data inclusive of cell fractions and expression levels of biomarkers enable comparison of datasets acquired from different time points to monitor therapy response. High dimensional plots based on selection of certain parameters that facilitate interpretation of high parameter datasets are provided.

Problems solved by technology

Dynamic signaling states can be compromised when samples are cryopreserved.
Phospho-flow assays, which have typically been performed by fluorescent flow cytometry (FCM), have limitations due to the number of colors available per analysis tube.
However, overlap of fluorescence emission spectra requires set up of compensation settings that can often be time consuming.
Further, tandem dyes can break down and emit signal at a different wavelength than expected, confounding results.
Thus, evaluating both lineage markers expression on the cell surface and functional intracellular (IC) markers in a single tube assay has not been feasible.
Multi-tube analysis can be time consuming and has precluded precise mapping of functional activity to cell-type, in particular rare cell-types (such as leukemic stem and progenitor cells, dendritic cells, clonal T cells, etc.), some of which require at least 8-9 lineage- and maturation-associated surface markers (such as but not limited to CD3, CD4, CD8, CD11c, CD14, CD16, CD19, CD33, CD34, CD45, CD45RO, CD56, CD90, CD117, CD123) for accurate cell type delineation based on expression level, and presence or absence of markers.
Fluorescent-labeled antibodies are generally more expensive and less stable than metal-tagged antibodies.
Due to the limited availability of commercially available fluorochrome-conjugated antibodies of desired specificity and detectors or channels on clinical flow cytometers, the number of antigen dimensions simultaneously assessed is generally 10 or less.
Despite the wide clinical applicability of FCM, functional attributes in abnormally activated signal transduction pathways or cellular processes are not a routine part of assessment for the purpose of discerning prognostically relevant cell types in clinical diagnostics.
This presents a gap, being a long-felt and unmet need, in the field as surface markers alone are insufficient in distinguishing certain cell types such as but not limited to: a) leukemic stem and progenitor cells from physiologic blasts and hematogones, and b) activated basophil subset as an allergic response.
Also, immunophenotypic criteria establishing a “neoplastic” v. reactive and immunologically activated cell subpopulation with prognostic relevance are not well understood.
Whereas, post-therapy, the distinction of residual CML progenitor cells may have diagnostic value, such is not possible with the current technology.
Detection of these progenitor cells in routine diagnostics has been hampered by the lack of defining markers, and no known way to assess signaling molecules activated due to BCR-ABL kinase activity by current methodologies in diagnostic cytometry.
Similarly, in acute myeloid leukemia, post-therapy minimal residual disease can be challenging to identify for leukemia with minimal deviation in surface phenotype in the CD34+ myeloid blasts.
Distinction from hematogones can likewise be a challenge for diagnosing minimal residual disease in acute lymphoblastic leukemia.
These formalin and alcohol reagents are detrimental to most surface epitopes and cause cells to aggregate.
Thus, these harsh treatments preclude accurate analysis of surface markers, which should ideally be performed on live cells, thus significantly limiting assessment of cell lineage- and maturation-associated proteins expressed on the cell surface of the same cells in the experiment.
Second, due to a limited number of filters and detectors on a fluorescence flow cytometer, a limited number of antigen dimensions can be assessed simultaneously on each cell.
Although as many as 17 colors are theoretically possible in multiparameter cytometry (6), enabling the assessment of 19 parameters including scatter properties on each cell in one tube, there are substantial technical limitations to increasing the colors beyond 8-10.
These include instrument factors such as costliness and bulkiness of additional laser and filter sets, limited available fluorophores and overlapping emission spectra, unstable compounds with tendency of breakdown causing spillover, and low intrinsic brightness precluding their use for low density antigens.
These factors limit the true availability of dyes and channels, and in turn the types of cellular parameters assessed in clinical FCM.
Thus, careful design of panels and selection of antibody conjugates with the appropriate instrumentation can become necessary, which can limit the flexibility and design of such panels.
These shortcomings have also limited the scope of phospho-flow experimentation to simpler systems such as cell lines and frozen mononuclear cells, resulting in yet to be unsolved barriers to advancing the technology.
This unfortunate state of the art poses limitations on cell analysis in complex biologic samples with often >20 different unique identifiable cell types.
However, a robust approach to capturing such signaling biomarker data for translation into the clinical laboratory for clinical applications has been lacking.
While allowing for extensive profiling of individual cells, the disadvantages of the mass cytometry technology include the high instrument cost, substantial (as much as 70-90%) cell loss in sample processing, and lengthy data acquisition times, precluding its use as a clinical diagnostic test.
Therefore, this presents a gap, being a long-felt and unmet need, in the technological capabilities for combining cell identification with multi-analyte functional profiling of biological pathways.
In essence, measuring some or most substantive abnormalities in protein expression levels in order to characterize the dynamic range of such antigens including relevant modified forms that can define and characterize a multitude of non-overlapping cell types is not possible with the current technology.
Thus, cell-based assays that generate cell-specific protein expression profiles and patterns defining particular disease states based on functional attributes are not available for diagnoses and prognostication.

Method used


Image

  • Cell-specific signaling biomarker analysis by high parameter cytometry; sample processing, assay set-up, method, analysis
  • Cell-specific signaling biomarker analysis by high parameter cytometry; sample processing, assay set-up, method, analysis
  • Cell-specific signaling biomarker analysis by high parameter cytometry; sample processing, assay set-up, method, analysis

Examples


example 1

Materials and Methods

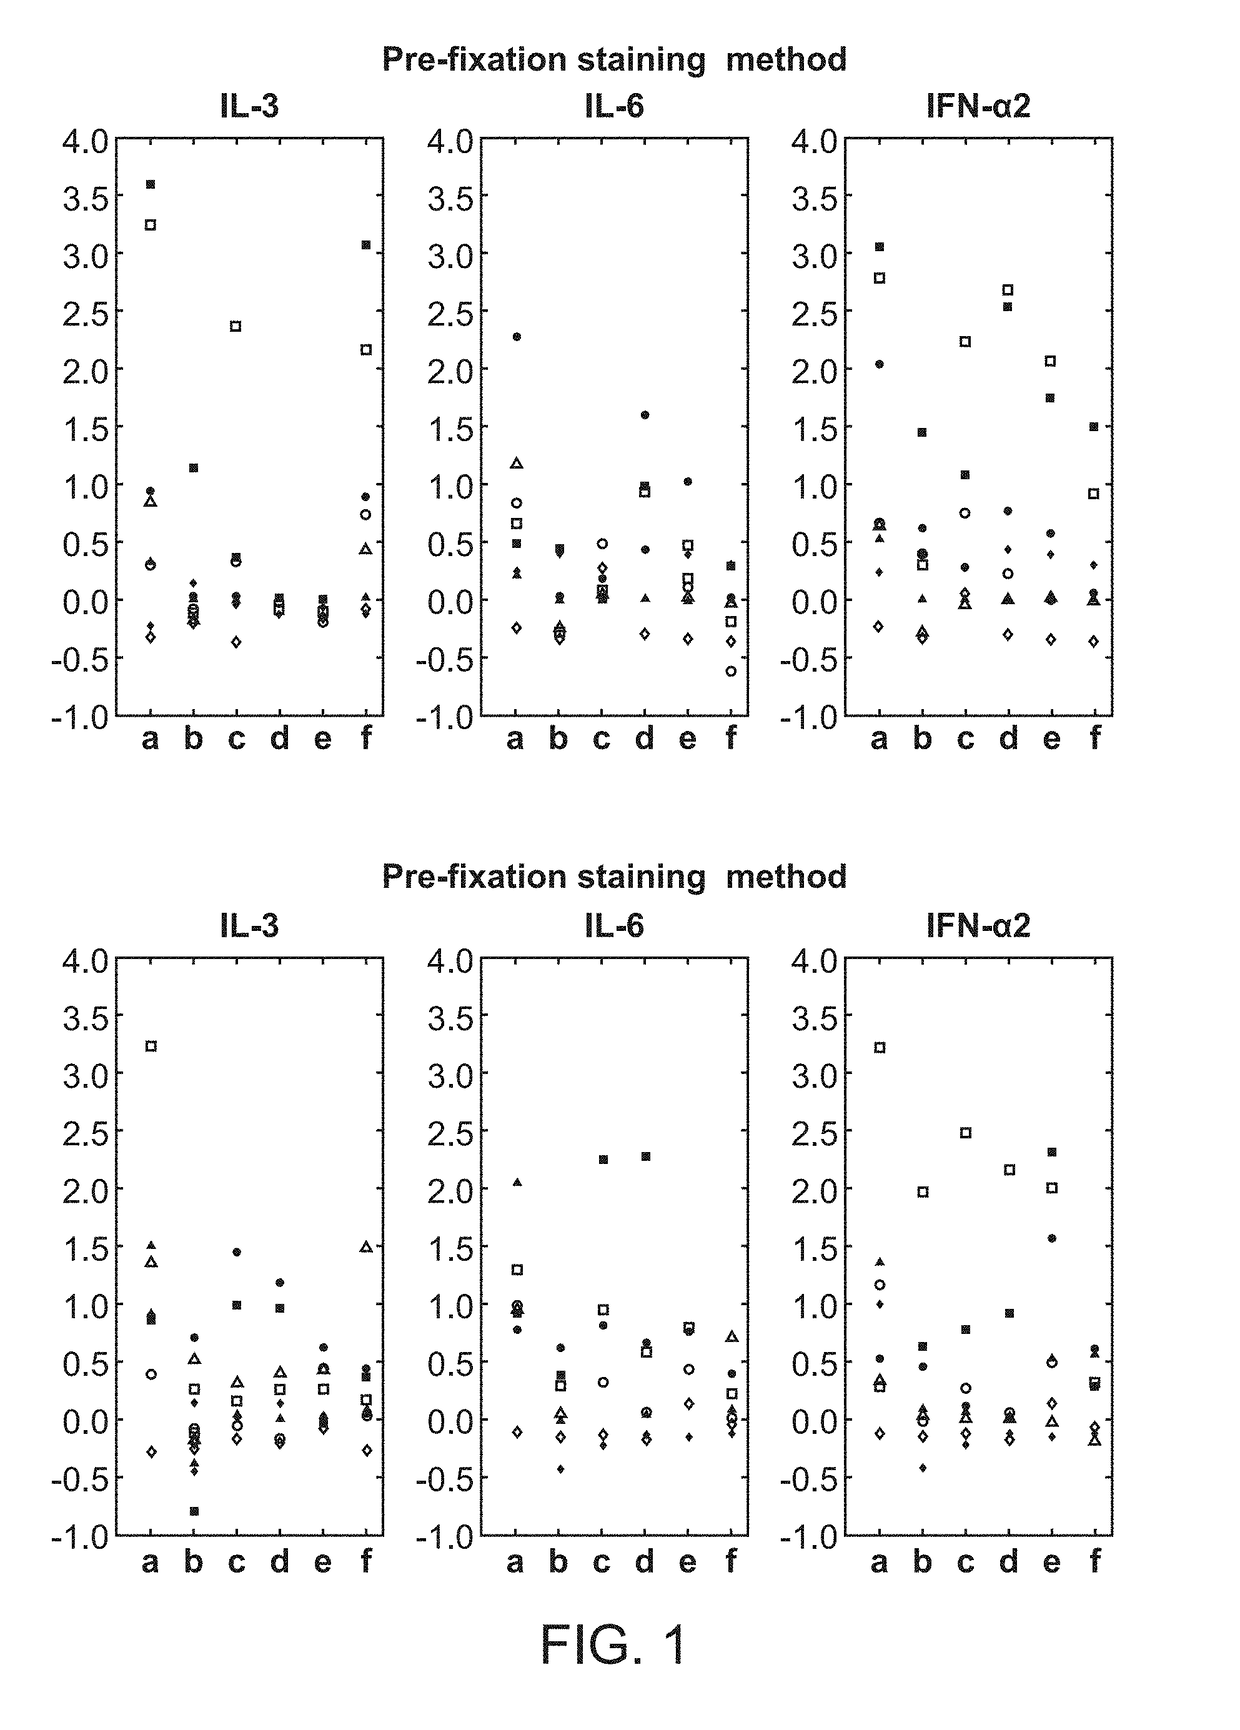
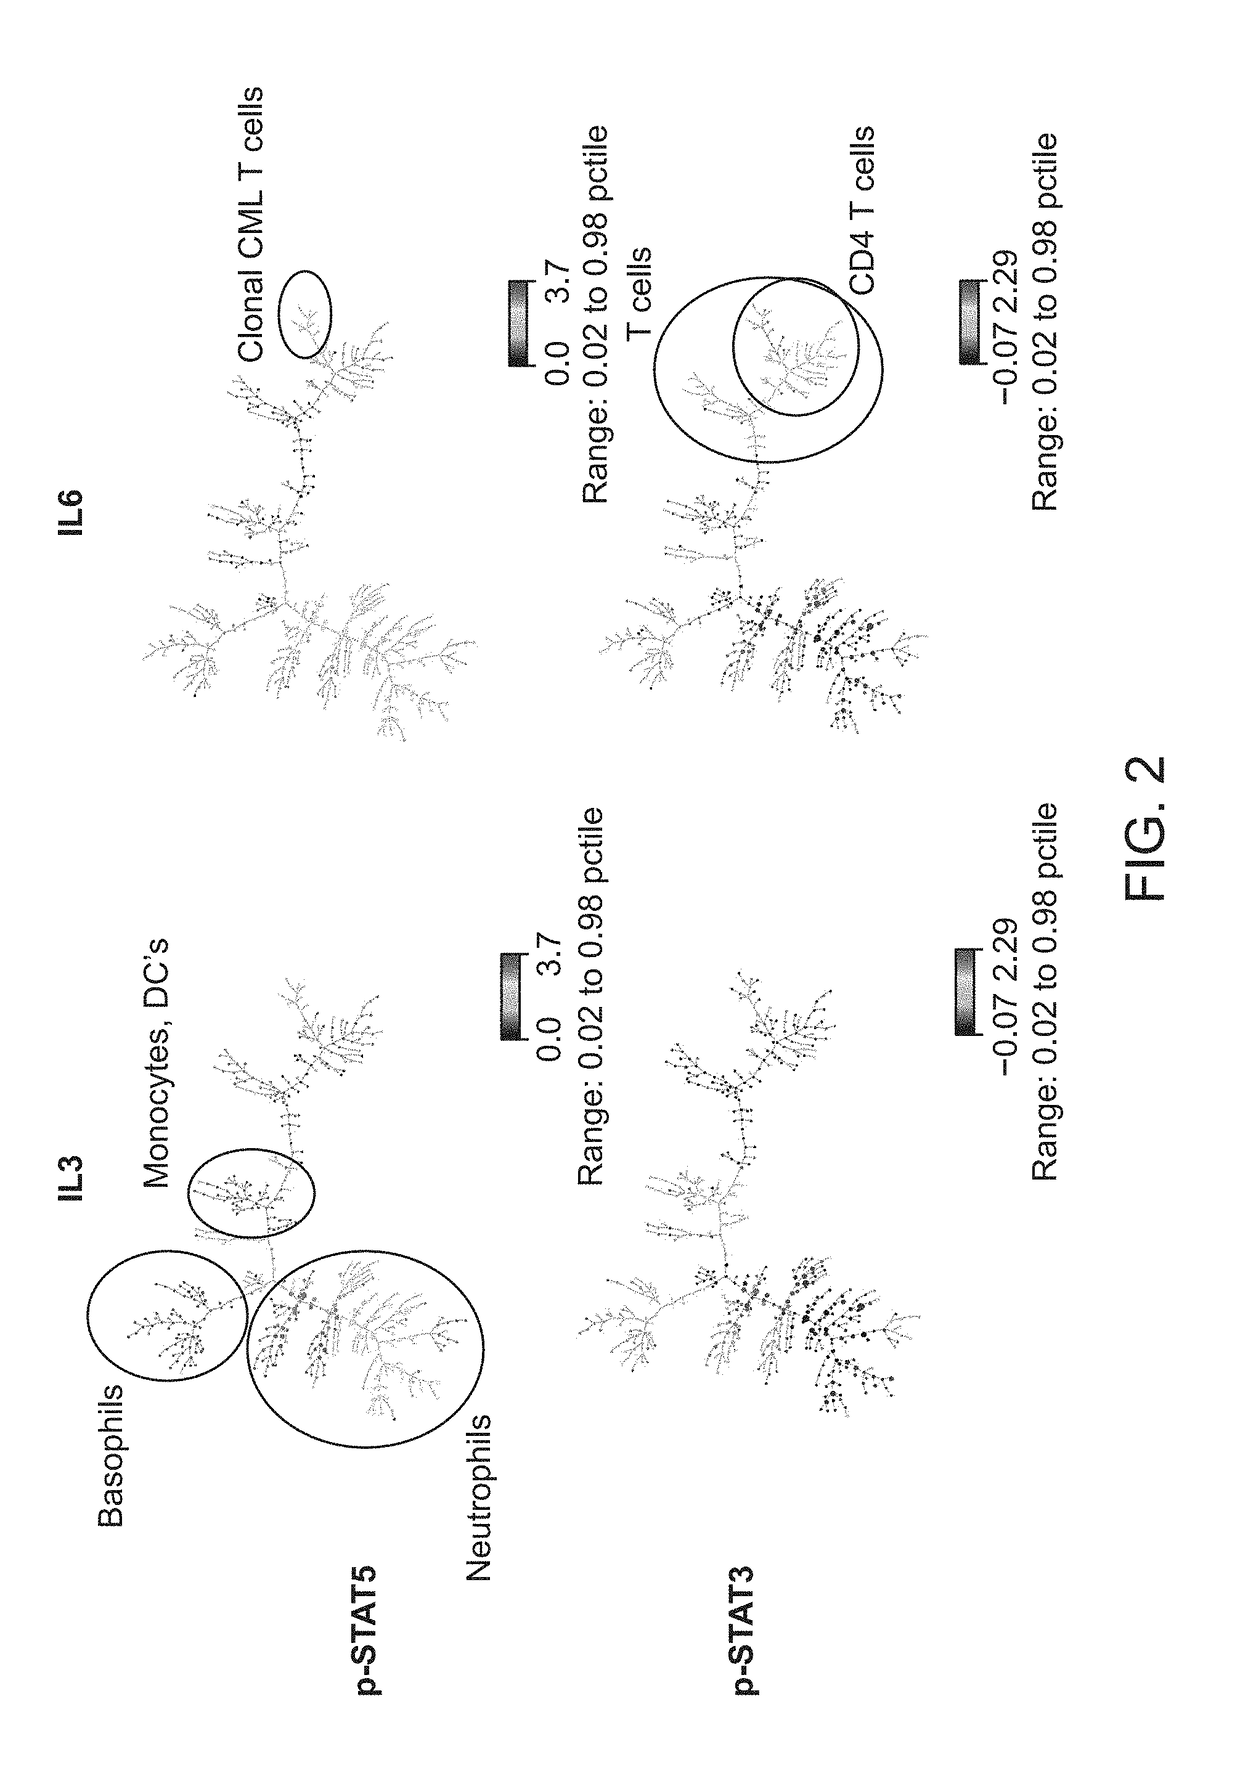
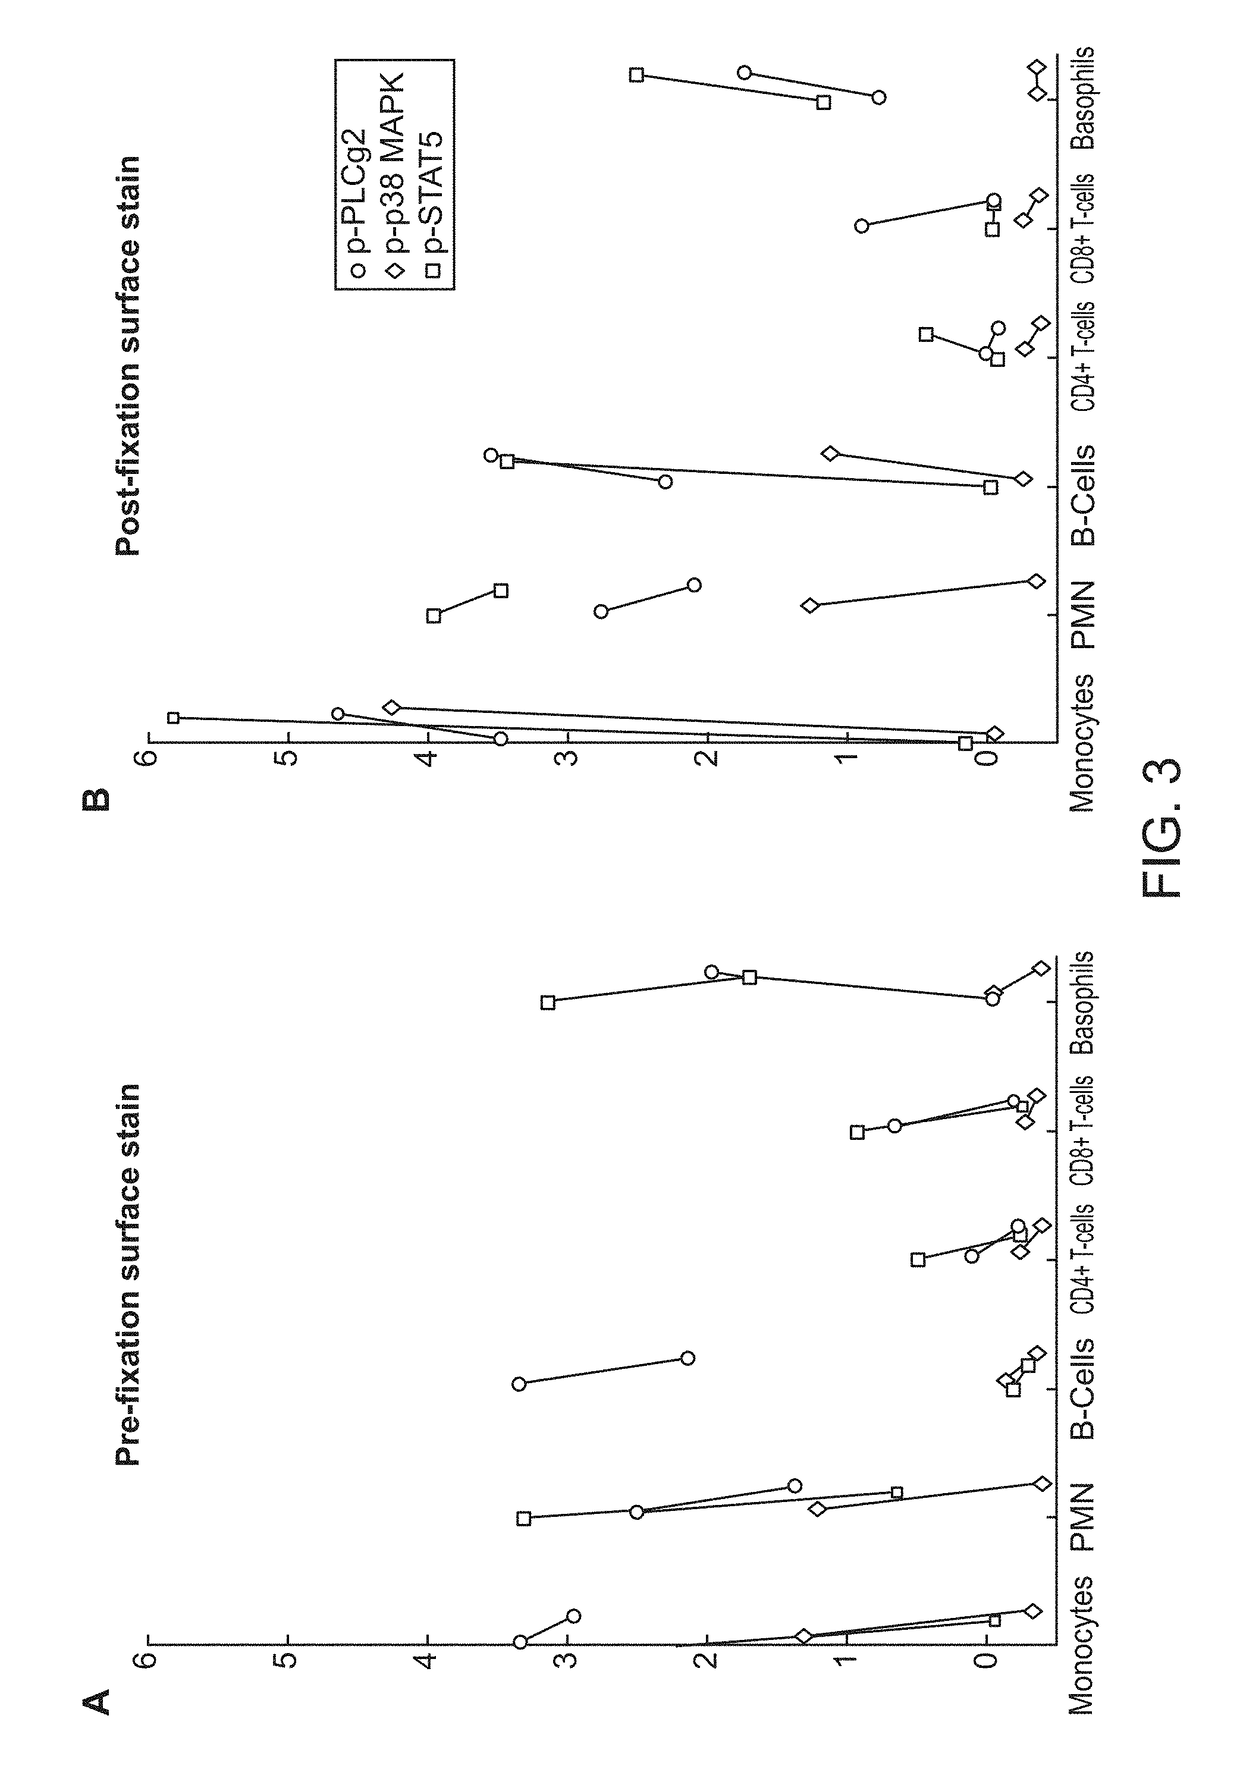
[0148]A fresh whole blood sample from a 54-year-old adult male patient with chronic-phase chronic myelogenous leukemia (CML) who presented with neutrophilic leukocytosis with a total WBC: 33.3 K / □l (PMN: 17.98 K / □l, Lymphocytes: 3.66 K / □l, Monocytes: 0.33 K / □l, Eosinophils: 0.67 K / □l, Basophils: 4.0 K / □l, immature granulocytes: 6.3 K / □l, Blasts: 0.33 K / □l), Hb: 15.8 g / dL, Hct: 47.9%, and PLT: 536 K / □l was obtained from UCSF Helen Diller Family Comprehensive Cancer Center with informed consent. Cell-specific cytokine-induced effects in the leukemic v. normal state were compared. The sample was exposed to: IL3 (50 ng / ml), IL6 (50 ng / ml), IFN□2 10,000 IU / ml or no stimulus, for 15 min at 37° C.

[0149]Using the pre-fixation surface staining method, the modulated samples were then contacted with a cocktail of antibodies towards surface antigens for 15 minutes on ice, followed by fixation with Phosflow Lyse / Fix reagent (BD Biosciences, San Jose, Calif.) 10 minutes at 37...

example 2

Materials and Methods

[0161]A 74 y / o male who had been treated for CML with a BCR-ABL1-targeted tyrosine kinase inhibitor for eight years presented with early molecular relapse after stopping treatment. The complete blood count was: WBC of 7.9K / ul (PMN: 3.43, lymph: 3.41, mono: 0.82), and PLT: 177K / uL, and normal Hgb. BCR-ABL1 p210: 0.285 IS. The unmodified (baseline) whole blood sample obtained with informed consent was fixed in the BD Phosflow lyse / fix buffer 4 hours post-collection, washed with wash buffer, and stained with a panel of metal-conjugated antibodies. Surface staining was performed with antibodies against 1) marker of immaturity (CD34-173Yb), 2) lineage-determining antigens: CD4-145Nd, CD20-147Sm, CD15-148Nd, CD7-149Sm, CD3-150Nd, CD45-154Sm, CD19-156Gd, CD11c-159Tb, CD14-160Gd, CD16-166Er, CD24-168Er, CD8a-170Er, CD66-171Yb, CD56-175Lu, CD33-176Yb; 3) activation- and maturation-associated antigens: CD27-152Sm, CD45RA-153Eu, IgD-161Dy, CD38-167Er, HLA-DR-174Yb; and 4) ...

example 3

[0170]This example, generally depicted in FIG. 14, demonstrates a prophetic panel of markers that contains a combination of surface and IC signaling markers, and additional optional panels of surface markers. The signaling biomarker signature could identify cell type(s) of interest based on analysis of fixed cells in one tube or assay. The surface marker profile and relative proportions of these cell types can be obtained through analysis of live cells in the additional other tubes or assay(s). Independent or integrated analysis of data acquired by each of the methods and extrapolation would be preferable to profile a particular cell subpopulation. For instance, the surface marker expression profile of a target cell subpopulation, initially identified by a certain set of IC attributes: [i1 (−), i2 (+++), i3 (−), i4 (++), i5 (+++)], can be derived by testing a limited set of antibodies measuring a small set of surface attributes on a fixed sample, and an extensive surface marker anal...


PUM

PropertyMeasurementUnit
wavelengthsaaaaaaaaaa

Abstract

The present invention recognizes that current clinical laboratory testing methods for multiparametric single cell analysis are limited to analysis of intact live cells, and are insufficient for identification of signaling activation profile defining certain cell types, including but not limited to neoplastic and immunologically activated cell subsets. One aspect of the present invention generally relates to marker selection in panels to include proteins routinely assessed in standard FCM, while preferably also incorporating markers for surface receptor proteins within activated signaling cascades. A further aspect of the present invention generally relates to panel design for the following indications in neoplastic and non-neoplastic clinical applications as examples of the technology: (a) identification of CML progenitor cell subsets in the setting of disease recurrence after treatment discontinuation or relapse due to treatment resistance, and (b) characterization of activated basophils to predict the severity of an allergic response. Another aspect of the present invention generally relates to methods to measure levels of surface and IC biomarkers in separate or combined assays for robust characterization of each or select cell compartment, and data analysis based on results from each or all method(s) used for optimal detection of the markers. A further aspect of the present invention generally relates to the identification and profiling of cell subpopulations based on analysis of surface markers including those associated with lineage and maturation of cell types and receptor proteins, and the corresponding IC phosphoproteins including those in activated signaling cascades to predict certain disease states or response to treatment.

Description

CROSS-REFERENCE TO RELATED APPLICATIONS[0001]This application is a continuation-in-part of application of U.S. application Ser. No. 15 / 864,144 filed on Jan. 8, 2018, which is a divisional application of U.S. application Ser. No. 14 / 647,414, which is a national stage entry under 35 U.S.C. 371 of PCT International Application PCT / US13 / 72367 filed on 27 Nov. 2013, which claims priority to U.S. Provisional Application No. 61 / 797,002, filed on Nov. 27, 2012, 61 / 797,006, filed on Nov. 27, 2012, and 61 / 797,024, filed on Nov. 27, 2012, and also claims benefit of priority to Provisional Application No. 62 / 500,072 filed on May 2, 2017, all of which are incorporated herein by reference in their entireties.FIELD OF THE INVENTION[0002]The present disclosure relates to methods for sample preparation and quantitation of antigenic biomarkers on individual cells in a multiparametric cell analysis platform such as mass cytometry and also the fields of cell biology, signal transduction, oncogenic sign...

Claims


Application Information

Patent Timeline
Patent Type & Authority Applications(United States)
IPC IPC(8): G01N33/53G01N33/543
CPCG01N33/54366G01N33/5306G01N33/5005G01N33/5091G01N2800/52G01N15/10G01N2015/1006
Inventor DE, JITA
Owner DEEPATH MEDICAL
Why Eureka
Try Eureka