Method for measuring contents of iron ions in different valence states in feed
A technology for iron ions and feed, which is applied in measurement devices, preparation of test samples, and measurement of color/spectral properties, etc. It can solve the problems of complicated electrode substrate preparation and modification process, unsuitable for iron ion determination, and slow color reaction speed. , to achieve the effect of strong anti-interference ability, low detection limit and high sensitivity
- Summary
- Abstract
- Description
- Claims
- Application Information
AI Technical Summary
Problems solved by technology
Method used
Image
Examples
Embodiment 1
[0052] Example 1: Detection scheme of iron ions in different valence states in feed
[0053] (1) Prepare the solution
[0054] A1 solution: phenanthrolazine total iron working solution, including 4.0mM phenanthrolazine solution, 0.1M hydroxylamine hydrochloride solution and 0.1M sodium thiosulfate solution, the buffer is acetic acid solution with ph=6;
[0055] Solution A2: ferrous phenanthrolazine working solution, including 4.0 mM phenanthrolazine solution and 0.1 M sodium thiosulfate solution, the buffer is acetic acid solution with ph=6;
[0056] Solution B: blank solution, 0.2M acetic acid buffer solution;
[0057] Solution C: iron standard solutions 0, 0.1, 0.5, 1, 2, 4, 6, 8 μg / mL, respectively C1-C8 iron standard solutions;
[0058] (2) Sample pretreatment
[0059] The feed sample was pulverized and mixed with 1% trichloroacetic acid solution at a ratio of 1:100 (g / ml). After shaking, it was filtered through quantitative filter paper or centrifuged to obtain the sup...
Embodiment 2
[0070] Embodiment 2: the drawing of working curve
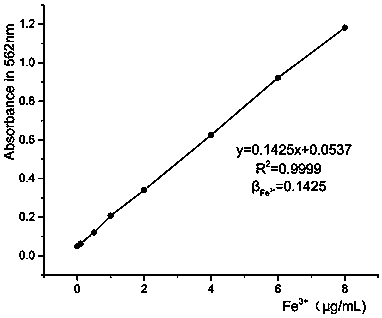
[0071] Take 0, 0.1, 0.5, 1, 2, 4, 8 μg / mL of Fe 3+ Add 100 μL of the standard solution into the 96-well plate, and then add 100 μL of the total iron working solution, and measure the absorbance at 562 nm with a microplate reader after 30 min. Fig. 1 measures Fe for 5 times 3+ Regression curve for the mean of the standard series. It can be seen from the results that the correlation coefficient r is 0.9999, and the measurable concentration range is 0.1-8 μg / L. The iron content showed a linear relationship in the range of 0.1-8 μg / L, and the regression equation was y=0.1425x+0.0537.
Embodiment 3
[0072] Embodiment 3: the selection of detection wavelength
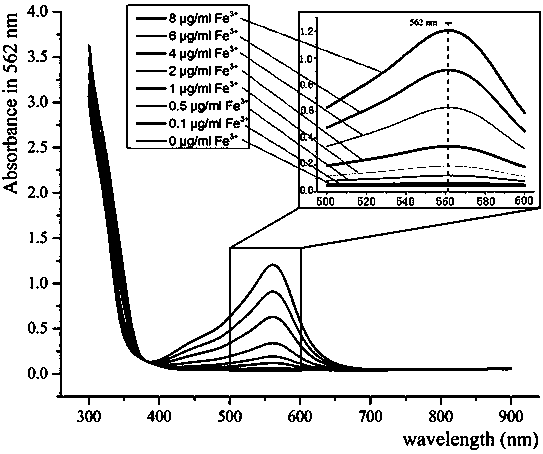
[0073] Such as figure 2 It was shown that the maximum absorption wavelength of Fe-phenanthrolazine complex is 562 nm, therefore, in order to improve detection sensitivity and reduce interference, we choose 562 nm as the optimal wavelength for the determination of iron ions.
PUM
 Abstract
Description
Claims
Application Information
 - R&D
- Intellectual Property
- Life Sciences
- Materials
- Tech Scout
- Unparalleled Data Quality
- Higher Quality Content
- 60% Fewer Hallucinations
Browse by: Latest US Patents, China's latest patents, Technical Efficacy Thesaurus, Application Domain, Technology Topic, Popular Technical Reports.
© 2025 PatSnap. All rights reserved.Legal|Privacy policy|Modern Slavery Act Transparency Statement|Sitemap|About US| Contact US: help@patsnap.com


